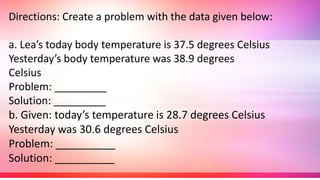
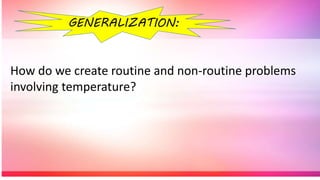
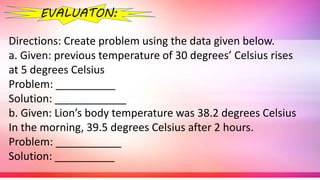
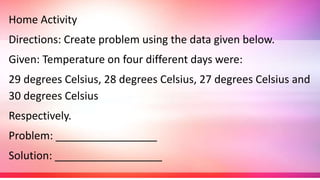
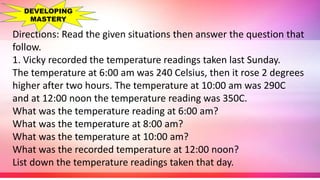
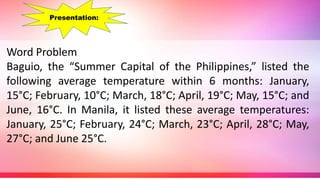
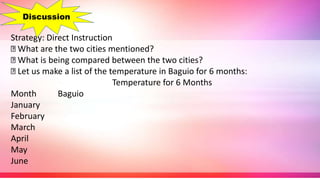
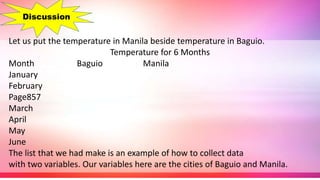
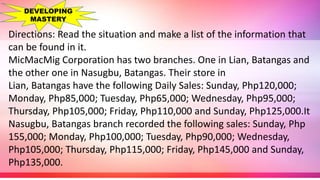
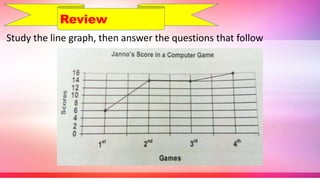
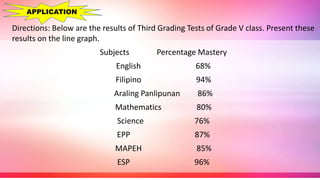
Creates problems involving temperature with reasonable
answers.
Code: M5ME-IVg-88,
Give the temperature when the mercury is:
1. At the freezing point of water
2. At the boiling point of water
3. 10.5 degrees Celsius below the normal temperature
4. 25 degrees celsius above the freezing point of water
5. 1.5 degrees Celsius below the normal body
temperature
Drill
2. Review
Reading temperature using an improvised thermometer
Motivation
What does your mother do every time you have fever?
Mother wants to find out if her son has fever. She got her
thermometer and found out that the mercury level in the
thermometer is at 38.5 degrees Celsius. If the normal body
thermometer is 37.5 degrees Celsius.
Presentation:
Have the class create a problem on
temperature given the above information
Strategy: Thinking Skills (RMFD)
a. Divide the class into group of 5s. Using the problem
presented, instruct the pupils to help each other solve the
problem. Give them enough time to perform on it.
b. After all the group had done with their output, ask
somebody from the group the to discuss the solution done
Directions: Group the pupils into group of 5s. Encourage the
group to create a problem based on the information given
below.
At the start of the marathon the thermometer registered a
thermometer of 36 degrees Celsius. After the marathon, the
temperature dropped by 4 degrees Celsius.
Directions: Create a problem with the data given below:
a. Lea’s today body temperature is 37.5 degrees Celsius
Yesterday’s body temperature was 38.9 degrees
Celsius
Problem: _________
Solution: _________
b. Given: today’s temperature is 28.7 degrees Celsius
Yesterday was 30.6 degrees Celsius
Problem: __________
Solution: __________
How do we create routine and non-routine problems
involving temperature?
GENERALIZATION:
Directions: Create problem using the data given below.
a. Given: previous temperature of 30 degrees’ Celsius rises
at 5 degrees Celsius
Problem: __________
Solution: ____________
b. Given: Lion’s body temperature was 38.2 degrees Celsius
In the morning, 39.5 degrees Celsius after 2 hours.
Problem: ___________
Solution: __________
EVALUATON:
Home Activity
Directions: Create problem using the data given below.
Given: Temperature on four different days were:
29 degrees Celsius, 28 degrees Celsius, 27 degrees Celsius and
30 degrees Celsius
Respectively.
Problem: _________________
Solution: __________________
Collects data on one variable using any
source
Code: M5SP- IVg - 1.5
Drill Naming the Parts of a Graph
Strategy: Relay Game
Mechanics:
1. Divide the class into groups of 5 members each.
2. Let them form four lines.
3. Flash the cards one after the other.
4. The members take turn in giving the answer. The member who
answers correctly goes to the end of the line.
5. The group that returns to its original position first is the winner.
Drill
Who among you have a collection of books?
What kind of books do you collect? (etc.)
MOTIVATION
A bookstore clearance sale showed that there were 750
books sold during the first day, 500 books during the second
day of the sale, 430 books, 150 books and 135 on the third,
fourth and fifth day respectively.
Presentation:
• How many books were sold during the first day?
• How many books were sold during the second day?
• What is the total number of books sold during the third
day? fourth
• day? fifth day
• Make an organized list of the total number of books sold
during the
• sale.
Discussion
Directions: Read the given situations then answer the question that
follow.
1. Vicky recorded the temperature readings taken last Sunday.
The temperature at 6:00 am was 240 Celsius, then it rose 2 degrees
higher after two hours. The temperature at 10:00 am was 290C
and at 12:00 noon the temperature reading was 350C.
What was the temperature reading at 6:00 am?
What was the temperature at 8:00 am?
What was the temperature at 10:00 am?
What was the recorded temperature at 12:00 noon?
List down the temperature readings taken that day.
DEVELOPING
MASTERY
2. Man Ben owns a sari-sari store. He records his sales every
day. Last Sunday his sale amounted to Php1500. On the next
day,
he was able to sell goods amounting to Php800. His sales on
Tuesday, Wednesday, Thursday and Friday were Php600,
Php500, Php900 and P500 respectively. His highest sale was
on Saturday which was Php1200.
List down the data presented in the sales.
Let the pupils conduct a survey as to their favorite color. Let
them ask 10 of their classmates and record their responses
APPLICATION
Lead the pupils to give the generalization.
To collect data on one variable using any source
we can use:
observation
survey
listing or gathering data from a source
GENERALIZATION:
Directions: Collect the variables in the following problem by making
a list.
1. Mr. Arceo recorded the number of foreign visitors to an
exhibition on five days. There were 35 foreigners who watched the
show on Wednesday, 40 on Thursday, 18 on Friday,
55 on Saturday and 110 on Sunday.
2. Janina had an inventory of the monthly sales of magazines from
January to May. Last January, there were 650 magazines sold. Five
hundred were sold on February,
700 on March, 300 on April and 900 on May.
EVALUATON:
3. The Sky Ranch management accounted the number of people who
arrived during its first week of operation. One thousand two hundred
tourists came on its opening day.
On its second day of operation, 900 visitors arrived. There were 650
people came on the third day, 1300 on the fourth day and
800 on the fifth day.
Directions: Create problem using the data given below.
a. Given: previous temperature of 30 degrees’ Celsius rises
at 5 degrees Celsius
Problem: __________
Solution: ____________
You want know which types of pets are the most popular in the class.
Collect your data by counting the number of pets owned by the
students in the class. (Add more categories if needed)
Dog _________
Cat _________
Bird _________
Fish _________
Rabbit _________
Horse _________
ASSIGNMENT
Collects data on two variables using any source
Code: M5SP – IVg.1.
Directions: Name the following graphs.
Drill
Directions: Read the problems then list the data presented in
it.
Mang Andres has a small sari-sari store. His daily earnings
were: Monday, Php 1,000; Tuesday, Php 2,000; Wednesday,
Php1,500, Thursday, Php3,000;
Friday, Php1,800 and Saturday,Php 2,800.
Review
Diana” Beach Resort clerk noticed the increasing number of
reservations in their rooms. On 2012, they have 500
reservations; 2013, 1,000 reservations;
2014, 1,500 reservations;
REVIEW
What city is known to be the “Summer Capital of
the Philippines? How
do you compare its temperature to Manila?
MOTIVATION
Word Problem
Baguio, the “Summer Capital of the Philippines,” listed the
following average temperature within 6 months: January,
15°C; February, 10°C; March, 18°C; April, 19°C; May, 15°C; and
June, 16°C. In Manila, it listed these average temperatures:
January, 25°C; February, 24°C; March, 23°C; April, 28°C; May,
27°C; and June 25°C.
Presentation:
Strategy: Direct Instruction
What are the two cities mentioned?
What is being compared between the two cities?
Let us make a list of the temperature in Baguio for 6 months:
Temperature for 6 Months
Month Baguio
January
February
March
April
May
June
Discussion
Let us put the temperature in Manila beside temperature in Baguio.
Temperature for 6 Months
Month Baguio Manila
January
February
Page857
March
April
May
June
The list that we had make is an example of how to collect data
with two variables. Our variables here are the cities of Baguio and Manila.
Discussion
Directions: Read the situation and make a list of the information that
can be found in it.
MicMacMig Corporation has two branches. One in Lian, Batangas and
the other one in Nasugbu, Batangas. Their store in
Lian, Batangas have the following Daily Sales: Sunday, Php120,000;
Monday, Php85,000; Tuesday, Php65,000; Wednesday, Php95,000;
Thursday, Php105,000; Friday, Php110,000 and Sunday, Php125,000.It
Nasugbu, Batangas branch recorded the following sales: Sunday, Php
155,000; Monday, Php100,000; Tuesday, Php90,000; Wednesday,
Php105,000; Thursday, Php115,000; Friday, Php145,000 and Sunday,
Php135,000.
DEVELOPING
MASTERY
Directions: List the variables found in the problems below.
1. Ceejay and Clarence are working students. They are working part-
time at Matabungkay Beach Resort as waiters last May. Ceejay
received the following: Week 1, Php1,500; Week 2, P1,250; Week 3,
Php1,800 and Week 4, Php2,100. Clarence received these amount:
Week 1, Php1,400; Week 2, Php1,100; Week 3, Php1,800 and Week 4,
Php1,900.
2. Anna and Annie are twins. Their mother, Angie kept a record of the
twins’ weight. At the age of 1-year-old, Anna is 8.5 kg while Annie is
8.75 kg. At two, Anna is 12 kg and Annie is 11.9 kg. At three, Anna is
14.8 kg while Annie is 15.2 kg.
APPLICATION
How do we collects data with two or more variables?
To collect data with two or more variables, we:
- Read and analyze the problem
- Make a list of the variables in the problem
GENERALIZATION:
Directions: Collect the variables in the following problem by making a
list
1. The Art Museum recorded the number of visitors who came in
January February, and March. In January, 120 visitors came on
Sunday, 70 on Monday, 60 on Tuesday, 100 on Wednesday, 60 on
Thursday, 80 on Friday, and 120 on Saturday. In February, there were
80 visitors on Sunday, 80 on Monday, 100 on Tuesday, 80 on
Wednesday, 80 on Thursday, 60 on Friday and 140 on Saturday. In
March, their visitors were: 100 on Sunday, 105 on Monday, 80 on
Tuesday, 70 on Wednesday, 75 on Thursday, 90 on Friday and 110 on
Saturday.
EVALUATON:
2. During the Recycling Drive of San Diego Elementary School, they
collected cans and newspaper from the barangay. They collections of
the cans were: 200 for Grade 1, 250 for Grade 2, 100 for Grade 3, 300
for Grade 4, 500 for Grade 5 and 350 for Grade 6. They collected the
following number of newspapers: 125 for Grade 1, 100 for Grade 2,
90 for Grade 3, 125 for Grade 4, 85 for Grade 5 and 120 for Grade 6.
EVALUATON:
Following problem by making a list.
1. Balibago Elementary School and Prenza Elementary School joined
the Green Movement. They planted seedlings along the highway.
Balibago Elementary School planted 25 ipil-ipil; 40 acacia; 30
lauan; 20 narra and 35 mango. Prenza Elementary School planted
these seedlings: 30 ipil-ipl; 35 acacia; 30 lauan; 25 narra and 30
mango.
2. St. Bernards Academy has the following enrolment for the last 4
years: 2012, 180 male and 220 female; 2013, 205 male and 192
female; 2014, 280 male and 320 female; and 2015, 305 male and
340 female.
ASSIGNMENT
Organizes data in tabular form
Code: M5SP-IVg-2.5,
Directions: Arrange the sets of data from least to
greatest and in vice versa.
Drill
Reviewing Previous Lesson
Directions: Read the problem. Collect data that are necessary to
answer the questions that follow.
Marcela Agoncillo’s ancestral house was one of the most
visited historical houses in town of Taal. Its weekly average
tourist-visitor attendance reaches up to 100. Monday-110,
Tuesday-120, Wednedsay-90, Thursday-105, Friday-125,
Saturday-100.
Review
Which day of the week has the most number of tourists that
visited the house?
Which day of the week has the least number of tourists that
visited the house?.
REVIEW
Suppose that a statistical data and a graph picturing the
data are displayed on a board.
Which would you notice first? Why?
MOTIVATION
Word Problem
Miss Valdez has just finished checking the test papers of he
pupils in Math. The scores of the pupils are the following:
Presentation:
Can you tell what the lowest and highest scores
are easily?
Can you easily give any conclusion about the result
of the test with the given data? Why?
How will you arrange these data?
Discussion
Strategy: Tabulating Data
Materials: table
Mechanics:
a. Form the pupils into 5 groups.
b. Provide each group with a frequency table and let them count and
tally the result from lowest to highest score
DEVELOPING
MASTERY
DEVELOPING
MASTERY
Score Tally Frequency
15 II 2
16 II 2
17 II 2
18 III 3
20 IIII 4
25 IIIII-II 7
26 I 1
30 I 1
35 III 3
36 I 1
40 II 2
TOTAL 28
Directions: Study this problem. Organize the data in table form.
1. Nancy and her friend Mackie sold their egg harvest in 5 days. On
the first day, 30 dozens of eggs were delivered to Mrs. Castro’s
store. 5 dozens were carried to Triple A Store by the following day.
Both 20 dozens of eggs were sent to Mrs. De Villa and Lucky Store,
15 dozens were carried to Triple M.
2. The librarian made this report of the number of pupils by grade
level who used the library for a period of one month. Grade1-50,
Grade 2-70, Grade 3- 65, Grade 4 – 120, Grade 5-135 and Grade 6 –
200.
APPLICATION
How do we organize data?
- We organize data through tabular form. This would
help in the plotting of data or making graphs
GENERALIZATION:
Fifteen pupils were asked of their favorite native game. Below are
their responses.
Directions: Organize the data and complete the frequency table
Native Game Tally Frequency
Answer These:
1. What is the pupils’ most favorite game?
2. What is the pupils’ least favorite game?
EVALUATON:
Collect data about the TV programs that the grade five pupils in
your school prefer to watch. Organize and present the data collected
in tabular form
ASSIGNMENT
Presents data in a line graph
Code: M5SP-IVg-2.5
Drill on plotting points on a grid board
1) (1,2) 4) (3,6)
2) (4,5) 5) (5,7)
3) (8,12) 6) (9,3)
Strategy:
a) Form groups of five. Give each a grid board, a piece of chalk and cards
wherein the ordered pairs are written.
b) At the signal “Go”, pupils will plot the points on the grid board.
c) The group who finishes first and with the most number of correct answers
wins the game.
Drill
Study the line graph, then answer the questions that follow
Review
a) In what games did Janno get the highest points? How many points?
b) In what games did he get the same points. How many points?
c) Find his total points in all the games.
d) In what part of the game is Janno more capable of playing? Why?
e) What is the line graph all about?
REVIEW
What are other that suitable to present on a line graph?
Today we are going to learn presenting data on a line
graph.
Line graphs are best for data that show trends such as
increases and decreases
MOTIVATION
Cristy would like to make a line graph about her scores in Spelling for the month
of January as show below
Cristy’s Average Score in Spelling in January.
Presentation:
Week 1 50
Week 2 48
Week 3 46
Week 4 49
What is the title of the line graph?
What information is on the vertical axis?
What information is on the horizontal axis?
Let us help Cristy in presenting her scores in a line graph.
a) Let the pupils work in group.
b) Let them plot the x and y axes on the grid.
c) Discuss how to select a scale or interval in presenting the data
given on the problem.
Note: Point out that the choice of scale can make difference on how
the graph would look like?
Discussion
d) Guide the pupils how the vertical and horizontal sides of the graph
should be labeled.
(Note: Explain that the dependent variable quantity occupies the y-
axis)
e) Have them mark the points where the weeks and score intersect.
f) Then, have them connect with a ruler the points on the grid.
g) Emphasize neatness and orderliness in making their graphs.
h) Discuss with the pupils the line graph presented by answering the
comprehension questions.
a. What is the title of the graph?
b. In which week was the highest score of Cristy?
c. In which week did Cristy get a lowest score?
d. What data was presented on the x-axis? y-axis?
Strategy: Cooperative Learning
Mechanics:
a) Class will be divided into 3 groups.
b) Each group will be given an
Directions: Use a line a graph to present the data below.
DEVELOPING
MASTERY
Group I
Result of an Experiment
Height of Plant Weeks
1 cm 1st
2 cm 2nd
2.5 cm 3rd
3.5 cm 4th
4 cm 5th
6 cm 6th
Group II Pupils’ Record of Absences in Grade V-Rose
Week No. of Pupils
1 10
2 8
3 7
4 4
5 3
6 0
7 2
8 5
Group III Patrick’s Record of Deposits
Month Amount of Deposit
June P 150
July P 200
August P 100
September P 150
October P 300
November P 250
December P 500
c) Pupils will mark their horizontal and vertical axes.
d) Select a scale or interval in presenting the given data.
e) Teacher guides pupils what data should be presented in each axis.
(Note: The dependent quantity occupies the y-axis.)
f) Let them mark the points using the tabulated data.
g) Ask them to connect the plotted points.
h) Each group take turns in presenting or discussing their line graph
Directions: Below are the results of Third Grading Tests of Grade V class. Present these
results on the line graph.
Subjects Percentage Mastery
English 68%
Filipino 94%
Araling Panlipunan 86%
Mathematics 80%
Science 76%
EPP 87%
MAPEH 85%
ESP 96%
APPLICATION
In what subject do pupils need improvement?
Why?
APPLICATION
What steps have you learned in presenting data on the
line graph?
GENERALIZATION:
Directions: Study these data. Organize them in table form. Decide
what interval to use, then present it on a line graph.
The following data are the number of eggs sold by Nancy in one
Week:
May 5 – 60 dozens; May 6- 50 dozens; May 7- 25 dozens;
May 8- 65 dozens; May 9- 70 dozens
EVALUATON:
Directions: Do the following activities.
1. Measure your room temperature by the hour for 5 hours then
present this data on a line graph.
2. Chart your own scores in your 5 Math quizzes. Present this data on
a line graph.
ASSIGNMENT
Math 5 Quarter 4 Week 7 D1-5.pptx

Math 5 Quarter 4 Week 7 D1-5.pptx

  • 1.
    Creates problems involvingtemperature with reasonable answers. Code: M5ME-IVg-88,
  • 3.
    Give the temperaturewhen the mercury is: 1. At the freezing point of water 2. At the boiling point of water 3. 10.5 degrees Celsius below the normal temperature 4. 25 degrees celsius above the freezing point of water 5. 1.5 degrees Celsius below the normal body temperature Drill
  • 4.
    2. Review Reading temperatureusing an improvised thermometer
  • 5.
    Motivation What does yourmother do every time you have fever?
  • 6.
    Mother wants tofind out if her son has fever. She got her thermometer and found out that the mercury level in the thermometer is at 38.5 degrees Celsius. If the normal body thermometer is 37.5 degrees Celsius. Presentation:
  • 7.
    Have the classcreate a problem on temperature given the above information
  • 8.
    Strategy: Thinking Skills(RMFD) a. Divide the class into group of 5s. Using the problem presented, instruct the pupils to help each other solve the problem. Give them enough time to perform on it. b. After all the group had done with their output, ask somebody from the group the to discuss the solution done
  • 9.
    Directions: Group thepupils into group of 5s. Encourage the group to create a problem based on the information given below. At the start of the marathon the thermometer registered a thermometer of 36 degrees Celsius. After the marathon, the temperature dropped by 4 degrees Celsius.
  • 10.
    Directions: Create aproblem with the data given below: a. Lea’s today body temperature is 37.5 degrees Celsius Yesterday’s body temperature was 38.9 degrees Celsius Problem: _________ Solution: _________ b. Given: today’s temperature is 28.7 degrees Celsius Yesterday was 30.6 degrees Celsius Problem: __________ Solution: __________
  • 11.
    How do wecreate routine and non-routine problems involving temperature? GENERALIZATION:
  • 12.
    Directions: Create problemusing the data given below. a. Given: previous temperature of 30 degrees’ Celsius rises at 5 degrees Celsius Problem: __________ Solution: ____________ b. Given: Lion’s body temperature was 38.2 degrees Celsius In the morning, 39.5 degrees Celsius after 2 hours. Problem: ___________ Solution: __________ EVALUATON:
  • 13.
    Home Activity Directions: Createproblem using the data given below. Given: Temperature on four different days were: 29 degrees Celsius, 28 degrees Celsius, 27 degrees Celsius and 30 degrees Celsius Respectively. Problem: _________________ Solution: __________________
  • 14.
    Collects data onone variable using any source Code: M5SP- IVg - 1.5
  • 15.
    Drill Naming theParts of a Graph Strategy: Relay Game Mechanics: 1. Divide the class into groups of 5 members each. 2. Let them form four lines. 3. Flash the cards one after the other. 4. The members take turn in giving the answer. The member who answers correctly goes to the end of the line. 5. The group that returns to its original position first is the winner. Drill
  • 16.
    Who among youhave a collection of books? What kind of books do you collect? (etc.) MOTIVATION
  • 17.
    A bookstore clearancesale showed that there were 750 books sold during the first day, 500 books during the second day of the sale, 430 books, 150 books and 135 on the third, fourth and fifth day respectively. Presentation:
  • 18.
    • How manybooks were sold during the first day? • How many books were sold during the second day? • What is the total number of books sold during the third day? fourth • day? fifth day • Make an organized list of the total number of books sold during the • sale. Discussion
  • 19.
    Directions: Read thegiven situations then answer the question that follow. 1. Vicky recorded the temperature readings taken last Sunday. The temperature at 6:00 am was 240 Celsius, then it rose 2 degrees higher after two hours. The temperature at 10:00 am was 290C and at 12:00 noon the temperature reading was 350C. What was the temperature reading at 6:00 am? What was the temperature at 8:00 am? What was the temperature at 10:00 am? What was the recorded temperature at 12:00 noon? List down the temperature readings taken that day. DEVELOPING MASTERY
  • 20.
    2. Man Benowns a sari-sari store. He records his sales every day. Last Sunday his sale amounted to Php1500. On the next day, he was able to sell goods amounting to Php800. His sales on Tuesday, Wednesday, Thursday and Friday were Php600, Php500, Php900 and P500 respectively. His highest sale was on Saturday which was Php1200. List down the data presented in the sales.
  • 21.
    Let the pupilsconduct a survey as to their favorite color. Let them ask 10 of their classmates and record their responses APPLICATION
  • 22.
    Lead the pupilsto give the generalization. To collect data on one variable using any source we can use: observation survey listing or gathering data from a source GENERALIZATION:
  • 23.
    Directions: Collect thevariables in the following problem by making a list. 1. Mr. Arceo recorded the number of foreign visitors to an exhibition on five days. There were 35 foreigners who watched the show on Wednesday, 40 on Thursday, 18 on Friday, 55 on Saturday and 110 on Sunday. 2. Janina had an inventory of the monthly sales of magazines from January to May. Last January, there were 650 magazines sold. Five hundred were sold on February, 700 on March, 300 on April and 900 on May. EVALUATON:
  • 24.
    3. The SkyRanch management accounted the number of people who arrived during its first week of operation. One thousand two hundred tourists came on its opening day. On its second day of operation, 900 visitors arrived. There were 650 people came on the third day, 1300 on the fourth day and 800 on the fifth day. Directions: Create problem using the data given below. a. Given: previous temperature of 30 degrees’ Celsius rises at 5 degrees Celsius Problem: __________ Solution: ____________
  • 25.
    You want knowwhich types of pets are the most popular in the class. Collect your data by counting the number of pets owned by the students in the class. (Add more categories if needed) Dog _________ Cat _________ Bird _________ Fish _________ Rabbit _________ Horse _________ ASSIGNMENT
  • 26.
    Collects data ontwo variables using any source Code: M5SP – IVg.1.
  • 27.
    Directions: Name thefollowing graphs. Drill
  • 28.
    Directions: Read theproblems then list the data presented in it. Mang Andres has a small sari-sari store. His daily earnings were: Monday, Php 1,000; Tuesday, Php 2,000; Wednesday, Php1,500, Thursday, Php3,000; Friday, Php1,800 and Saturday,Php 2,800. Review
  • 29.
    Diana” Beach Resortclerk noticed the increasing number of reservations in their rooms. On 2012, they have 500 reservations; 2013, 1,000 reservations; 2014, 1,500 reservations; REVIEW
  • 30.
    What city isknown to be the “Summer Capital of the Philippines? How do you compare its temperature to Manila? MOTIVATION
  • 31.
    Word Problem Baguio, the“Summer Capital of the Philippines,” listed the following average temperature within 6 months: January, 15°C; February, 10°C; March, 18°C; April, 19°C; May, 15°C; and June, 16°C. In Manila, it listed these average temperatures: January, 25°C; February, 24°C; March, 23°C; April, 28°C; May, 27°C; and June 25°C. Presentation:
  • 32.
    Strategy: Direct Instruction Whatare the two cities mentioned? What is being compared between the two cities? Let us make a list of the temperature in Baguio for 6 months: Temperature for 6 Months Month Baguio January February March April May June Discussion
  • 33.
    Let us putthe temperature in Manila beside temperature in Baguio. Temperature for 6 Months Month Baguio Manila January February Page857 March April May June The list that we had make is an example of how to collect data with two variables. Our variables here are the cities of Baguio and Manila. Discussion
  • 34.
    Directions: Read thesituation and make a list of the information that can be found in it. MicMacMig Corporation has two branches. One in Lian, Batangas and the other one in Nasugbu, Batangas. Their store in Lian, Batangas have the following Daily Sales: Sunday, Php120,000; Monday, Php85,000; Tuesday, Php65,000; Wednesday, Php95,000; Thursday, Php105,000; Friday, Php110,000 and Sunday, Php125,000.It Nasugbu, Batangas branch recorded the following sales: Sunday, Php 155,000; Monday, Php100,000; Tuesday, Php90,000; Wednesday, Php105,000; Thursday, Php115,000; Friday, Php145,000 and Sunday, Php135,000. DEVELOPING MASTERY
  • 35.
    Directions: List thevariables found in the problems below. 1. Ceejay and Clarence are working students. They are working part- time at Matabungkay Beach Resort as waiters last May. Ceejay received the following: Week 1, Php1,500; Week 2, P1,250; Week 3, Php1,800 and Week 4, Php2,100. Clarence received these amount: Week 1, Php1,400; Week 2, Php1,100; Week 3, Php1,800 and Week 4, Php1,900. 2. Anna and Annie are twins. Their mother, Angie kept a record of the twins’ weight. At the age of 1-year-old, Anna is 8.5 kg while Annie is 8.75 kg. At two, Anna is 12 kg and Annie is 11.9 kg. At three, Anna is 14.8 kg while Annie is 15.2 kg. APPLICATION
  • 36.
    How do wecollects data with two or more variables? To collect data with two or more variables, we: - Read and analyze the problem - Make a list of the variables in the problem GENERALIZATION:
  • 37.
    Directions: Collect thevariables in the following problem by making a list 1. The Art Museum recorded the number of visitors who came in January February, and March. In January, 120 visitors came on Sunday, 70 on Monday, 60 on Tuesday, 100 on Wednesday, 60 on Thursday, 80 on Friday, and 120 on Saturday. In February, there were 80 visitors on Sunday, 80 on Monday, 100 on Tuesday, 80 on Wednesday, 80 on Thursday, 60 on Friday and 140 on Saturday. In March, their visitors were: 100 on Sunday, 105 on Monday, 80 on Tuesday, 70 on Wednesday, 75 on Thursday, 90 on Friday and 110 on Saturday. EVALUATON:
  • 38.
    2. During theRecycling Drive of San Diego Elementary School, they collected cans and newspaper from the barangay. They collections of the cans were: 200 for Grade 1, 250 for Grade 2, 100 for Grade 3, 300 for Grade 4, 500 for Grade 5 and 350 for Grade 6. They collected the following number of newspapers: 125 for Grade 1, 100 for Grade 2, 90 for Grade 3, 125 for Grade 4, 85 for Grade 5 and 120 for Grade 6. EVALUATON:
  • 39.
    Following problem bymaking a list. 1. Balibago Elementary School and Prenza Elementary School joined the Green Movement. They planted seedlings along the highway. Balibago Elementary School planted 25 ipil-ipil; 40 acacia; 30 lauan; 20 narra and 35 mango. Prenza Elementary School planted these seedlings: 30 ipil-ipl; 35 acacia; 30 lauan; 25 narra and 30 mango. 2. St. Bernards Academy has the following enrolment for the last 4 years: 2012, 180 male and 220 female; 2013, 205 male and 192 female; 2014, 280 male and 320 female; and 2015, 305 male and 340 female. ASSIGNMENT
  • 40.
    Organizes data intabular form Code: M5SP-IVg-2.5,
  • 41.
    Directions: Arrange thesets of data from least to greatest and in vice versa. Drill
  • 42.
    Reviewing Previous Lesson Directions:Read the problem. Collect data that are necessary to answer the questions that follow. Marcela Agoncillo’s ancestral house was one of the most visited historical houses in town of Taal. Its weekly average tourist-visitor attendance reaches up to 100. Monday-110, Tuesday-120, Wednedsay-90, Thursday-105, Friday-125, Saturday-100. Review
  • 43.
    Which day ofthe week has the most number of tourists that visited the house? Which day of the week has the least number of tourists that visited the house?. REVIEW
  • 44.
    Suppose that astatistical data and a graph picturing the data are displayed on a board. Which would you notice first? Why? MOTIVATION
  • 45.
    Word Problem Miss Valdezhas just finished checking the test papers of he pupils in Math. The scores of the pupils are the following: Presentation:
  • 46.
    Can you tellwhat the lowest and highest scores are easily? Can you easily give any conclusion about the result of the test with the given data? Why? How will you arrange these data? Discussion
  • 47.
    Strategy: Tabulating Data Materials:table Mechanics: a. Form the pupils into 5 groups. b. Provide each group with a frequency table and let them count and tally the result from lowest to highest score DEVELOPING MASTERY
  • 48.
    DEVELOPING MASTERY Score Tally Frequency 15II 2 16 II 2 17 II 2 18 III 3 20 IIII 4 25 IIIII-II 7 26 I 1 30 I 1 35 III 3 36 I 1 40 II 2 TOTAL 28
  • 49.
    Directions: Study thisproblem. Organize the data in table form. 1. Nancy and her friend Mackie sold their egg harvest in 5 days. On the first day, 30 dozens of eggs were delivered to Mrs. Castro’s store. 5 dozens were carried to Triple A Store by the following day. Both 20 dozens of eggs were sent to Mrs. De Villa and Lucky Store, 15 dozens were carried to Triple M. 2. The librarian made this report of the number of pupils by grade level who used the library for a period of one month. Grade1-50, Grade 2-70, Grade 3- 65, Grade 4 – 120, Grade 5-135 and Grade 6 – 200. APPLICATION
  • 50.
    How do weorganize data? - We organize data through tabular form. This would help in the plotting of data or making graphs GENERALIZATION:
  • 51.
    Fifteen pupils wereasked of their favorite native game. Below are their responses. Directions: Organize the data and complete the frequency table Native Game Tally Frequency Answer These: 1. What is the pupils’ most favorite game? 2. What is the pupils’ least favorite game? EVALUATON:
  • 52.
    Collect data aboutthe TV programs that the grade five pupils in your school prefer to watch. Organize and present the data collected in tabular form ASSIGNMENT
  • 53.
    Presents data ina line graph Code: M5SP-IVg-2.5
  • 54.
    Drill on plottingpoints on a grid board 1) (1,2) 4) (3,6) 2) (4,5) 5) (5,7) 3) (8,12) 6) (9,3) Strategy: a) Form groups of five. Give each a grid board, a piece of chalk and cards wherein the ordered pairs are written. b) At the signal “Go”, pupils will plot the points on the grid board. c) The group who finishes first and with the most number of correct answers wins the game. Drill
  • 55.
    Study the linegraph, then answer the questions that follow Review
  • 56.
    a) In whatgames did Janno get the highest points? How many points? b) In what games did he get the same points. How many points? c) Find his total points in all the games. d) In what part of the game is Janno more capable of playing? Why? e) What is the line graph all about? REVIEW
  • 57.
    What are otherthat suitable to present on a line graph? Today we are going to learn presenting data on a line graph. Line graphs are best for data that show trends such as increases and decreases MOTIVATION
  • 58.
    Cristy would liketo make a line graph about her scores in Spelling for the month of January as show below Cristy’s Average Score in Spelling in January. Presentation: Week 1 50 Week 2 48 Week 3 46 Week 4 49 What is the title of the line graph? What information is on the vertical axis? What information is on the horizontal axis?
  • 59.
    Let us helpCristy in presenting her scores in a line graph. a) Let the pupils work in group. b) Let them plot the x and y axes on the grid. c) Discuss how to select a scale or interval in presenting the data given on the problem. Note: Point out that the choice of scale can make difference on how the graph would look like? Discussion
  • 60.
    d) Guide thepupils how the vertical and horizontal sides of the graph should be labeled. (Note: Explain that the dependent variable quantity occupies the y- axis) e) Have them mark the points where the weeks and score intersect. f) Then, have them connect with a ruler the points on the grid.
  • 61.
    g) Emphasize neatnessand orderliness in making their graphs. h) Discuss with the pupils the line graph presented by answering the comprehension questions. a. What is the title of the graph? b. In which week was the highest score of Cristy? c. In which week did Cristy get a lowest score? d. What data was presented on the x-axis? y-axis?
  • 62.
    Strategy: Cooperative Learning Mechanics: a)Class will be divided into 3 groups. b) Each group will be given an Directions: Use a line a graph to present the data below. DEVELOPING MASTERY
  • 63.
    Group I Result ofan Experiment Height of Plant Weeks 1 cm 1st 2 cm 2nd 2.5 cm 3rd 3.5 cm 4th 4 cm 5th 6 cm 6th
  • 64.
    Group II Pupils’Record of Absences in Grade V-Rose Week No. of Pupils 1 10 2 8 3 7 4 4 5 3 6 0 7 2 8 5
  • 65.
    Group III Patrick’sRecord of Deposits Month Amount of Deposit June P 150 July P 200 August P 100 September P 150 October P 300 November P 250 December P 500
  • 66.
    c) Pupils willmark their horizontal and vertical axes. d) Select a scale or interval in presenting the given data. e) Teacher guides pupils what data should be presented in each axis. (Note: The dependent quantity occupies the y-axis.) f) Let them mark the points using the tabulated data. g) Ask them to connect the plotted points. h) Each group take turns in presenting or discussing their line graph
  • 67.
    Directions: Below arethe results of Third Grading Tests of Grade V class. Present these results on the line graph. Subjects Percentage Mastery English 68% Filipino 94% Araling Panlipunan 86% Mathematics 80% Science 76% EPP 87% MAPEH 85% ESP 96% APPLICATION
  • 68.
    In what subjectdo pupils need improvement? Why? APPLICATION
  • 69.
    What steps haveyou learned in presenting data on the line graph? GENERALIZATION:
  • 70.
    Directions: Study thesedata. Organize them in table form. Decide what interval to use, then present it on a line graph. The following data are the number of eggs sold by Nancy in one Week: May 5 – 60 dozens; May 6- 50 dozens; May 7- 25 dozens; May 8- 65 dozens; May 9- 70 dozens EVALUATON:
  • 71.
    Directions: Do thefollowing activities. 1. Measure your room temperature by the hour for 5 hours then present this data on a line graph. 2. Chart your own scores in your 5 Math quizzes. Present this data on a line graph. ASSIGNMENT