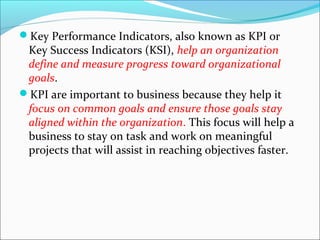
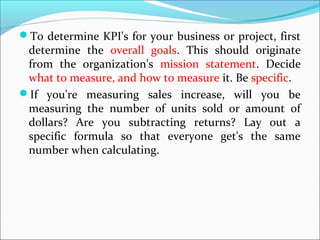
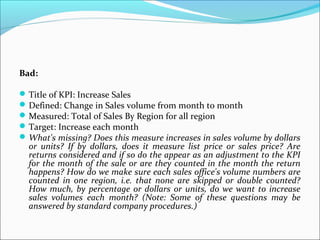
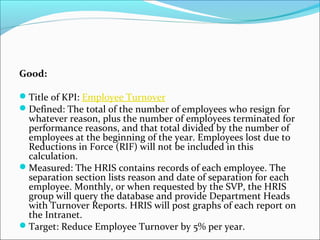
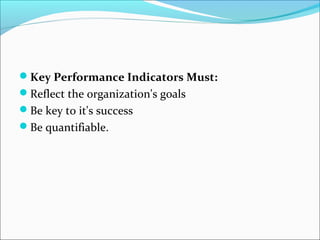
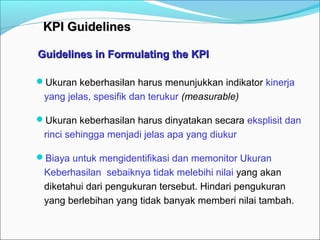
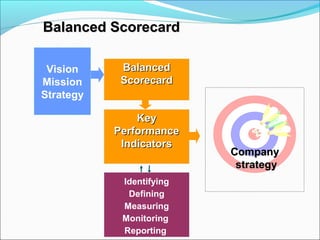
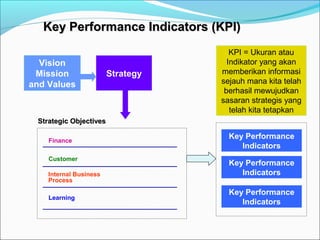
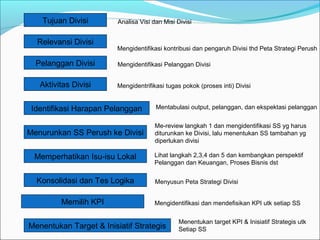
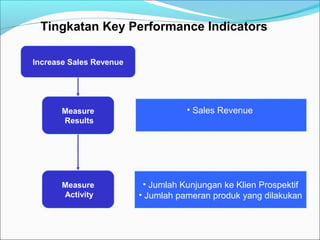
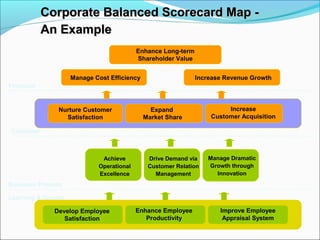
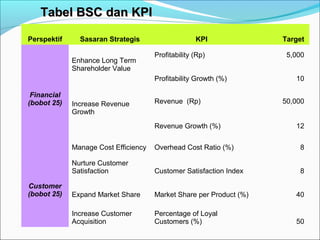
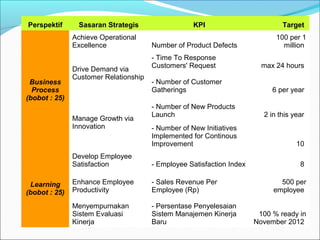
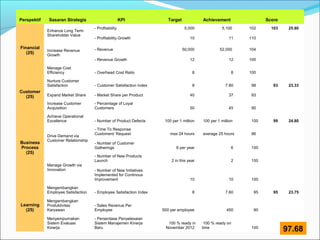
To get the best results from implementing RESULTS.com, we recommend that you start by getting clear on the key numbers that will drive your success.
Research shows that (unfortunately) 92% of companies do a poor job of measuring Key Performance Indicators (KPI's). If that sounds like you, we can definitely help!
What are the key numbers that will drive and predict the success of your current business model? Your teams? Your key people?
Choosing the right KPI's (and making them visible) tells your people what they need to pay attention to. In other words, KPI's drive the right behaviors.
This workshop will help you choose the key numbers that will help you identify problems early, and solve them fast. If you get these numbers right, they will drive better financial results!
Establishing a Business Process Management Center of Excellence - Impact 2012Prolifics
Speakers: Benny Higdon, Prolifics; Howard Webb, Prolifics
Description: Introducing a new technology in to an enterprise may be fraught with problems. The same is true for Business Process Management (BPM), which are both a technology and a methodology. Establishing a properly staffed and empowered Center of Excellence (CoE) can improve your chances of success. Learn the considerations for setting up a BPM CoE in your organization.
Here's a link to the full resolution PDF http://static.klipfolio.com/ebook/intro-to-kpis-slides.pdf
In today’s ultra competitive business ecosystem, only the strong survive. In order to keep your team on top of their game, you need to cultivate a data-driven culture by sharing the right performance indicators and business metrics with your team.
A Key Performance Indicator is a measurable value that demonstrates how effectively a company is achieving key business objectives. Organizations use KPIs at multiple levels to evaluate their success at reaching targets. High-level KPIs may focus on the overall performance of the enterprise, while low-level KPIs may focus on processes in departments such as sales, marketing or a call center.
How to build a Key Performance Indicator (KPI) - Consider Elevator ManagementAxel Marrocco
What exactly is a KPI. This lesson was developed to help consider how to evaluate the effectiveness of a problem / solution proposal. Elevator Management is used, since it provides a topic almost all can relate with. The focus is not to development an understanding of Critical Success Factors, but to concentrate on elements necessary in constructing a Key Performance Indicator (KPI) of a proposal's effectiveness.
This presentation highlights the required steps for HR Departments to transition themselves into a formidable HR Analytics Team. It will show how to apply HR Analytics to a departmental case as well as the required skill sets for your HR Team to acquire in order to become savvy analytics professionals. #hranalytics #humanresources
Strategy to Execution: Tips to Execute Your Strategy With Excellence.Avi Mizrahi, MBA, BBA.
Strategy is sexy. Execution is really difficult. Perhaps that's why so many strategic initiatives fail. I believe that transitioning from strategy to execution is the biggest challenge facing today's organizations. Execution is a leader's job and this presentation will lay out a practical approach to ensure your strategy is executed with excellence.
Developing Metrics and KPI (Key Performance IndicatorsVictor Holman
Get a FREE performance management kit and access to all of Victor's full videos at:
www.lifecycle-performance-pros.com
This presentation covers the basics of developing successful performance metrics, from developing winning KPIs, learning how to develop the right metrics, the rules of developing KPIs and metrics and common performance metrics for managing a successful organization.
Lean is more effective when using Simulation, an ED Case Study from SIMUL8SIMUL8 Corporation
Lean Six Sigma (LSS) programs are more effective when they integrate the use of process simulation into their toolkit.
By doing so, improvement practitioners improve both their technical solutions and adoption of new/redesigned processes.
This Case Study looks at 'Implementing Rapid Clinical Examination (RCE) flow in the Emergency Room of Memorial Medical Centre.
The owner company is developing the Phase II of the Jubail Industrial City in Saudi Arabia. Part of the Jubail Phase II development is to provide 405 villas for the community. Due to the speed and efficiency in production and installation, it was decided to construct the villas using precast wall and floor panels.
Operation Excellence model require a strong leadership level, agile culture, deeply understanding about organization's WHY, business process re-engineering...
How to Introduce Operational Excellence in your Organisation?Tina Arora
This presentation will help you present to the management the need and benefits of introducing Operational Excellence as a department in your Organisation.
It can be modified to suit the advocacy in any industry - be it Financial services, BPO, LPO, KPO, Domestic call centres, Manufacturing, Consumer Goods, Retail, etc.
The An Introduction to Operational Excellence v9.0 presentation is free-of-charge and includes:
1. MS PowerPoint Presentation including 41 slides covering an Introduction to the 4 Building Blocks of Operational Excellence - Strategy Deployment & Hoshin Planning, Performance Management & Balanced Scorecards, Process Excellence & Lean Six Sigma, and High Performance Work Teams.
Balanced Scorecard is a management tool that provides stakeholders with a comprehensive measure of how the organization is progressing towards the achievement of its strategic goals.
Balances financial and non-financial measures
Balances short and long-term measures
Balances performance drivers (leading indicators) with outcome measures (lagging indicators)
Leads to strategic focus and organizational alignment.
Strategy Mapping PowerPoint Presentation Slides is a custom virtual solution for management teams from all domains. This graphically-rich balanced scorecard methodology PowerPoint template deck assists you in strategy mapping. Represent strategic management goals with the help of the cutting-edge design of this PPT theme. Insightful data visuals make bland info interesting. This presentation piques the attention of the viewer allowing him to develop a deeper understanding of the subject. Employ flowcharts, dashboards, and other diagrams to add a visual layer in your balanced strategy planning PowerPoint presentation. Elucidate the essentials of effective BSC strategic planning. Convey the need, perspectives, and implementation of the BSC management technique. Further, this PowerPoint deck features easy-to-understand balanced scorecard strategy map representation. Consolidate scorecards department-wise. Use our professionally crafted PPT templates to highlight the BSC execution framework. Smash the download button on this business performance management PowerPoint theme to build a methodical and informative presentation within moments. Our Strategy Mapping PowerPoint Presentation Slides are explicit and effective. They combine clarity and concise expression. https://bit.ly/3992qXK
BSC Strategy Map PowerPoint Presentation Slides is a tailor-made tool for management teams across all industry verticals. Our highly visual balanced scorecard methodology PPT theme helps you to elucidate value creation by your organization. This comprehensive PowerPoint slideshow assists you in concisely documenting strategic management goals. Impressive data visualization tools allow users to gracefully present data. Utilize Infographics, flowcharts, dashboards, and other diagrams to incorporate visual depth in your BSC strategic planning PPT presentation. Our balanced strategy planning PowerPoint templates provide you with enough virtual and interactive tools to effectively engage your audience. Elaborate on the need, perspectives, and implementation of the BSC management technique through this well-structured PPT slideshow. Easy-to-understand balance scorecard strategy map representation is included in this PowerPoint deck. Present department level scorecards, and BSC execution framework with the help of our professionally crafted PPT templates. Download this business performance management PowerPoint theme and build a methodical and informative presentation within moments. https://bit.ly/30qw1Y5
It covers all the important concepts and has relevant templates which cater to your business needs. This complete deck has PPT slides on BSC Execution Framework Powerpoint Presentation Slides with well suited graphics and subject driven content. This deck consists of total of twenty slides. All templates are completely editable for your convenience. You can change the colour, text and font size of these slides. You can add or delete the content as per your requirement. Get access to this professionally designed complete deck presentation by clicking the download button below. https://bit.ly/33gyDJQ
Valuation Process Exploring Industry KPIS and Their ImpactMY Valuation
KPIs measure business performance and progress towards their goals through tracking the effectiveness of projects, processes, campaigns, and strategic changes.
Semi Standard Structured Report PowerPoint Presentation SlidesSlideTeam
It has PPT slides covering wide range of topics showcasing all the core areas of your business needs. This complete deck focuses on Semi Standard Structured Report PowerPoint Presentation Slides and consists of professionally designed templates with suitable graphics and appropriate content. This deck has total of twenty slides. Our designers have created customizable templates for your convenience. You can make the required changes in the templates like colour, text and font size. Other than this, content can be added or deleted from the slide as per the requirement. Get access to this professionally designed complete deck PPT presentation by clicking the download button below. https://bit.ly/3gfJIi5
Build a strategic management tool for your business in the form of this exclusive balance scorecard PowerPoint presentation slides. Use this balance scorecard PPT design to describe different prospective of your organization which are described as financial perspective, customer or investors perspective, organizational growth perspective and the internal process perspective. This Balanced Scorecard PPT layout explains the essential uses of the maintaining the balance scorecard for strategically developments of your organization as it also helps in analyzing various functions of your business and explains other factors which may affect the growth rate of your organization. This Balanced Scorecard presentation template will work as an effective management strategic tool to manage as well as monitor the strategic targets for the company. Thus you are just a click away from owning this professional designed PowerPoint image for your business to explain your subject matter in a very ingenious way. Gaze into the crystal ball with our Balanced Scorecard PowerPoint Presentation Slides. They give you the gift of foresight.
Build a strategic management tool for your business in the form of this exclusive balance scorecard PowerPoint presentation slides. Use this balance scorecard PPT design to describe different prospective of your organization which are described as financial perspective, customer or investors perspective, organizational growth perspective and the internal process perspective. This Balanced Scorecard PPT layout explains the essential uses of the maintaining the balance scorecard for strategically developments of your organization as it also helps in analyzing various functions of your business and explains other factors which may affect the growth rate of your organization. This Balanced Scorecard presentation template will work as an effective management strategic tool to manage as well as monitor the strategic targets for the company. Thus you are just a click away from owning this professional designed PowerPoint image for your business to explain your subject matter in a very ingenious way. Gaze into the crystal ball with our Balanced Scorecard Powerpoint Presentation Slides. They give you the gift of foresight. https://bit.ly/3wDkSjS
2. Key Performance Indicators, also known as KPI or
Key Success Indicators (KSI), help an organization
define and measure progress toward organizational
goals.
KPI are important to business because they help it
focus on common goals and ensure those goals stay
aligned within the organization. This focus will help a
business to stay on task and work on meaningful
projects that will assist in reaching objectives faster.
3. To determine KPI's for your business or project, first
determine the overall goals. This should originate
from the organization's mission statement. Decide
what to measure, and how to measure it. Be specific.
If you're measuring sales increase, will you be
measuring the number of units sold or amount of
dollars? Are you subtracting returns? Lay out a
specific formula so that everyone get's the same
number when calculating.
4. Bad:
Title of KPI: Increase Sales
Defined: Change in Sales volume from month to month
Measured: Total of Sales By Region for all region
Target: Increase each month
What's missing? Does this measure increases in sales volume by dollars
or units? If by dollars, does it measure list price or sales price? Are
returns considered and if so do the appear as an adjustment to the KPI
for the month of the sale or are they counted in the month the return
happens? How do we make sure each sales office's volume numbers are
counted in one region, i.e. that none are skipped or double counted?
How much, by percentage or dollars or units, do we want to increase
sales volumes each month? (Note: Some of these questions may be
answered by standard company procedures.)
5. Good:
Title of KPI: Employee Turnover
Defined: The total of the number of employees who resign for
whatever reason, plus the number of employees terminated for
performance reasons, and that total divided by the number of
employees at the beginning of the year. Employees lost due to
Reductions in Force (RIF) will not be included in this
calculation.
Measured: The HRIS contains records of each employee. The
separation section lists reason and date of separation for each
employee. Monthly, or when requested by the SVP, the HRIS
group will query the database and provide Department Heads
with Turnover Reports. HRIS will post graphs of each report on
the Intranet.
Target: Reduce Employee Turnover by 5% per year.
6. Key Performance Indicators Must:
Reflect the organization's goals
Be key to it's success
Be quantifiable.
7. KKPPII GGuuiiddeelliinneess
Guidelines in FFoorrmmuullaattiinngg tthhee KKPPII
Ukuran keberhasilan harus menunjukkan indikator kinerja
yang jelas, spesifik dan terukur (measurable)
Ukuran keberhasilan harus dinyatakan secara eksplisit dan
rinci sehingga menjadi jelas apa yang diukur
Biaya untuk mengidentifikasi dan memonitor Ukuran
Keberhasilan sebaiknya tidak melebihi nilai yang akan
diketahui dari pengukuran tersebut. Hindari pengukuran
yang berlebihan yang tidak banyak memberi nilai tambah.
9. KKeeyy PPeerrffoorrmmaannccee IInnddiiccaattoorrss ((KKPPII))
Vision
Mission
and Values
Strategy
Finance
Customer
Internal Business
Process
Learning
Key Performance
Indicators
Key Performance
Indicators
Key Performance
Indicators
SSttrraatteeggiicc OObbjjeeccttiivveess
KPI = Ukuran atau
Indikator yang akan
memberikan informasi
sejauh mana kita telah
berhasil mewujudkan
sasaran strategis yang
telah kita tetapkan
11. Tujuan Divisi
Relevansi Divisi
Pelanggan Divisi
Aktivitas Divisi
Analisa Visi dan Misi Divisi
Mengidentifikasi kontribusi dan pengaruh Divisi thd Peta Strategi Perush
Mengidentifikasi Pelanggan Divisi
Mengidentrifikasi tugas pokok (proses inti) Divisi
Identifikasi Harapan Pelanggan
Menurunkan SS Perush ke Divisi
Memperhatikan Isu-isu Lokal
Konsolidasi dan Tes Logika
Memilih KPI
Mentabulasi output, pelanggan, dan ekspektasi pelanggan
Me-review langkah 1 dan mengidentifikasi SS yg harus
diturunkan ke Divisi, lalu menentukan SS tambahan yg
diperlukan divisi
Lihat langkah 2,3,4 dan 5 dan kembangkan perspektif
Pelanggan dan Keuangan, Proses Bisnis dst
Menyusun Peta Strategi Divisi
Mengidentifikasi dan mendefisikan KPI utk setiap SS
Menentukan Target & Inisiatif Strategis
Menentukan target KPI & Inisiatif Strategis utk
Setiap SS
12. Tingkatan Key Performance Indicators
Increase Sales Revenue
Measure
Results
• Sales Revenue
Measure
Activity
• Jumlah Kunjungan ke Klien Prospektif
• Jumlah pameran produk yang dilakukan
13. Corporate BBaallaanncceedd SSccoorreeccaarrdd MMaapp --
AAnn EExxaammppllee
Enhance Long-term
Shareholder Value
Manage Cost Efficiency
Increase Revenue Growth
Increase
Customer Acquisition
Nurture Customer
Satisfaction
Achieve
Operational
Excellence
Develop Employee
Satisfaction
Drive Demand via
Customer Relation
Management
Manage Dramatic
Growth through
Innovation
Financial
Customer
Business Process
Learning & Growth
Expand
Market Share
Enhance Employee
Productivity
Improve Employee
Appraisal System
15. Perspektif Sasaran Strategis KPI Target
Business
Process
(bobot : 25)
Achieve Operational
Excellence Number of Product Defects
100 per 1
million
Drive Demand via
Customer Relationship
- Time To Response
Customers' Request max 24 hours
- Number of Customer
Gatherings 6 per year
Manage Growth via
Innovation
- Number of New Products
Launch 2 in this year
- Number of New Initiatives
Implemented for Continous
Improvement 10
Learning
(bobot : 25)
Develop Employee
Satisfaction - Employee Satisfaction Index 8
Enhance Employee
- Sales Revenue Per
Productivity
Employee (Rp)
500 per
employee
Menyempurnakan
Sistem Evaluasi
Kinerja
- Persentase Penyelesaian
Sistem Manajemen Kinerja
Baru
100 % ready in
November 2012
16. Perspektif Sasaran Strategis KPI Target Achievement Score
Financial
(25)
Enhance Long Term
Shareholder Value
- Profitability 5,000 5,100 102 103 25.80
- Profitability Growth 10 11 110
Increase Revenue
Growth
- Revenue 50,000 52,000 104
- Revenue Growth 12 12 100
Manage Cost
Efficiency - Overhead Cost Ratio 8 8 100
Customer
(25)
Nurture Customer
Satisfaction - Customer Satisfaction Index 8 7.80 98 93 23.33
Expand Market Share - Market Share per Product 40 37 93
Increase Customer
- Percentage of Loyal
Acquisition
Customers 50 45 90
Business
Process
(25)
Achieve Operational
Excellence - Number of Product Defects 100 per 1 million 100 per 1 million 100 99 24.80
Drive Demand via
Customer Relationship
- Time To Response
Customers' Request max 24 hours average 25 hours 96
- Number of Customer
Gatherings 6 per year 6 100
Manage Growth via
Innovation
- Number of New Products
Launch 2 in this year 2 100
- Number of New Initiatives
Implemented for Continous
Improvement 10 10 100
Learning
(25)
Mengembangkan
Employee Satisfaction - Employee Satisfaction Index 8 7.60 95 95 23.75
Mengembangkan
Produktivitas
- Sales Revenue Per
Karyawan
Employee 500 per employee 450 90
Menyempurnakan
Sistem Evaluasi
Kinerja
- Persentase Penyelesaian
Sistem Manajemen Kinerja
Baru
100 % ready in
November 2012
100 % ready on
time 100 9 7.68