Market Watch November 2013
•
0 likes•422 views

- Home sales in the Greater Toronto Area increased 13.9% in November 2013 compared to November 2012, with 6,391 residential sales. The average selling price increased 11.3% to $538,881. - Single-detached homes and condominium apartments accounted for almost three-quarters of total sales. Price growth was strongest for detached homes at 12.3% and weakest for condo apartments at 7.4%. - Competition between buyers increased last month as transactions were up strongly year-over-year while new listings were down 4.4% and active listings fell 12.1% from a year ago.

Recommended
More Related Content
What's hot
What's hot (20)
Viewers also liked
Similar to Market Watch November 2013
Similar to Market Watch November 2013 (20)
More from Chaba Tamasi
More from Chaba Tamasi (18)
Recently uploaded
Recently uploaded (20)
Market Watch November 2013
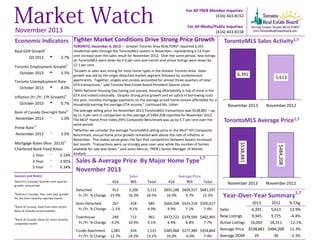
- 1. For All TREB Member Inquiries: (416) 443-8152 For All Media/Public Inquiries: (416) 443-8158 November 2013 Economic Indicators Tighter Market Conditions Drive Strong Price Growth Real GDP Growthi Q3 2013 t 2.7% TORONTO, December 4, 2013 – Greater Toronto Area REALTORS® reported 6,391 residential sales through the TorontoMLS system in November, representing a 13.9 per cent increase over the sales result for November 2012. Over the same period, new listings on TorontoMLS were down by 4.4 per cent and month-end active listings were down by 12.1 per cent. Toronto Employment Growthi i “Growth in sales was strong for most home types in the Greater Toronto Area. Sales October 2013 t 3.5% Toronto Unemployment Rate October 2013 t 8.0% ii Inflation (Yr./Yr. CPI Growth) October 2013 u 0.7% iii Bank of Canada Overnight Rate November 2013 growth was led by the single-detached market segment followed by condominium apartments. Together, singles and condos accounted for almost three-quarters of total GTA transactions,” said Toronto Real Estate Board President Dianne Usher. “With National Housing Day having just passed, housing affordability is top of mind in the GTA and indeed nationally. Despite strong price growth and an uptick in borrowing costs this year, monthly mortgage payments on the average priced home remain affordable for a household earning the average GTA income,” continued Ms. Usher. The average selling price for November 2013 TorontoMLS transactions was $538,881 – up by 11.3 per cent in comparison to the average of $484,208 reported for November 2012. The MLS® Home Price Index (HPI) Composite Benchmark was up by 5.7 per cent over the same period. q 1.0% q 6,391 November 2013 5,613 November 2012 3.0% Benchmark, annual home price growth remained well-above the rate of inflation in iv Prime Rate November 2013 TorontoMLS Sales Activity1,7 TorontoMLS Average Price1,7 “Whether we consider the average TorontoMLS selling price or the MLS® HPI Composite November. This makes sense given the fact that competition between buyers increased $484,208 $538,881 iv Mortgage Rates (Nov. 2013) last month. Transactions were up strongly year-over-year while the number of homes available for sale was down,” said Jason Mercer, TREB’s Senior Manager of Market Chartered Bank Fixed Rates 1 Year q 3.14% Analysis. 1,7 3 Year q 3.95% Sales & Average Price By Major Home Type 5 Year q 5.34% November 2013 Sources and Notes: 416 i Statistics Canada, Quarter-over-quarter growth, annualized Sales 905 Total Average Price 416 905 Total ii Detached Yr./Yr. % Change 913 23.9% 2,200 16.3% 3,113 18.5% $855,188 $609,557 $681,597 16.0% 9.7% 12.3% iii Semi-Detached Yr./Yr. % Change 267 -1.1% 418 9.1% 685 4.9% $640,208 $419,318 $505,417 9.9% 7.1% 7.4% Townhouse Yr./Yr. % Change 249 4.2% 712 10.9% 961 9.1% $472,722 $378,569 $402,965 6.4% 8.8% 7.7% Condo Apartment Yr./Yr. % Change 1,081 12.7% 434 14.2% 1,515 13.1% $385,968 $277,389 $354,864 10.0% -0.4% 7.4% Statistics Canada, Year-over-year growth for the most recently reported month Bank of Canada, Rate from most recent Bank of Canada announcement iv Bank of Canada, Rates for most recently completed month November 2013 November 2012 1,7 Year-Over-Year Summary 2013 2012 Sales 6,391 5,613 New Listings 9,345 9,775 Active Listings 16,092 18,311 Average Price $538,881 $484,208 Average DOM 29 30 % Chg. 13.9% -4.4% -12.1% 11.3% -3.3%
- 2. Toronto Real Estate Board SALES BY PRICE RANGE AND HOUSE TYPE1,7 NOVEMBER 2013 Price Range Detached Semi-Detached Att/Row/Twnhouse Condo Townhouse Condo Apt Link Co-op Apt Det Condo Co-ownership Apt Total $0 to $99,999 $100,000 to $199,999 $200,000 to $299,999 $300,000 to $399,999 $400,000 to $499,999 $500,000 to $599,999 $600,000 to $699,999 $700,000 to $799,999 $800,000 to $899,999 $900,000 to $999,999 $1,000,000 to $1,249,999 $1,250,000 to $1,499,999 $1,500,000 to $1,749,999 $1,750,000 to $1,999,999 $2,000,000 + 0 38 155 377 560 549 451 255 188 134 153 114 56 27 56 0 10 39 146 220 135 56 30 14 14 12 4 4 1 0 0 2 44 140 138 77 30 13 6 3 3 0 1 0 0 0 36 144 194 76 19 14 9 5 4 1 0 1 1 0 11 177 500 451 187 94 36 22 7 5 10 7 2 0 6 0 0 16 22 17 21 16 3 0 0 0 0 0 0 0 2 2 0 0 0 1 1 0 1 0 0 0 0 0 0 0 0 2 2 1 4 0 0 0 0 0 0 0 0 0 0 4 2 0 0 0 0 0 0 0 0 0 0 0 0 13 269 902 1,332 1,199 900 604 332 221 160 179 125 64 29 62 6,391 Total Sales 3,113 685 457 504 1,515 95 7 9 6 Share of Total Sales 48.7% 10.7% 7.2% 7.9% 23.7% 1.5% 0.1% 0.1% 0.1% - $681,597 $505,417 $450,743 $359,642 $354,864 $460,307 $342,857 $425,544 $190,500 $538,881 Average Price SALES BY PRICE RANGE AND HOUSE TYPE1,7 YEAR-TO-DATE, 2013 Price Range Detached Semi-Detached Att/Row/Twnhouse Condo Townhouse Condo Apt Link Co-op Apt Det Condo Co-ownership Apt Total $0 to $99,999 $100,000 to $199,999 $200,000 to $299,999 $300,000 to $399,999 $400,000 to $499,999 $500,000 to $599,999 $600,000 to $699,999 $700,000 to $799,999 $800,000 to $899,999 $900,000 to $999,999 $1,000,000 to $1,249,999 $1,250,000 to $1,499,999 $1,500,000 to $1,749,999 $1,750,000 to $1,999,999 $2,000,000 + 24 421 2,281 5,402 7,616 7,279 5,426 3,574 2,536 1,529 1,754 1,111 622 336 712 0 95 547 2,287 3,107 1,532 624 332 198 108 100 35 29 14 14 6 14 782 2,173 2,002 934 426 154 63 36 35 9 4 2 2 19 485 1,920 2,424 974 261 149 83 48 30 18 3 5 1 2 151 2,305 6,194 5,641 2,387 992 437 216 99 78 82 55 22 12 45 0 3 238 306 307 360 139 17 0 0 0 0 0 0 0 17 36 13 15 10 8 5 4 2 1 1 1 0 0 0 0 1 16 25 19 15 1 2 1 0 0 0 0 0 0 3 14 41 16 2 0 0 0 0 0 0 0 0 0 0 220 3,374 12,032 18,289 16,424 11,381 7,207 4,382 2,947 1,782 1,990 1,214 682 365 775 Total Sales 40,623 9,022 6,642 6,422 18,716 1,370 113 80 76 83,064 Share of Total Sales Average Price 48.9% 10.9% 8.0% 7.7% 22.5% 1.6% 0.1% 0.1% 0.1% - $659,871 $484,634 $438,401 $348,678 $343,921 $443,055 $311,482 $413,238 $249,359 $523,216 Market Watch, November 2013 2
- 3. Toronto Real Estate Board ALL HOME TYPES, NOVEMBER 2013 ALL TREB AREAS SUMMARY OF EXISTING HOME TRANSACTIONS 1 1 1 2 3 4 Avg. SP/LP 16,092 2.6 98% 61.2% 62.3% 59.2% 64.8% 58.8% 1,247 267 197 246 537 2.4 2.7 2.8 1.7 2.7 98% 97% 98% 98% 97% 31 33 41 24 33 2,082 895 91 1,096 52.0% 51.2% 48.3% 53.0% 3,547 1,419 275 1,853 2.7 2.6 4.1 2.6 97% 97% 97% 97% 31 32 43 28 $470,000 3,849 53.6% 6,380 2.7 99% 28 $648,193 $679,181 $492,835 $342,164 $1,162,767 $628,158 $492,873 $752,373 $691,117 $570,280 $572,500 $556,000 $451,000 $290,000 $975,000 $576,500 $476,500 $645,000 $620,000 $485,000 1,604 73 24 80 40 455 105 350 404 73 54.4% 58.6% 59.3% 66.5% 36.8% 56.1% 70.4% 50.1% 51.2% 51.6% 2,940 171 80 158 160 699 144 623 716 189 2.6 2.7 3.5 2.5 7.6 2.3 1.6 2.8 2.8 3.5 97% 97% 96% 97% 92% 98% 98% 97% 97% 97% 31 31 49 37 70 28 23 31 31 38 $265,234,666 $47,876,650 $4,253,700 $36,488,700 $59,406,128 $41,244,288 $8,386,400 $10,934,500 $56,644,300 $368,381 $419,971 $236,317 $325,792 $297,031 $438,769 $441,389 $475,413 $404,602 $347,750 $406,250 $219,000 $305,000 $276,000 $388,500 $369,900 $430,000 $378,500 900 141 17 149 241 114 40 34 164 65.4% 67.0% 47.8% 66.5% 69.3% 61.5% 54.2% 54.0% 67.4% 1,277 146 90 192 254 176 103 123 193 1.8 1.4 6.7 1.8 1.4 1.9 4.0 4.5 1.4 98% 98% 96% 98% 98% 97% 96% 97% 98% 26 22 67 28 26 26 39 35 20 44 44 $14,507,660 $14,507,660 $329,720 $329,720 $318,500 $318,500 61 61 64.5% 64.5% 118 118 2.7 2.7 97% 97% 38 38 150 12 36 19 35 48 $54,426,295 $5,629,000 $15,159,205 $6,562,000 $10,758,300 $16,317,790 $362,842 $469,083 $421,089 $345,368 $307,380 $339,954 $334,450 $477,500 $402,000 $290,000 $275,000 $324,450 238 14 69 29 72 54 60.2% 50.0% 59.3% 65.7% 55.7% 66.9% 583 74 133 74 160 142 3.5 5.8 2.8 3.4 4.2 3.2 97% 97% 98% 97% 96% 97% 5 29 44 60 27 50 46 49 Dollar Volume New Listings SNLR (Trend) 6,391 $3,443,991,233 $538,881 $453,000 9,345 55.3% Halton Region Burlington Halton Hills Milton Oakville 470 103 55 136 176 $267,413,198 $49,038,650 $29,409,605 $63,766,140 $125,198,803 $568,964 $476,103 $534,720 $468,869 $711,357 $500,000 $420,000 $479,000 $456,000 $612,500 611 123 80 157 251 Peel Region Brampton Caledon Mississauga 1,325 563 57 705 $601,950,365 $234,112,641 $32,128,980 $335,708,744 $454,302 $415,831 $563,666 $476,183 $411,000 $388,000 $535,000 $429,500 City of Toronto 2,528 $1,492,444,187 $590,366 1,154 66 12 59 15 314 106 234 295 53 $748,014,862 $44,825,950 $5,914,025 $20,187,688 $17,441,500 $197,241,645 $52,244,581 $176,055,273 $203,879,368 $30,224,832 Durham Region Ajax Brock Clarington Oshawa Pickering Scugog Uxbridge Whitby 720 114 18 112 200 94 19 23 140 Dufferin County Orangeville Simcoe County Adjala-Tosorontio Bradford West Gwillimbury Essa Innisfil New Tecumseth TREB Total 8 Mos. Inv. (Trend)9 Number of Sales Average Price Median Price Active Listings Avg. DOM ! TURN PAGE FOR CITY OF TORONTO TABLES OR CLICK HERE: York Region Aurora E. Gwillimbury Georgina King Markham Newmarket Richmond Hill Vaughan Whitchurch-Stouffville Market Watch, November 2013 3
- 4. Toronto Real Estate Board ALL HOME TYPES, NOVEMBER 2013 CITY OF TORONTO MUNICIPAL BREAKDOWN SUMMARY OF EXISTING HOME TRANSACTIONS 1 Number of Sales Dollar Volume TREB Total 6,391 $3,443,991,233 $538,881 City of Toronto Total 2,528 $1,492,444,187 Toronto West Toronto W01 Toronto W02 Toronto W03 Toronto W04 Toronto W05 Toronto W06 Toronto W07 Toronto W08 Toronto W09 Toronto W10 657 39 64 52 75 80 83 27 120 43 74 Toronto Central Toronto C01 Toronto C02 Toronto C03 Toronto C04 Toronto C06 Toronto C07 Toronto C08 Toronto C09 Toronto C10 Toronto C11 Toronto C12 Toronto C13 Toronto C14 Toronto C15 Toronto East Toronto E01 Toronto E02 Toronto E03 Toronto E04 Toronto E05 Toronto E06 Toronto E07 Toronto E08 Toronto E09 Toronto E10 Toronto E11 Average Price 1 1 2 8 3 4 Mos. Inv. (Trend)9 Avg. SP/LP 16,092 2.6 98% 53.6% 6,380 2.7 99% 28 954 80 92 64 83 125 152 27 174 43 114 55.7% 52.1% 68.8% 66.9% 61.7% 54.7% 43.3% 66.4% 55.3% 60.9% 53.2% 1,612 131 85 81 102 254 325 29 331 82 192 2.6 2.6 1.3 1.6 2.3 3.1 4.2 1.5 2.6 2.3 2.9 99% 101% 102% 101% 99% 98% 99% 101% 99% 98% 97% 30 28 25 20 27 39 35 18 30 35 32 $490,000 $409,000 $833,500 $699,000 $1,150,000 $387,000 $575,000 $399,450 $715,000 $520,000 $409,000 $1,442,500 $449,500 $421,000 $510,000 1,924 591 106 50 140 52 164 190 31 76 48 46 55 231 144 48.2% 43.2% 44.3% 56.9% 50.6% 44.7% 46.3% 52.5% 53.9% 58.2% 65.8% 40.4% 63.0% 44.5% 51.8% 3,563 1,133 218 104 230 86 289 328 65 88 59 137 96 457 273 3.2 3.9 4.2 2.5 2.7 3.6 3.4 2.8 3.0 2.0 1.8 5.0 1.9 3.6 2.7 98% 99% 96% 99% 100% 97% 99% 98% 99% 98% 99% 96% 100% 97% 98% 30 29 41 21 24 29 30 28 25 24 25 32 29 36 32 $468,325 $657,000 $640,000 $550,000 $439,750 $371,000 $510,000 $405,750 $439,000 $347,950 $474,000 $395,000 971 89 88 91 104 86 60 109 60 137 76 71 62.0% 58.9% 62.3% 63.8% 63.8% 70.3% 56.1% 61.0% 58.3% 60.4% 57.2% 65.7% 1,205 95 98 100 128 92 59 138 98 197 103 97 1.8 1.6 1.4 1.4 1.9 1.6 1.7 2.1 2.4 2.1 2.3 1.9 100% 105% 99% 101% 100% 102% 99% 98% 99% 99% 99% 99% 5 29 22 13 19 15 27 22 26 23 26 29 23 24 Median Price New Listings SNLR (Trend) $453,000 9,345 55.3% $590,366 $470,000 3,849 $326,705,475 $23,526,650 $45,404,560 $22,203,700 $32,365,350 $28,536,925 $38,760,223 $20,081,788 $71,644,677 $18,222,502 $25,959,100 $497,269 $603,247 $709,446 $426,994 $431,538 $356,712 $466,991 $743,770 $597,039 $423,779 $350,799 $450,000 $524,900 $633,000 $447,950 $390,000 $386,500 $457,000 $645,000 $495,000 $464,000 $403,000 1,153 279 66 47 87 33 111 114 27 41 35 24 59 141 89 $805,476,505 $138,115,230 $77,623,921 $40,960,005 $100,233,051 $18,342,626 $72,933,132 $53,216,230 $28,249,788 $25,756,800 $23,680,715 $49,758,028 $34,100,850 $88,889,139 $53,616,990 $698,592 $495,037 $1,176,120 $871,489 $1,152,104 $555,837 $657,055 $466,809 $1,046,288 $628,215 $676,592 $2,073,251 $577,981 $630,419 $602,438 718 65 67 73 100 74 39 72 40 82 51 55 $360,262,207 $42,557,649 $56,506,817 $41,376,352 $39,162,390 $34,197,638 $20,668,534 $32,377,703 $18,003,550 $29,121,560 $24,520,014 $21,770,000 $501,758 $654,733 $843,385 $566,799 $391,624 $462,130 $529,962 $449,690 $450,089 $355,141 $480,785 $395,818 Page 3 Active Listings Avg. DOM July 2010 Market Watch, November 2013 4
- 5. Toronto Real Estate Board ALL HOME TYPES, YEAR-TO-DATE 2013 ALL TREB AREAS SUMMARY OF EXISTING HOME TRANSACTIONS 1 Number of Sales Dollar Volume Average Price TREB Total 83,064 $43,460,391,501 $523,216 Halton Region Burlington Halton Hills Milton Oakville 6,467 1,109 882 1,994 2,482 $3,751,859,220 $565,718,621 $421,800,002 $937,405,099 $1,826,935,498 Peel Region Brampton Caledon Mississauga 17,667 7,564 805 9,298 City of Toronto 31,027 1 Median Price 1 2 4 New Listings Avg. SP/LP Avg. DOM $440,000 152,373 98% 27 $580,155 $510,116 $478,231 $470,113 $736,074 $492,000 $450,000 $440,000 $441,050 $625,000 10,707 1,810 1,482 3,120 4,295 98% 98% 98% 98% 97% 28 30 32 22 31 $8,109,458,195 $3,179,817,632 $465,411,171 $4,464,229,392 $459,017 $420,388 $578,151 $480,128 $418,000 $397,000 $522,000 $430,076 34,359 14,946 1,692 17,721 98% 98% 97% 98% 27 27 35 26 $17,560,015,346 $565,959 $449,000 58,919 99% 5 26 ! TURN PAGE FOR CITY OF TORONTO TABLES OR CLICK HERE: York Region Aurora E. Gwillimbury Georgina King Markham Newmarket Richmond Hill Vaughan Whitchurch-Stouffville 15,362 854 307 789 255 4,358 1,336 3,060 3,666 737 $9,547,693,243 $506,267,532 $158,488,127 $259,844,645 $221,254,702 $2,752,281,656 $658,917,222 $2,149,212,217 $2,407,273,691 $434,153,451 $621,514 $592,819 $516,248 $329,334 $867,665 $631,547 $493,202 $702,357 $656,649 $589,082 $562,500 $534,000 $459,000 $315,000 $750,000 $580,000 $467,000 $629,000 $600,000 $513,900 28,687 1,481 521 1,197 698 7,854 1,941 6,225 7,336 1,434 98% 98% 97% 98% 95% 98% 99% 97% 97% 97% 26 25 34 32 51 24 22 26 27 32 Durham Region Ajax Brock Clarington Oshawa Pickering Scugog Uxbridge Whitby 9,872 1,726 189 1,562 2,526 1,237 293 317 2,022 $3,528,878,850 $677,917,442 $52,772,305 $493,769,479 $717,196,086 $522,261,015 $116,104,312 $157,097,171 $791,761,040 $357,463 $392,768 $279,219 $316,114 $283,926 $422,200 $396,260 $495,575 $391,573 $334,000 $369,700 $230,000 $297,000 $269,900 $392,000 $365,000 $450,000 $370,000 15,263 2,598 393 2,363 3,685 2,044 555 587 3,038 98% 99% 95% 98% 98% 99% 97% 97% 99% 23 20 69 23 22 23 46 40 19 Dufferin County Orangeville 610 610 $210,265,313 $210,265,313 $344,697 $344,697 $330,000 $330,000 961 961 98% 98% 37 37 2,059 142 569 282 502 564 $752,221,334 $62,947,388 $239,412,614 $88,487,452 $173,217,706 $188,156,174 $365,333 $443,291 $420,760 $313,785 $345,055 $333,610 $338,000 $410,000 $395,000 $267,000 $317,250 $310,000 3,477 296 983 433 918 847 97% 97% 98% 97% 97% 98% 43 60 31 47 49 44 Simcoe County Adjala-Tosorontio Bradford West Gwillimbury Essa Innisfil New Tecumseth Page 3 July 2010 Market Watch, November 2013 5
- 6. Toronto Real Estate Board ALL HOME TYPES, YEAR-TO-DATE 2013 CITY OF TORONTO MUNICIPAL BREAKDOWN SUMMARY OF EXISTING HOME TRANSACTIONS 1 Number of Sales Dollar Volume Average Price TREB Total 83,064 $43,460,391,501 $523,216 City of Toronto Total 31,027 $17,560,015,346 Toronto West Toronto W01 Toronto W02 Toronto W03 Toronto W04 Toronto W05 Toronto W06 Toronto W07 Toronto W08 Toronto W09 Toronto W10 7,938 486 838 669 741 976 1,147 312 1,482 457 830 Toronto Central Toronto C01 Toronto C02 Toronto C03 Toronto C04 Toronto C06 Toronto C07 Toronto C08 Toronto C09 Toronto C10 Toronto C11 Toronto C12 Toronto C13 Toronto C14 Toronto C15 Toronto East Toronto E01 Toronto E02 Toronto E03 Toronto E04 Toronto E05 Toronto E06 Toronto E07 Toronto E08 Toronto E09 Toronto E10 Toronto E11 1 1 2 4 New Listings Avg. SP/LP $440,000 152,373 98% Avg. DOM $565,959 $449,000 58,919 99% 26 $3,926,965,187 $317,460,597 $521,223,477 $291,066,750 $296,739,537 $359,519,474 $535,325,388 $233,095,346 $910,793,202 $197,636,616 $264,104,800 $494,705 $653,211 $621,985 $435,077 $400,458 $368,360 $466,718 $747,100 $614,570 $432,465 $318,199 $436,250 $612,500 $593,500 $426,000 $392,000 $395,000 $435,000 $691,750 $520,000 $450,000 $364,000 14,482 947 1,245 1,024 1,226 1,813 2,692 471 2,763 757 1,544 99% 101% 103% 101% 99% 97% 99% 101% 98% 98% 98% 27 22 18 21 27 32 33 19 28 30 30 13,958 3,647 682 497 964 308 1,043 1,464 269 578 463 368 758 1,624 1,293 $9,413,760,168 $1,717,461,599 $717,968,379 $520,462,707 $1,108,816,932 $186,357,807 $619,098,174 $666,480,288 $324,272,067 $374,897,613 $316,782,690 $680,267,650 $483,383,713 $978,604,233 $718,906,316 $674,435 $470,924 $1,052,740 $1,047,209 $1,150,225 $605,058 $593,574 $455,246 $1,205,472 $648,612 $684,196 $1,848,553 $637,709 $602,589 $555,999 $465,000 $399,000 $814,350 $745,000 $1,061,750 $609,500 $428,000 $395,000 $900,000 $540,000 $395,000 $1,553,500 $480,000 $417,750 $449,900 29,465 8,539 1,564 889 1,925 715 2,293 2,854 509 1,022 711 910 1,221 3,734 2,579 98% 99% 98% 99% 99% 98% 98% 98% 98% 100% 99% 96% 100% 97% 98% 28 30 27 22 22 30 31 29 26 21 27 32 24 32 27 9,131 862 765 952 1,115 934 406 920 598 1,138 626 815 $4,219,289,992 $517,458,697 $540,505,777 $529,043,131 $411,821,813 $396,115,042 $219,841,705 $380,782,978 $257,347,048 $390,551,678 $290,073,198 $285,748,924 $462,084 $600,300 $706,543 $555,718 $369,347 $424,106 $541,482 $413,895 $430,346 $343,191 $463,376 $350,612 $442,000 $579,950 $621,000 $535,000 $409,000 $361,844 $480,500 $416,500 $428,500 $327,750 $455,000 $335,000 14,972 1,477 1,259 1,540 1,777 1,353 733 1,515 1,045 1,928 1,111 1,234 100% 103% 101% 102% 99% 100% 99% 100% 98% 99% 99% 98% 5 27 22 16 13 17 25 22 18 25 25 25 25 26 Page 3 Median Price July 2010 Market Watch, November 2013 6
- 7. Toronto Real Estate Board DETACHED HOUSES, NOVEMBER 2013 Industrial Leasing ALL TREB AREAS SUMMARY OF EXISTING HOME TRANSACTIONS 1 1 Sales Dollar Volume Halton Region Burlington Halton Hills Milton Oakville 3,113 272 50 41 71 110 - $2,121,810,813 $191,211,168 $32,015,900 $24,732,305 $39,491,000 $94,971,963 - $681,597 $702,982 $640,318 $603,227 $556,211 $863,381 - Peel Region Brampton Caledon Mississauga 598 298 45 255 - $353,045,032 $147,054,728 $27,252,200 $178,738,104 - City of Toronto 913 TREB Total ! TURN PAGE FOR CITY OF TORONTO TABLES OR CLICK HERE: Average Price 1 Median Price 1 2 3 Avg. SP/LP 4 New Listings Active Listings Avg. DOM $575,000 $615,000 $567,000 $565,000 $546,000 $769,950 - 4,342 368 65 61 85 157 - 7,818 866 158 174 179 355 - 98% 97% 96% 98% 98% 97% - 29 35 34 48 29 36 - $590,376 $493,472 $605,604 $700,934 - $547,500 $461,750 $575,000 $625,000 - 1,011 554 77 380 - 1,841 916 258 667 - 97% 97% 97% 97% - 32 33 45 27 - $780,786,310 $855,188 $660,000 1,182 1,659 99% 5 22 York Region Aurora E. Gwillimbury Georgina King Markham Newmarket Richmond Hill Vaughan Whitchurch-Stouffville 678 43 9 56 14 135 65 140 176 40 - $533,574,750 $35,127,450 $4,902,125 $19,482,688 $17,011,500 $113,604,763 $36,705,781 $134,053,163 $147,969,180 $24,718,100 - $786,983 $816,917 $544,681 $347,905 $1,215,107 $841,517 $564,704 $957,523 $840,734 $617,953 - $690,000 $660,000 $484,000 $290,000 $1,075,000 $790,000 $530,000 $780,000 $703,750 $535,000 - 899 49 20 75 31 194 60 193 221 56 - 1,807 113 75 146 142 294 98 359 411 169 - 97% 97% 95% 97% 92% 97% 97% 97% 97% 97% - 33 34 61 37 60 28 25 34 33 43 - Durham Region Ajax Brock Clarington Oshawa Pickering Scugog Uxbridge Whitby 508 83 16 76 147 52 17 17 100 - $208,434,988 $38,515,600 $3,976,700 $27,954,900 $48,377,688 $28,466,900 $7,856,400 $9,017,500 $44,269,300 - $410,305 $464,043 $248,544 $367,828 $329,100 $547,440 $462,141 $530,441 $442,693 - $382,000 $435,000 $221,000 $341,500 $305,000 $485,000 $375,000 $450,000 $431,250 - 641 98 15 106 169 67 37 29 120 - 1,033 99 87 162 189 123 101 110 162 - 98% 98% 96% 98% 98% 97% 95% 97% 98% - 27 24 59 29 25 25 37 35 21 - Dufferin County Orangeville 31 31 - $11,190,660 $11,190,660 - $360,989 $360,989 - $337,000 $337,000 - 44 44 - 97 97 - 97% 97% - 38 38 - Simcoe County Adjala-Tosorontio Bradford West Gwillimbury Essa Innisfil New Tecumseth 113 12 23 16 32 30 $43,567,905 $5,629,000 $10,884,805 $5,857,000 $10,058,800 $11,138,300 $385,557 $469,083 $473,252 $366,063 $314,338 $371,277 $353,000 $477,500 $495,000 $321,000 $294,500 $341,500 197 14 52 28 68 35 515 74 119 71 158 93 97% 97% 98% 96% 96% 97% 44 60 33 54 49 37 Page 3 July 2010 Market Watch, November 2013 7
- 8. Toronto Real Estate Board Industrial Leasing DETACHED HOUSES, NOVEMBER 2013 CITY OF TORONTO MUNICIPAL BREAKDOWN SUMMARY OF EXISTING HOME TRANSACTIONS Sales1 TREB Total Dollar Volume1 Average Price1 Median Price1 New Listings2 Active Listings3 Avg. SP/LP 4 Avg. DOM5 3,113 $2,121,810,813 $681,597 $575,000 4,342 7,818 98% 29 City of Toronto Total 913 $780,786,310 $855,188 $660,000 1,182 1,659 99% 22 Toronto West Toronto W01 Toronto W02 Toronto W03 Toronto W04 Toronto W05 Toronto W06 Toronto W07 Toronto W08 Toronto W09 Toronto W10 284 13 26 25 40 18 29 22 50 20 41 $192,234,560 $12,819,700 $24,313,000 $11,299,400 $22,776,750 $9,338,525 $16,282,000 $17,308,788 $46,247,897 $12,622,500 $19,226,000 $676,882 $986,131 $935,115 $451,976 $569,419 $518,807 $561,448 $786,763 $924,958 $631,125 $468,927 $584,500 $878,300 $827,500 $471,500 $513,875 $513,250 $556,000 $665,000 $815,500 $612,750 $455,000 343 13 26 40 45 33 32 23 65 17 49 483 18 23 51 48 73 36 20 138 27 49 99% 102% 99% 101% 100% 99% 100% 101% 99% 99% 97% 23 27 25 19 18 20 26 17 23 32 27 Toronto Central Toronto C01 Toronto C02 Toronto C03 Toronto C04 Toronto C06 Toronto C07 Toronto C08 Toronto C09 Toronto C10 Toronto C11 Toronto C12 Toronto C13 Toronto C14 Toronto C15 282 7 16 29 58 12 44 2 4 7 9 13 17 38 26 $370,389,455 $7,793,189 $24,977,571 $28,637,317 $81,494,351 $11,020,450 $44,588,799 $4,370,000 $10,475,000 $8,722,500 $14,254,000 $39,466,328 $18,933,600 $48,394,450 $27,261,900 $1,313,438 $1,113,313 $1,561,098 $987,494 $1,405,075 $918,371 $1,013,382 $2,185,000 $2,618,750 $1,246,071 $1,583,778 $3,035,871 $1,113,741 $1,273,538 $1,048,535 $1,125,000 $1,111,189 $1,242,500 $750,000 $1,381,000 $842,500 $870,500 $2,185,000 $2,570,000 $1,407,000 $1,475,000 $2,550,000 $1,050,000 $1,159,000 $910,000 390 9 19 33 97 21 60 2 9 12 6 24 13 54 31 725 8 23 68 165 34 97 3 33 15 13 101 26 101 38 98% 103% 97% 99% 99% 97% 99% 97% 99% 99% 97% 96% 101% 97% 99% 25 18 26 18 23 26 29 22 15 14 30 41 18 29 22 Toronto East Toronto E01 Toronto E02 Toronto E03 Toronto E04 Toronto E05 Toronto E06 Toronto E07 Toronto E08 Toronto E09 Toronto E10 Toronto E11 347 14 30 47 51 23 33 26 23 39 42 19 $218,162,295 $10,495,488 $35,107,585 $28,432,200 $25,492,213 $16,081,200 $18,700,634 $18,697,100 $14,287,900 $18,141,561 $21,899,514 $10,826,900 $628,710 $749,678 $1,170,253 $604,940 $499,847 $699,183 $566,686 $719,119 $621,213 $465,168 $521,417 $569,837 $550,000 $700,000 $1,014,375 $560,000 $480,000 $700,000 $515,334 $657,000 $550,000 $452,000 $500,500 $551,000 449 17 33 62 50 23 50 42 34 59 52 27 451 18 38 68 40 17 49 35 50 53 56 27 100% 104% 97% 101% 101% 102% 99% 99% 100% 101% 99% 100% 19 11 24 14 19 19 28 19 19 18 20 21 Page 3 July 2010 Market Watch, November 2013 8
- 9. Toronto Real Estate Board SEMI-DETACHED HOUSES, NOVEMBER 2013 Industrial Leasing ALL TREB AREAS SUMMARY OF EXISTING HOME TRANSACTIONS 1 1 Sales Dollar Volume Halton Region Burlington Halton Hills Milton Oakville 685 39 9 3 14 13 - $346,210,397 $17,249,040 $3,789,750 $1,035,000 $6,037,740 $6,386,550 - $505,417 $442,283 $421,083 $345,000 $431,267 $491,273 - Peel Region Brampton Caledon Mississauga 219 115 3 101 - $92,051,763 $43,012,263 $1,303,500 $47,736,000 - City of Toronto 267 TREB Total ! TURN PAGE FOR CITY OF TORONTO TABLES OR CLICK HERE: Average Price 1 Median Price 1 2 3 Avg. SP/LP 4 New Listings Active Listings Avg. DOM $467,000 $433,750 $397,000 $347,000 $433,500 $495,000 - 797 44 8 2 19 15 - 755 38 9 2 13 14 - 100% 99% 99% 98% 99% 98% - 20 19 20 27 13 23 - $420,328 $374,020 $434,500 $472,634 - $415,000 $370,000 $427,500 $465,500 - 294 154 10 130 - 330 193 10 127 - 98% 98% 100% 98% - 23 26 7 20 - $170,935,602 $640,208 $585,000 291 248 103% 5 17 York Region Aurora E. Gwillimbury Georgina King Markham Newmarket Richmond Hill Vaughan Whitchurch-Stouffville 101 5 1 1 23 14 20 30 7 - $50,389,352 $1,821,000 $409,900 $340,000 $12,219,800 $5,918,200 $10,674,100 $15,948,800 $3,057,552 - $498,904 $364,200 $409,900 $340,000 $531,296 $422,729 $533,705 $531,627 $436,793 - $494,500 $350,000 $409,900 $340,000 $520,500 $439,500 $497,000 $535,000 $435,000 - 105 8 2 2 19 17 13 35 9 - 92 7 3 2 1 17 19 8 31 4 - 99% 96% 100% 97% 100% 99% 98% 99% 99% - 19 15 8 8 21 21 18 20 13 - Durham Region Ajax Brock Clarington Oshawa Pickering Scugog Uxbridge Whitby 46 5 6 25 4 1 5 - $11,991,650 $1,714,600 $1,330,500 $5,528,050 $1,579,000 $240,000 $1,599,500 - $260,688 $342,920 $221,750 $221,122 $394,750 $240,000 $319,900 - $236,400 $355,000 $227,500 $215,600 $398,500 $240,000 $317,000 - 45 4 6 26 7 1 1 - 31 4 3 12 9 1 2 - 98% 100% 97% 99% 97% 98% 98% - 23 11 18 24 34 6 29 - Dufferin County Orangeville 6 6 - $1,621,000 $1,621,000 - $270,167 $270,167 - $270,000 $270,000 - 8 8 - 7 7 - 98% 98% - 38 38 - Simcoe County Adjala-Tosorontio Bradford West Gwillimbury Essa Innisfil New Tecumseth 7 4 1 2 $1,971,990 $1,130,000 $268,000 $573,990 $281,713 $282,500 $268,000 $286,995 $268,000 $262,500 $268,000 $286,995 10 5 1 4 9 3 1 5 98% 98% 99% 97% 25 16 24 44 Page 3 July 2010 Market Watch, November 2013 9
- 10. Toronto Real Estate Board Industrial Leasing SEMI-DETACHED HOUSES, NOVEMBER 2013 CITY OF TORONTO MUNICIPAL BREAKDOWN SUMMARY OF EXISTING HOME TRANSACTIONS Sales1 Dollar Volume1 Average Price1 Median Price1 New Listings2 Active Listings3 Avg. SP/LP 4 Avg. DOM5 TREB Total 685 $346,210,397 $505,417 $467,000 797 755 100% 20 City of Toronto Total 267 $170,935,602 $640,208 $585,000 291 248 103% 17 Toronto West Toronto W01 Toronto W02 Toronto W03 Toronto W04 Toronto W05 Toronto W06 Toronto W07 Toronto W08 Toronto W09 Toronto W10 67 2 17 17 3 20 3 1 1 2 1 $35,831,160 $1,517,500 $11,416,360 $8,120,000 $1,286,000 $9,511,500 $1,561,800 $418,000 $477,000 $1,122,000 $401,000 $534,793 $758,750 $671,551 $477,647 $428,667 $475,575 $520,600 $418,000 $477,000 $561,000 $401,000 $495,110 $758,750 $636,000 $475,500 $440,000 $444,000 $522,000 $418,000 $477,000 $561,000 $401,000 92 5 26 16 7 28 4 2 4 99 6 16 14 7 44 3 1 3 5 103% 109% 109% 104% 97% 97% 98% 100% 96% 96% 100% 21 8 11 14 28 36 26 15 17 22 4 Toronto Central Toronto C01 Toronto C02 Toronto C03 Toronto C04 Toronto C06 Toronto C07 Toronto C08 Toronto C09 Toronto C10 Toronto C11 Toronto C12 Toronto C13 Toronto C14 Toronto C15 88 8 18 7 11 7 2 3 4 5 2 9 1 11 $69,584,109 $6,821,509 $17,749,500 $4,343,800 $10,887,000 $4,179,000 $2,123,500 $3,968,500 $2,974,500 $3,792,000 $1,321,800 $4,430,000 $690,000 $6,303,000 $790,729 $852,689 $986,083 $620,543 $989,727 $597,000 $1,061,750 $1,322,833 $743,625 $758,400 $660,900 $492,222 $690,000 $573,000 $672,500 $877,500 $924,750 $590,000 $972,000 $592,000 $1,061,750 $1,650,000 $729,750 $752,500 $660,900 $475,500 $690,000 $569,000 78 13 9 6 11 7 5 1 4 4 2 6 10 67 12 15 7 6 2 6 5 4 4 6 102% 104% 97% 109% 104% 102% 95% 98% 98% 107% 111% 105% 99% 101% 19 10 38 11 16 6 39 25 15 8 3 8 45 17 Toronto East Toronto E01 Toronto E02 Toronto E03 Toronto E04 Toronto E05 Toronto E06 Toronto E07 Toronto E08 Toronto E09 Toronto E10 Toronto E11 112 36 24 18 7 9 2 4 1 2 9 $65,520,333 $24,173,464 $15,846,442 $10,423,162 $3,016,677 $4,741,588 $890,000 $1,870,500 $400,000 $675,000 $3,483,500 $585,003 $671,485 $660,268 $579,065 $430,954 $526,843 $445,000 $467,625 $400,000 $337,500 $387,056 $548,000 $675,650 $627,600 $553,000 $419,000 $510,000 $445,000 $464,000 $400,000 $337,500 $366,000 121 35 29 21 8 7 3 5 1 2 2 8 82 23 19 17 5 1 3 2 2 3 4 3 104% 107% 102% 102% 99% 110% 99% 103% 93% 97% 98% 14 11 16 18 14 5 5 8 20 50 16 Page 3 July 2010 Market Watch, November 2013 10
- 11. Toronto Real Estate Board CONDOMINIUM TOWNHOUSES, NOVEMBER 2013 Industrial Leasing ALL TREB AREAS SUMMARY OF EXISTING HOME TRANSACTIONS 1 1 Sales Dollar Volume Halton Region Burlington Halton Hills Milton Oakville 504 39 17 3 6 13 - $181,259,806 $13,617,990 $5,299,700 $732,900 $1,606,100 $5,979,290 - $359,642 $349,179 $311,747 $244,300 $267,683 $459,945 - Peel Region Brampton Caledon Mississauga 187 53 134 - $60,993,900 $14,512,200 $46,481,700 - City of Toronto 176 TREB Total ! TURN PAGE FOR CITY OF TORONTO TABLES OR CLICK HERE: Average Price 1 Median Price 1 2 3 Avg. SP/LP 4 New Listings Active Listings Avg. DOM $335,000 $325,000 $319,900 $248,900 $274,550 $453,000 - 593 40 14 6 5 15 - 912 74 27 7 5 35 - 98% 98% 98% 98% 98% 98% - 31 31 40 18 22 27 - $326,171 $273,815 $346,878 - $317,000 $275,000 $345,000 - 188 47 141 - 271 75 196 - 98% 98% 98% - 33 38 31 - $72,854,128 $413,944 $359,000 220 357 98% 5 27 York Region Aurora E. Gwillimbury Georgina King Markham Newmarket Richmond Hill Vaughan Whitchurch-Stouffville 55 6 1 25 5 9 9 - $23,183,200 $3,096,000 $225,000 $10,673,100 $1,392,500 $3,632,600 $4,164,000 - $421,513 $516,000 $225,000 $426,924 $278,500 $403,622 $462,667 - $400,000 $473,000 $225,000 $426,000 $282,500 $374,000 $435,000 - 75 6 1 28 9 14 17 - 134 20 1 45 11 24 31 2 - 98% 98% 99% 98% 97% 97% 98% - 32 31 7 36 25 30 30 - Durham Region Ajax Brock Clarington Oshawa Pickering Scugog Uxbridge Whitby 46 4 2 3 12 14 2 9 - $10,347,588 $1,006,000 $277,000 $732,000 $1,887,100 $3,588,888 $550,000 $2,306,600 - $224,948 $251,500 $138,500 $244,000 $157,258 $256,349 $275,000 $256,289 - $233,000 $247,500 $138,500 $234,000 $132,750 $246,944 $275,000 $262,400 - 64 7 1 2 27 13 1 13 - 65 6 2 1 25 15 6 10 - 98% 98% 97% 100% 97% 98% 97% 98% - 36 17 133 66 26 37 80 16 - Dufferin County Orangeville 1 1 - $263,000 $263,000 - $263,000 $263,000 - $263,000 $263,000 - 3 3 - 4 4 - 100% 100% - 18 18 - Simcoe County Adjala-Tosorontio Bradford West Gwillimbury Essa Innisfil New Tecumseth - - - - 3 1 2 7 1 6 - - Page 3 July 2010 Market Watch, November 2013 11
- 12. Toronto Real Estate Board Industrial Leasing SUMMARY OF EXISTING HOME TRANSACTIONS CONDOMINIUM TOWNHOUSES, NOVEMBER 2013 CITY OF TORONTO MUNICIPAL BREAKDOWN Sales1 Dollar Volume1 Average Price1 Median Price1 New Listings2 Active Listings3 Avg. SP/LP 4 Avg. DOM5 TREB Total 504 $181,259,806 $359,642 $335,000 593 912 98% 31 City of Toronto Total 176 $72,854,128 $413,944 $359,000 220 357 98% 27 Toronto West Toronto W01 Toronto W02 Toronto W03 Toronto W04 Toronto W05 Toronto W06 Toronto W07 Toronto W08 Toronto W09 Toronto W10 51 6 3 2 7 13 3 1 6 2 8 $17,562,950 $2,693,050 $1,130,000 $593,500 $1,900,400 $3,789,400 $1,593,900 $650,000 $2,524,500 $1,039,000 $1,649,200 $344,372 $448,842 $376,667 $296,750 $271,486 $291,492 $531,300 $650,000 $420,750 $519,500 $206,150 $327,000 $437,525 $373,500 $296,750 $268,000 $285,000 $453,000 $650,000 $430,000 $519,500 $217,500 54 5 7 1 4 14 5 7 2 9 119 8 6 4 8 35 11 19 9 19 97% 98% 98% 98% 97% 97% 97% 94% 98% 98% 96% 32 26 15 10 32 38 35 19 35 42 37 Toronto Central Toronto C01 Toronto C02 Toronto C03 Toronto C04 Toronto C06 Toronto C07 Toronto C08 Toronto C09 Toronto C10 Toronto C11 Toronto C12 Toronto C13 Toronto C14 Toronto C15 64 22 3 2 3 2 5 1 2 5 1 6 12 $35,062,489 $10,102,950 $4,230,050 $967,000 $1,069,500 $1,176,000 $4,161,800 $860,000 $358,900 $3,795,000 $405,000 $3,162,989 $4,773,300 $547,851 $459,225 $1,410,017 $483,500 $356,500 $588,000 $832,360 $860,000 $179,450 $759,000 $405,000 $527,165 $397,775 $465,000 $430,000 $1,600,050 $483,500 $375,500 $588,000 $901,000 $860,000 $179,450 $759,000 $405,000 $523,000 $407,500 80 24 4 1 2 4 2 5 2 3 6 1 12 14 129 37 6 5 3 2 7 8 5 4 6 3 22 21 98% 99% 95% 100% 99% 95% 99% 97% 97% 98% 95% 99% 97% 29 28 70 35 20 69 15 41 16 18 30 17 31 Toronto East Toronto E01 Toronto E02 Toronto E03 Toronto E04 Toronto E05 Toronto E06 Toronto E07 Toronto E08 Toronto E09 Toronto E10 Toronto E11 61 1 4 8 20 6 4 5 4 9 $20,228,689 $520,900 $1,707,490 $2,757,800 $6,895,350 $2,148,000 $1,382,150 $1,276,499 $1,010,500 $2,530,000 $331,618 $520,900 $426,873 $344,725 $344,768 $358,000 $345,538 $255,300 $252,625 $281,111 $343,500 $520,900 $415,000 $362,450 $350,000 $346,500 $345,500 $286,500 $255,000 $290,000 86 7 6 13 20 7 6 6 11 10 109 13 6 1 16 14 10 9 6 17 17 99% 99% 100% 99% 101% 99% 98% 99% 97% 97% 22 21 13 22 21 21 22 29 11 26 Page 3 July 2010 Market Watch, November 2013 12
- 13. Toronto Real Estate Board CONDOMINIUM APARTMENT, NOVEMBER 2013 Industrial Leasing ALL TREB AREAS SUMMARY OF EXISTING HOME TRANSACTIONS Sales 1 Dollar Volume Halton Region Burlington Halton Hills Milton Oakville 1,515 41 19 8 14 - $537,618,573 $11,698,790 $4,828,790 $2,225,000 $4,645,000 - $354,864 $285,336 $254,147 $278,125 $331,786 - Peel Region Brampton Caledon Mississauga 221 38 2 181 - $56,541,140 $8,218,650 $900,000 $47,422,490 - 1,081 TREB Total City of Toronto ! TURN PAGE FOR CITY OF TORONTO TABLES OR CLICK HERE: 1 Average Price 1 Median Price 1 2 3 Avg. SP/LP 4 New Listings Active Listings Avg. DOM $310,500 $270,000 $250,000 $280,000 $293,750 - 2,902 68 23 2 9 34 - 5,781 162 54 8 12 88 - 97% 97% 98% 96% 97% - 36 38 36 44 39 - $255,842 $216,280 $450,000 $262,003 - $244,000 $202,500 $450,000 $248,000 - 453 62 391 - 937 124 813 - 97% 97% 98% 97% - 38 48 64 35 - $417,231,807 $385,968 $332,000 2,017 3,926 98% 5 35 York Region Aurora E. Gwillimbury Georgina King Markham Newmarket Richmond Hill Vaughan Whitchurch-Stouffville 130 4 1 1 51 5 32 36 - $41,732,736 $1,172,000 $140,000 $430,000 $16,862,276 $1,450,900 $9,548,910 $12,128,650 - $321,021 $293,000 $140,000 $430,000 $330,633 $290,180 $298,403 $336,907 - $305,000 $295,000 $140,000 $430,000 $302,000 $258,000 $303,750 $331,000 - 307 4 7 113 6 77 96 4 - 661 26 6 15 245 6 163 192 8 - 97% 96% 98% 101% 97% 98% 97% 96% - 41 52 114 212 41 17 35 42 - Durham Region Ajax Brock Clarington Oshawa Pickering Scugog Uxbridge Whitby 36 5 7 5 12 1 2 4 - $9,176,600 $1,119,700 $1,269,000 $965,900 $3,504,000 $290,000 $482,000 $1,546,000 - $254,906 $223,940 $181,286 $193,180 $292,000 $290,000 $241,000 $386,500 - $234,400 $198,000 $173,000 $152,000 $287,750 $290,000 $241,000 $391,500 - 50 9 1 9 12 12 1 6 - 77 16 1 9 21 19 4 7 - 98% 99% 98% 97% 98% 97% 99% 95% - 32 21 40 28 29 102 27 33 - Dufferin County Orangeville 3 3 - $616,500 $616,500 - $205,500 $205,500 - $238,000 $238,000 - 3 3 - 5 5 - 96% 96% - 37 37 - Simcoe County Adjala-Tosorontio Bradford West Gwillimbury Essa Innisfil New Tecumseth 3 3 $621,000 $621,000 $207,000 $207,000 $184,500 $184,500 4 4 13 13 96% 96% 118 118 Page 3 July 2010 Market Watch, November 2013 13
- 14. Toronto Real Estate Board Industrial Leasing SUMMARY OF EXISTING HOME TRANSACTIONS CONDOMINIUM APARTMENT, NOVEMBER 2013 CITY OF TORONTO MUNICIPAL BREAKDOWN Sales1 Dollar Volume1 Average Price1 Median Price1 New Listings2 Active Listings3 Avg. SP/LP 4 Avg. DOM5 TREB Total 1,515 $537,618,573 $354,864 $310,500 2,902 5,781 97% 36 City of Toronto Total 1,081 $417,231,807 $385,968 $332,000 2,017 3,926 98% 35 Toronto West Toronto W01 Toronto W02 Toronto W03 Toronto W04 Toronto W05 Toronto W06 Toronto W07 Toronto W08 Toronto W09 Toronto W10 227 17 13 7 21 26 40 1 61 18 23 $66,580,905 $5,776,400 $5,390,200 $1,738,800 $4,700,200 $5,271,500 $15,204,523 $327,000 $21,050,280 $2,889,002 $4,233,000 $293,308 $339,788 $414,631 $248,400 $223,819 $202,750 $380,113 $327,000 $345,087 $160,500 $184,043 $270,500 $285,000 $405,000 $237,000 $222,000 $193,000 $345,000 $327,000 $303,000 $148,000 $176,000 436 54 30 7 25 42 106 1 99 24 48 870 97 40 9 38 88 263 5 170 43 117 98% 99% 101% 97% 97% 97% 98% 98% 98% 95% 97% 42 33 55 38 41 54 43 53 36 41 41 Toronto Central Toronto C01 Toronto C02 Toronto C03 Toronto C04 Toronto C06 Toronto C07 Toronto C08 Toronto C09 Toronto C10 Toronto C11 Toronto C12 Toronto C13 Toronto C14 Toronto C15 688 235 24 9 16 18 54 103 13 29 19 4 31 94 39 $309,079,602 $107,477,682 $26,913,300 $6,630,888 $7,496,700 $5,715,176 $20,772,833 $42,582,180 $8,516,488 $13,199,800 $5,275,815 $5,174,900 $9,727,250 $34,938,800 $14,657,790 $449,244 $457,352 $1,121,388 $736,765 $468,544 $317,510 $384,682 $413,419 $655,114 $455,166 $277,674 $1,293,725 $313,782 $371,689 $375,841 $378,500 $392,500 $715,000 $594,000 $341,450 $307,000 $360,000 $395,000 $562,000 $415,000 $232,000 $685,000 $281,000 $342,750 $334,000 1,313 528 68 9 23 29 84 174 11 58 35 14 32 160 88 2,548 1,055 163 16 43 50 179 303 17 64 42 28 58 324 206 98% 98% 95% 98% 101% 98% 98% 98% 101% 98% 99% 96% 97% 98% 96% 33 31 40 30 30 30 35 28 29 27 28 34 42 40 44 Toronto East Toronto E01 Toronto E02 Toronto E03 Toronto E04 Toronto E05 Toronto E06 Toronto E07 Toronto E08 Toronto E09 Toronto E10 Toronto E11 166 11 5 6 28 22 4 31 13 36 1 9 $41,571,300 $5,229,797 $2,146,300 $990,000 $5,527,700 $6,479,500 $1,077,900 $7,384,603 $2,333,500 $8,848,500 $150,000 $1,403,500 $250,430 $475,436 $429,260 $165,000 $197,418 $294,523 $269,475 $238,213 $179,500 $245,792 $150,000 $155,944 $236,250 $435,000 $372,000 $151,750 $196,000 $297,250 $256,450 $231,000 $155,000 $245,000 $150,000 $115,000 268 24 15 5 26 36 5 49 19 66 9 14 508 36 29 11 56 59 5 87 36 131 18 40 97% 99% 103% 98% 96% 97% 97% 97% 97% 97% 98% 97% 34 23 10 23 44 31 22 28 40 42 61 37 Page 3 July 2010 Market Watch, November 2013 14
- 15. Toronto Real Estate Board LINK, NOVEMBER 2013 Industrial Leasing ALL TREB AREAS SUMMARY OF EXISTING HOME TRANSACTIONS 1 1 Sales Dollar Volume Halton Region Burlington Halton Hills Milton Oakville 95 2 1 1 - $43,729,200 $977,700 $410,200 $567,500 - $460,307 $488,850 $410,200 $567,500 - Peel Region Brampton Caledon Mississauga 3 1 2 - $1,368,000 $345,000 $1,023,000 - City of Toronto 7 TREB Total ! TURN PAGE FOR CITY OF TORONTO TABLES OR CLICK HERE: Average Price 1 Median Price 1 2 3 Avg. SP/LP 4 New Listings Active Listings Avg. DOM $456,000 $488,850 $410,200 $567,500 - 98 3 1 1 1 - 93 7 3 2 2 - 99% 99% 100% 99% - 21 28 7 49 - $456,000 $345,000 $511,500 - $485,000 $345,000 $511,500 - 8 4 4 - 15 6 9 - 98% 99% 98% - 31 65 15 - $3,235,600 $462,229 $451,000 9 10 101% 5 26 York Region Aurora E. Gwillimbury Georgina King Markham Newmarket Richmond Hill Vaughan Whitchurch-Stouffville 45 2 32 4 7 - $26,145,500 $888,000 $19,040,500 $2,331,500 $3,885,500 - $581,011 $444,000 $595,016 $582,875 $555,071 - $574,000 $444,000 $588,500 $590,750 $550,000 - 48 1 1 35 10 1 - 42 1 23 14 4 - 99% 99% 99% 97% 98% - 21 25 20 19 29 - Durham Region Ajax Brock Clarington Oshawa Pickering Scugog Uxbridge Whitby 29 4 12 2 4 1 6 - $8,891,000 $1,380,000 $3,301,500 $521,000 $1,405,000 $430,000 $1,853,500 - $306,586 $345,000 $275,125 $260,500 $351,250 $430,000 $308,917 - $305,000 $345,500 $274,750 $260,500 $340,750 $430,000 $305,750 - 23 1 10 1 2 1 1 7 - 12 5 1 1 1 1 3 - 99% 101% 99% 98% 99% 96% 99% - 17 15 15 20 17 11 21 - Dufferin County Orangeville - - - - - - - - Simcoe County Adjala-Tosorontio Bradford West Gwillimbury Essa Innisfil New Tecumseth 9 7 2 $3,111,400 $2,567,400 $544,000 $345,711 $366,771 $272,000 $365,000 $369,500 $272,000 7 6 1 7 5 1 1 98% 99% 97% 29 19 65 Page 3 July 2010 Market Watch, November 2013 15
- 16. Toronto Real Estate Board Industrial Leasing LINK, NOVEMBER 2013 CITY OF TORONTO MUNICIPAL BREAKDOWN SUMMARY OF EXISTING HOME TRANSACTIONS Sales1 Dollar Volume1 Average Price1 Median Price1 New Listings2 Active Listings3 Avg. SP/LP 4 Avg. DOM5 TREB Total 95 $43,729,200 $460,307 $456,000 98 City of Toronto Total 7 $3,235,600 $462,229 $451,000 9 93 99% 21 10 101% 26 Toronto West Toronto W01 Toronto W02 Toronto W03 Toronto W04 Toronto W05 Toronto W06 Toronto W07 Toronto W08 Toronto W09 Toronto W10 - - - - 2 2 1 1 - - Toronto Central Toronto C01 Toronto C02 Toronto C03 Toronto C04 Toronto C06 Toronto C07 Toronto C08 Toronto C09 Toronto C10 Toronto C11 Toronto C12 Toronto C13 Toronto C14 Toronto C15 1 1 $621,000 $621,000 $621,000 $621,000 $621,000 $621,000 2 1 1 1 1 - 109% 109% 7 7 Toronto East Toronto E01 Toronto E02 Toronto E03 Toronto E04 Toronto E05 Toronto E06 Toronto E07 Toronto E08 Toronto E09 Toronto E10 Toronto E11 6 2 1 3 $2,614,600 $922,500 $455,000 $1,237,100 $435,767 $461,250 $455,000 $412,367 $444,000 $461,250 $455,000 $405,100 5 2 1 2 8 4 1 3 99% 99% 97% 100% 30 50 9 23 Page 3 July 2010 Market Watch, November 2013 16
- 17. Toronto Real Estate Board ATTACHED/ROW/TOWNHOUSE, NOVEMBER 2013 Industrial Leasing ALL TREB AREAS SUMMARY OF EXISTING HOME TRANSACTIONS 1 1 Sales Dollar Volume Halton Region Burlington Halton Hills Milton Oakville 457 76 8 8 36 24 - $205,989,544 $31,813,510 $3,104,510 $2,909,400 $13,996,100 $11,803,500 - $450,743 $418,599 $388,064 $363,675 $388,781 $491,813 - Peel Region Brampton Caledon Mississauga 92 56 7 29 - $35,906,630 $19,880,800 $2,673,280 $13,352,550 - City of Toronto 73 TREB Total ! TURN PAGE FOR CITY OF TORONTO TABLES OR CLICK HERE: Average Price 1 Median Price 1 2 3 Avg. SP/LP 4 New Listings Active Listings Avg. DOM $425,000 $411,000 $396,500 $377,950 $392,500 $457,000 - 584 88 12 9 38 29 - 651 97 13 6 35 43 - 99% 98% 97% 99% 99% 98% - 20 19 17 21 16 23 - $390,289 $355,014 $381,897 $460,433 - $374,500 $352,000 $370,000 $445,000 - 124 72 4 48 - 143 100 5 38 - 98% 98% 97% 99% - 21 23 34 14 - $44,853,740 $614,435 $575,000 110 132 100% 5 21 York Region Aurora E. Gwillimbury Georgina King Markham Newmarket Richmond Hill Vaughan Whitchurch-Stouffville 145 6 2 48 17 29 37 6 - $72,989,324 $2,721,500 $602,000 $24,841,206 $6,777,200 $15,815,000 $19,783,238 $2,449,180 - $503,375 $453,583 $301,000 $517,525 $398,659 $545,345 $534,682 $408,197 - $503,000 $437,000 $301,000 $514,900 $399,000 $558,000 $515,000 $413,250 - 169 5 2 2 1 66 13 43 33 4 - 202 5 2 3 1 75 10 54 46 6 - 99% 98% 99% 99% 98% 98% 98% 98% - 20 13 13 20 18 21 21 34 - Durham Region Ajax Brock Clarington Oshawa Pickering Scugog Uxbridge Whitby 55 13 8 9 8 1 16 - $16,392,840 $4,140,750 $1,900,800 $2,126,390 $2,700,500 $455,000 $5,069,400 - $298,052 $318,519 $237,600 $236,266 $337,563 $455,000 $316,838 - $308,900 $322,500 $237,450 $255,000 $330,000 $455,000 $322,500 - 75 20 16 6 13 3 17 - 57 19 12 6 9 2 9 - 99% 99% 101% 99% 100% 99% 100% - 19 16 11 52 12 2 12 - Dufferin County Orangeville 3 3 - $816,500 $816,500 - $272,167 $272,167 - $275,000 $275,000 - 3 3 - 5 5 - 96% 96% - 40 40 - Simcoe County Adjala-Tosorontio Bradford West Gwillimbury Essa Innisfil New Tecumseth 13 2 2 3 6 $3,217,000 $577,000 $437,000 $699,500 $1,503,500 $247,462 $288,500 $218,500 $233,167 $250,583 $249,000 $288,500 $218,500 $226,000 $253,500 15 5 4 6 15 5 1 2 7 98% 99% 98% 98% 98% 25 13 26 17 34 Page 3 July 2010 Market Watch, November 2013 17
- 18. Toronto Real Estate Board Industrial Leasing SUMMARY OF EXISTING HOME TRANSACTIONS ATTACHED/ROW/TOWNHOUSE, NOVEMBER 2013 CITY OF TORONTO MUNICIPAL BREAKDOWN Sales1 Dollar Volume1 Average Price1 Median Price1 New Listings2 Active Listings3 Avg. SP/LP 4 Avg. DOM5 TREB Total 457 $205,989,544 $450,743 $425,000 584 City of Toronto Total 73 $44,853,740 $614,435 $575,000 110 651 99% 20 132 100% 21 Toronto West Toronto W01 Toronto W02 Toronto W03 Toronto W04 Toronto W05 Toronto W06 Toronto W07 Toronto W08 Toronto W09 Toronto W10 25 1 5 1 4 1 7 2 2 1 1 $14,174,900 $720,000 $3,155,000 $452,000 $1,702,000 $428,000 $3,995,000 $1,378,000 $1,345,000 $550,000 $449,900 $566,996 $720,000 $631,000 $452,000 $425,500 $428,000 $570,714 $689,000 $672,500 $550,000 $449,900 $567,000 $720,000 $625,000 $452,000 $434,000 $428,000 $575,000 $689,000 $672,500 $550,000 $449,900 22 3 3 2 3 5 3 1 2 30 2 3 1 6 11 4 2 1 100% 103% 105% 97% 99% 100% 99% 99% 99% 97% 100% 18 7 8 25 33 16 21 14 19 17 7 Toronto Central Toronto C01 Toronto C02 Toronto C03 Toronto C04 Toronto C06 Toronto C07 Toronto C08 Toronto C09 Toronto C10 Toronto C11 Toronto C12 Toronto C13 Toronto C14 Toronto C15 23 7 4 1 1 3 4 1 2 - $18,598,850 $5,919,900 $3,533,500 $1,200,000 $640,000 $2,323,000 $2,674,550 $605,000 $1,702,900 - $808,646 $845,700 $883,375 $1,200,000 $640,000 $774,333 $668,638 $605,000 $851,450 - $770,000 $840,000 $656,750 $1,200,000 $640,000 $726,000 $677,325 $605,000 $851,450 - 46 16 4 1 1 9 7 1 2 5 - 58 19 6 3 5 4 6 1 2 2 10 - 100% 100% 106% 92% 97% 100% 103% 96% 92% - 20 20 9 84 22 9 10 49 36 - Toronto East Toronto E01 Toronto E02 Toronto E03 Toronto E04 Toronto E05 Toronto E06 Toronto E07 Toronto E08 Toronto E09 Toronto E10 Toronto E11 25 3 4 2 5 3 2 6 $12,079,990 $2,138,000 $1,699,000 $1,530,990 $2,283,000 $1,355,000 $785,000 $2,289,000 $483,200 $712,667 $424,750 $765,495 $456,600 $451,667 $392,500 $381,500 $430,000 $708,000 $400,000 $765,495 $427,000 $437,000 $392,500 $369,500 42 6 5 3 7 2 4 4 1 10 44 5 6 3 11 1 2 1 4 4 7 101% 107% 99% 104% 98% 100% 96% 100% 24 11 18 19 35 4 53 26 Page 3 July 2010 Market Watch, November 2013 18
- 19. Toronto Real Estate Board CO-OP APARTMENT, NOVEMBER 2013 Industrial Leasing ALL TREB AREAS SUMMARY OF EXISTING HOME TRANSACTIONS 1 1 Sales Dollar Volume Halton Region Burlington Halton Hills Milton Oakville 7 1 1 - $2,400,000 $845,000 $845,000 - $342,857 $845,000 $845,000 - Peel Region Brampton Caledon Mississauga 1 1 - $151,000 $151,000 - City of Toronto 5 TREB Total ! TURN PAGE FOR CITY OF TORONTO TABLES OR CLICK HERE: Average Price 1 Median Price 1 2 3 Avg. SP/LP 4 New Listings Active Listings Avg. DOM $151,000 $845,000 $845,000 - 11 - 30 1 1 - 96% 98% 98% - 65 98 98 - $151,000 $151,000 - $151,000 $151,000 - 1 1 - 1 1 - 96% 96% - 22 22 - $1,404,000 $280,800 $123,000 9 26 96% 5 67 York Region Aurora E. Gwillimbury Georgina King Markham Newmarket Richmond Hill Vaughan Whitchurch-Stouffville - - - - 1 1 - 2 1 1 - - - Durham Region Ajax Brock Clarington Oshawa Pickering Scugog Uxbridge Whitby - - - - - - - - Dufferin County Orangeville - - - - - - - - Simcoe County Adjala-Tosorontio Bradford West Gwillimbury Essa Innisfil New Tecumseth - - - - - - - - Page 3 July 2010 Market Watch, November 2013 19
- 20. Toronto Real Estate Board Industrial Leasing CO-OP APARTMENT, NOVEMBER 2013 CITY OF TORONTO MUNICIPAL BREAKDOWN SUMMARY OF EXISTING HOME TRANSACTIONS Sales1 Dollar Volume1 Average Price1 Median Price1 New Listings2 Active Listings3 Avg. SP/LP 4 Avg. DOM5 TREB Total 7 $2,400,000 $342,857 $151,000 11 30 96% 65 City of Toronto Total 5 $1,404,000 $280,800 $123,000 9 26 96% 67 Toronto West Toronto W01 Toronto W02 Toronto W03 Toronto W04 Toronto W05 Toronto W06 Toronto W07 Toronto W08 Toronto W09 Toronto W10 2 1 1 - $191,000 $68,000 $123,000 - $95,500 $68,000 $123,000 - $95,500 $68,000 $123,000 - 1 1 - 4 2 1 1 - 91% 91% 91% - 92 71 112 - Toronto Central Toronto C01 Toronto C02 Toronto C03 Toronto C04 Toronto C06 Toronto C07 Toronto C08 Toronto C09 Toronto C10 Toronto C11 Toronto C12 Toronto C13 Toronto C14 Toronto C15 2 2 - $1,128,000 $1,128,000 - $564,000 $564,000 - $564,000 $564,000 - 8 1 1 2 4 - 19 2 1 4 3 8 1 97% 97% - 41 41 - Toronto East Toronto E01 Toronto E02 Toronto E03 Toronto E04 Toronto E05 Toronto E06 Toronto E07 Toronto E08 Toronto E09 Toronto E10 Toronto E11 1 1 - $85,000 $85,000 - $85,000 $85,000 - $85,000 $85,000 - - 3 3 - 93% 93% - 73 73 - Page 3 July 2010 Market Watch, November 2013 20
- 21. Toronto Real Estate Board DETACHED CONDOMINIUM, NOVEMBER 2013 Industrial Leasing ALL TREB AREAS SUMMARY OF EXISTING HOME TRANSACTIONS 1 1 Sales Dollar Volume Halton Region Burlington Halton Hills Milton Oakville 9 - $3,829,900 - $425,544 - Peel Region Brampton Caledon Mississauga 4 2 2 - $1,892,900 $1,089,000 $803,900 - City of Toronto - TREB Total ! TURN PAGE FOR CITY OF TORONTO TABLES OR CLICK HERE: Average Price 1 Median Price 1 2 3 Avg. SP/LP 4 New Listings Active Listings Avg. DOM $405,000 - 7 - 30 2 2 - 98% - 64 - $473,225 $544,500 $401,950 - $474,500 $544,500 $401,950 - 3 2 1 - 9 5 2 2 - 98% 98% 97% - 21 22 20 - - - - - - - 5 - York Region Aurora E. Gwillimbury Georgina King Markham Newmarket Richmond Hill Vaughan Whitchurch-Stouffville - - - - - - - - Durham Region Ajax Brock Clarington Oshawa Pickering Scugog Uxbridge Whitby - - - - 2 2 - 2 2 - - - Dufferin County Orangeville - - - - - - - - Simcoe County Adjala-Tosorontio Bradford West Gwillimbury Essa Innisfil New Tecumseth 5 5 $1,937,000 $1,937,000 $387,400 $387,400 $355,000 $355,000 2 2 17 17 98% 98% 99 99 Page 3 July 2010 Market Watch, November 2013 21
- 22. Toronto Real Estate Board Industrial Leasing DETACHED CONDOMINIUM, NOVEMBER 2013 CITY OF TORONTO MUNICIPAL BREAKDOWN SUMMARY OF EXISTING HOME TRANSACTIONS Sales1 Dollar Volume1 Average Price1 Median Price1 New Listings2 Active Listings3 Avg. SP/LP 4 Avg. DOM5 TREB Total 9 $3,829,900 $425,544 $405,000 7 30 98% 64 City of Toronto Total - - - - - - - - Toronto West Toronto W01 Toronto W02 Toronto W03 Toronto W04 Toronto W05 Toronto W06 Toronto W07 Toronto W08 Toronto W09 Toronto W10 - - - - - - - - Toronto Central Toronto C01 Toronto C02 Toronto C03 Toronto C04 Toronto C06 Toronto C07 Toronto C08 Toronto C09 Toronto C10 Toronto C11 Toronto C12 Toronto C13 Toronto C14 Toronto C15 - - - - - - - - Toronto East Toronto E01 Toronto E02 Toronto E03 Toronto E04 Toronto E05 Toronto E06 Toronto E07 Toronto E08 Toronto E09 Toronto E10 Toronto E11 - - - - - - - - Page 3 July 2010 Market Watch, November 2013 22
- 23. Toronto Real Estate Board CO-OWNERSHIP APARTMENT, NOVEMBER 2013 Industrial Leasing ALL TREB AREAS SUMMARY OF EXISTING HOME TRANSACTIONS 1 1 Sales Dollar Volume Halton Region Burlington Halton Hills Milton Oakville 6 - $1,143,000 - $190,500 - Peel Region Brampton Caledon Mississauga - - City of Toronto 6 TREB Total ! TURN PAGE FOR CITY OF TORONTO TABLES OR CLICK HERE: Average Price 1 Median Price 1 2 3 Avg. SP/LP 4 New Listings Active Listings Avg. DOM $177,500 - 11 - 22 - 93% - 92 - - - - - - - $1,143,000 $190,500 $177,500 11 22 93% 5 92 York Region Aurora E. Gwillimbury Georgina King Markham Newmarket Richmond Hill Vaughan Whitchurch-Stouffville - - - - - - - - Durham Region Ajax Brock Clarington Oshawa Pickering Scugog Uxbridge Whitby - - - - - - - - Dufferin County Orangeville - - - - - - - - Simcoe County Adjala-Tosorontio Bradford West Gwillimbury Essa Innisfil New Tecumseth - - - - - - - - Page 3 July 2010 Market Watch, November 2013 23
- 24. Toronto Real Estate Board Industrial Leasing CO-OWNERSHIP APARTMENT, NOVEMBER 2013 CITY OF TORONTO MUNICIPAL BREAKDOWN SUMMARY OF EXISTING HOME TRANSACTIONS Sales1 Dollar Volume1 Average Price1 Median Price1 New Listings2 Active Listings3 Avg. SP/LP 4 Avg. DOM5 TREB Total 6 $1,143,000 $190,500 $177,500 11 22 93% 92 City of Toronto Total 6 $1,143,000 $190,500 $177,500 11 22 93% 92 Toronto West Toronto W01 Toronto W02 Toronto W03 Toronto W04 Toronto W05 Toronto W06 Toronto W07 Toronto W08 Toronto W09 Toronto W10 1 1 - $130,000 $130,000 - $130,000 $130,000 - $130,000 $130,000 - 4 4 - 6 6 - 100% 100% - 15 15 - Toronto Central Toronto C01 Toronto C02 Toronto C03 Toronto C04 Toronto C06 Toronto C07 Toronto C08 Toronto C09 Toronto C10 Toronto C11 Toronto C12 Toronto C13 Toronto C14 Toronto C15 5 1 1 2 1 - $1,013,000 $220,000 $148,000 $355,000 $290,000 - $202,600 $220,000 $148,000 $177,500 $290,000 - $194,000 $220,000 $148,000 $177,500 $290,000 - 7 2 5 - 16 4 1 5 2 1 2 1 92% 88% 99% 96% 88% - 108 407 17 25 65 - Toronto East Toronto E01 Toronto E02 Toronto E03 Toronto E04 Toronto E05 Toronto E06 Toronto E07 Toronto E08 Toronto E09 Toronto E10 Toronto E11 - - - - - - - - Page 3 July 2010 Market Watch, November 2013 24
- 25. Toronto Real Estate Board FOCUS ON THE MLS® HOME PRICE INDEX INDEX AND BENCHMARK PRICE, NOVEMBER 2013 Industrial TREB AREAS Leasing ALL CLICK HERE FOR MORE BACKGROUND INFORMATION ON THE MLS® HPI Index Composite Benchmark Yr./Yr. % Chg. Index Single-Family Detached Benchmark Yr./Yr. % Chg. Index Single-Family Attached Benchmark Yr./Yr. % Chg. Index Townhouse Benchmark Yr./Yr. % Chg. Index Apartment Benchmark Yr./Yr. % Chg. TREB Total 157.9 $481,700 5.69% 158.4 $589,000 6.31% 163.1 $460,800 5.91% 154.6 $338,600 5.39% 150.1 $301,500 3.16% Halton Region Burlington Halton Hills Milton Oakville 166.9 171.2 154.9 160.1 174.4 $547,500 $493,400 $451,000 $449,000 $643,400 7.19% 4.20% 6.02% 8.25% 7.19% 164.3 168.5 154.4 150.4 173.3 $609,300 $575,900 $494,000 $523,900 $718,200 6.90% 3.37% 5.97% 7.35% 7.11% 167.4 168.6 163.5 162.8 174.8 $434,500 $401,900 $402,700 $406,500 $473,100 7.17% 5.71% 7.42% 8.10% 5.81% 162.9 172.7 155.1 162.8 $322,400 $346,800 $279,600 $359,600 7.17% 7.60% 4.51% 8.10% - - - Peel Region Brampton Caledon Mississauga 151.2 144.9 145.3 156.6 $413,600 $369,600 $517,700 $437,700 4.06% 4.32% 2.90% 4.12% 152.6 145.2 146.4 162.5 $516,600 $424,400 $537,400 $605,500 4.31% 3.57% 3.24% 5.31% 153.7 146.3 155.0 162.1 $392,200 $344,600 $383,200 $443,000 4.27% 3.98% 2.38% 4.78% 156.3 141.1 161.0 $323,400 $262,100 $345,800 4.62% 5.38% 4.41% 135.1 121.8 137.5 $232,500 $190,600 $240,800 0.75% 2.35% 0.73% City of Toronto 161.8 $530,300 5.54% 165.7 $718,300 7.11% 171.8 $569,700 5.72% 159.5 $385,700 6.48% 153.7 $317,400 3.50% ! TURN PAGE FOR CITY OF TORONTO TABLES OR CLICK HERE: York Region Aurora E. Gwillimbury Georgina King Markham Newmarket Richmond Hill Vaughan Whitchurch-Stouffville 166.8 161.5 148.7 148.4 158.3 171.3 153.2 173.3 166.2 163.8 $572,400 $520,000 $480,700 $308,000 $671,100 $590,100 $451,800 $627,500 $600,800 $617,600 6.58% 6.81% 5.39% 7.38% 5.18% 6.07% 8.27% 6.78% 6.74% 5.27% 167.2 161.0 149.5 153.7 159.6 175.6 150.1 181.4 160.0 164.6 $656,900 $598,100 $491,100 $316,600 $673,400 $722,100 $505,300 $768,500 $665,800 $631,600 6.36% 7.62% 6.33% 7.71% 5.28% 6.75% 8.38% 6.58% 4.71% 5.72% 170.4 164.6 159.1 158.1 174.0 157.7 179.6 170.9 145.1 $493,600 $426,000 $336,800 $311,600 $518,200 $371,700 $544,100 $520,300 $398,600 7.17% 6.74% 5.57% 10.87% 7.08% 7.21% 8.06% 7.48% 3.64% 153.9 141.6 156.3 161.3 145.2 161.7 - $392,300 $358,700 $388,300 $325,700 $410,500 $441,800 - 3.50% 1.80% 2.83% 3.00% 4.24% 6.80% - 149.3 150.3 153.5 152.4 147.6 145.4 - $324,400 $312,300 $355,000 $256,700 $307,400 $322,700 - 3.90% 9.47% 2.61% 7.63% 3.94% 4.45% - Durham Region Ajax Brock Clarington Oshawa Pickering Scugog Uxbridge Whitby 140.1 147.2 124.5 136.7 134.2 146.2 140.2 135.6 140.5 $329,700 $363,800 $236,000 $289,200 $256,800 $395,500 $363,800 $414,600 $366,600 6.95% 7.37% 8.17% 7.30% 8.75% 6.17% 5.81% 9.80% 4.93% 139.7 147.3 125.1 133.3 133.6 148.1 144.5 137.1 141.2 $364,300 $394,500 $237,700 $320,400 $284,500 $463,300 $372,100 $424,600 $405,600 7.05% 6.43% 8.59% 6.98% 8.79% 6.47% 6.17% 10.39% 6.01% 144.3 153.1 134.5 138.3 138.6 149.5 126.7 129.5 143.6 $289,000 $329,300 $214,400 $264,100 $232,100 $348,500 $265,200 $317,800 $316,800 6.97% 6.91% 3.86% 5.17% 9.13% 5.50% 3.43% 4.69% 7.16% 130.2 133.6 149.4 115.8 139.3 131.3 $214,000 $244,200 $267,400 $154,900 $251,300 $240,700 5.77% 5.61% 9.85% 7.62% 4.82% 2.18% 132.4 129.0 134.0 133.9 134.7 130.5 $236,900 $219,000 $189,600 $160,200 $263,700 $254,600 4.75% 5.22% 7.72% 0.15% 6.48% 0.69% Dufferin County Orangeville 147.0 147.0 $336,900 $336,900 4.70% 4.70% 151.4 151.4 $345,000 $345,000 4.85% 4.85% 146.2 146.2 $274,000 $274,000 2.52% 2.52% - - - - - - Simcoe County Adjala-Tosorontio Bradford West Gwillimbury Essa Innisfil New Tecumseth 142.5 132.3 150.2 143.4 142.7 134.4 $302,800 $416,700 $373,300 $325,200 $264,400 $310,400 5.56% 4.34% 4.16% 5.05% 5.78% 5.74% 139.1 132.2 135.5 140.8 143.7 131.1 $306,800 $416,800 $415,000 $348,300 $266,700 $337,700 5.38% 4.42% 4.15% 5.00% 5.97% 5.30% 147.5 155.3 145.8 147.6 140.4 $283,200 $322,900 $248,400 $229,600 $268,600 4.83% 4.16% 4.22% 4.90% 6.04% - - - - - - Page 3 July 2010 Market Watch, November 2013 25
- 26. Toronto Real Estate Board Industrial Leasing FOCUS ON THE MLS® HOME PRICE INDEX INDEX AND BENCHMARK PRICE, NOVEMBER 2013 CITY OF TORONTO CLICK HERE FOR MORE BACKGROUND INFORMATION ON THE MLS® HPI Index Composite Benchmark Yr./Yr. % Chg. TREB Total 157.9 $481,700 City of Toronto 161.8 Toronto W01 Toronto W02 Toronto W03 Toronto W04 Toronto W05 Toronto W06 Toronto W07 Toronto W08 Toronto W09 Toronto W10 155.8 185.3 167.9 149.1 142.0 146.0 156.6 143.1 146.0 141.3 Toronto C01 Toronto C02 Toronto C03 Toronto C04 Toronto C06 Toronto C07 Toronto C08 Toronto C09 Toronto C10 Toronto C11 Toronto C12 Toronto C13 Toronto C14 Toronto C15 Toronto E01 Toronto E02 Toronto E03 Toronto E04 Toronto E05 Toronto E06 Toronto E07 Toronto E08 Toronto E09 Toronto E10 Toronto E11 Index Single-Family Detached Benchmark Yr./Yr. % Chg. 5.69% 158.4 $589,000 $530,300 5.54% 165.7 $635,800 $668,400 $433,700 $390,400 $338,100 $423,800 $667,400 $582,200 $375,200 $328,000 -2.50% 7.92% 7.35% 9.55% 5.42% 1.11% 6.97% 3.92% 6.34% 4.43% 156.6 181.4 172.5 156.8 152.8 171.7 163.3 152.3 158.9 153.2 181.6 173.1 173.8 156.5 167.4 160.2 163.1 127.2 178.9 153.3 150.4 152.3 169.1 159.4 $450,400 $821,900 $894,500 $969,600 $662,400 $550,200 $419,900 $944,600 $697,900 $549,300 $1,288,900 $561,900 $574,700 $532,900 4.31% 4.66% 5.08% 2.83% 6.90% 3.62% 2.32% -0.78% 4.19% 16.40% 2.10% 6.21% 3.36% 5.98% 187.8 179.4 159.2 164.7 153.5 174.4 166.1 155.4 152.4 158.2 149.1 $583,300 $667,300 $490,400 $413,500 $410,500 $492,800 $409,500 $380,900 $368,000 $447,900 $328,700 5.80% 9.79% 4.46% 10.54% 7.57% 7.85% 11.10% 8.60% 10.43% 10.09% 5.82% Index Single-Family Attached Benchmark Yr./Yr. % Chg. 6.31% 163.1 $460,800 $718,300 7.11% 171.8 $807,100 $744,600 $469,100 $494,800 $509,400 $545,000 $705,800 $796,600 $594,500 $450,800 -0.13% 6.96% 9.73% 8.06% 7.76% 6.18% 6.25% 2.70% 4.33% 6.24% 164.4 209.5 171.3 149.9 142.2 143.5 148.5 156.3 143.9 151.1 186.1 156.3 171.3 163.0 170.8 178.7 146.2 116.1 167.4 153.5 141.7 162.9 188.9 176.6 $656,900 $1,238,900 $1,032,400 $1,139,500 $731,100 $818,100 $454,400 $1,458,400 $1,027,300 $1,027,700 $1,522,900 $872,800 $1,024,900 $827,800 -2.36% -0.32% 5.55% 5.16% 7.76% 8.11% -4.57% -3.65% 6.35% 4.85% 0.14% 7.38% 9.95% 8.28% 184.2 168.4 160.6 169.4 173.2 175.7 179.6 168.0 163.6 159.9 168.9 $620,600 $741,600 $539,500 $500,200 $611,600 $502,200 $587,800 $524,500 $465,600 $511,900 $469,100 5.02% 6.38% 4.02% 12.93% 12.39% 8.06% 16.25% 8.74% 12.59% 9.37% 10.32% Index Townhouse Benchmark Yr./Yr. % Chg. 5.91% 154.6 $338,600 $569,700 5.72% 159.5 $634,300 $641,800 $438,900 $436,500 $415,900 $435,100 $608,900 $587,100 $407,300 $410,600 -1.20% 8.72% 5.42% 6.01% 6.04% -3.88% -0.07% 1.10% 3.75% 5.59% 203.3 139.0 137.9 148.0 162.6 137.3 145.6 137.9 131.5 195.7 174.4 178.4 161.2 146.2 157.5 165.2 135.9 167.4 175.2 168.4 152.1 188.9 162.6 $679,000 $917,700 $660,400 $770,700 $537,700 $559,800 $683,800 $1,105,900 $826,800 $768,700 $727,600 $488,000 $921,500 $530,600 1.66% 0.58% 5.00% 5.70% -2.34% 2.74% 5.36% -1.09% 1.64% 8.01% 9.92% 3.68% 8.50% 7.75% 194.4 187.5 161.0 163.3 167.9 180.4 172.9 153.8 152.2 156.7 160.7 $609,900 $625,400 $524,300 $396,200 $462,800 $426,700 $451,900 $393,600 $373,500 $407,600 $364,600 7.70% 10.16% 5.44% 9.16% 9.74% 8.67% 12.27% 4.48% 9.10% 6.96% 11.67% Page 3 Index Apartment Benchmark Yr./Yr. % Chg. 5.39% 150.1 $301,500 3.16% $385,700 6.48% 153.7 $317,400 3.50% $418,600 $383,200 $335,500 $243,600 $479,100 $504,700 $355,900 $349,800 $236,900 -3.65% 5.46% -2.41% 14.64% 5.17% 7.52% 5.89% -5.29% 19.87% 136.8 128.9 128.8 132.0 122.8 123.2 109.8 131.3 126.5 124.0 $319,200 $535,800 $238,900 $194,500 $161,300 $304,700 $445,200 $264,300 $162,200 $189,300 -3.18% 12.38% 2.55% 14.98% -3.76% -3.75% 6.09% 5.46% 11.55% -2.29% 170.8 167.7 153.6 145.5 136.7 178.0 154.5 208.2 118.9 160.2 151.9 218.0 171.9 $512,600 $784,200 $573,800 $397,000 $401,300 $539,800 $797,500 $477,400 $189,600 $542,700 $432,600 $736,600 $423,500 4.53% 5.14% 6.96% 12.44% 11.59% 8.67% 3.07% 0.82% 10.91% 18.23% 14.64% 9.00% 6.70% 179.6 176.4 171.5 127.9 165.3 148.6 163.3 135.3 183.9 153.0 172.5 140.7 158.1 138.5 $373,800 $491,900 $453,100 $304,100 $365,500 $350,000 $360,200 $448,300 $440,600 $217,800 $542,600 $278,400 $397,600 $323,700 4.85% 9.36% 1.24% -9.36% 6.37% -1.33% 1.94% 1.50% 4.97% 30.21% 2.01% 4.15% 0.13% 3.28% 202.6 159.1 160.9 154.6 159.3 156.2 146.8 162.9 118.3 $409,700 $531,900 $347,700 $336,100 $344,500 $316,200 $270,500 $285,300 $232,500 6.80% 3.85% 3.61% 7.51% 4.73% 4.97% 12.66% 17.19% 1.98% 176.0 170.0 131.1 166.3 130.6 154.5 149.2 128.6 140.3 122.4 121.5 $417,500 $449,900 $196,100 $251,900 $256,600 $340,700 $255,500 $205,300 $263,100 $197,300 $181,300 -1.51% 5.26% 0.46% 9.41% 0.08% 4.32% 8.91% 8.89% 6.94% 20.59% -5.89% July 2010 Market Watch, November 2013 26
- 27. Toronto Real Estate Board HISTORIC ANNUAL STATISTICS1,6,7 YEAR SALES AVERAGE PRICE 2002 2003 2004 2005 2006 2007 2008 2009 2010 2011 2012 74,759 78,898 83,501 84,145 83,084 93,193 74,552 87,308 85,545 89,096 85,497 $275,231 $293,067 $315,231 $335,907 $351,941 $376,236 $379,347 $395,460 $431,276 $465,014 $497,131 *For historic annual sales and average price data over a longer time frame go to: http://www.torontorealestateboard.com/market_news/market_watch/histori c_stats/pdf/TREB_historic_statistics.pdf 2012 MONTHLY STATISTICS1,7 January February March April May June July August September October November December 4,431 6,809 9,383 10,021 10,542 9,129 7,338 6,249 5,687 6,713 5,613 3,582 $462,701 $500,249 $500,892 $515,888 $514,464 $507,342 $475,523 $477,170 $501,326 $502,127 $484,208 $477,756 Annual 85,497 $497,131 2013 MONTHLY STATISTICS1,7 January February March April May June July August September October November December 4,229 5,613 7,538 9,535 9,946 8,822 8,369 7,394 7,263 7,964 6,391 - $482,080 $509,396 $517,223 $524,870 $540,544 $529,616 $512,298 $501,794 $533,232 $539,415 $538,881 - Year-to-Date 83,064 $523,216 Copyright® 2013 Toronto Real Estate Board NOTES 1 Sales, dollar volume, average sale prices and median sale prices are based on firm transactions entered into the TorontoMLS® system between the first and last day of the month/period being reported. 2 New listings entered into the TorontoMLS® system between the first and last day of the month/period being reported. 3 Active listings at the end of the last day of the month/period being reported. 4 Ratio of the average selling price to the average listing price for firm transactions entered into the TorontoMLS® system between the first and last day of the month/period being reported. 5 Average number of days on the market for firm transactions entered into the TorontoMLS® system between the first and last day of the month/period being reported. 6 Due to past changes to TREB's service area, caution should be exercised when making historical comparisons. 7 Past monthly and year-to-date figures are revised on a monthly basis. 8 Page 3 SNLR = Sales-to-New Listings Ratio. Calculated using a 12-month moving average (sales/new listings). 9 Mos. Inv. = Months of Inventory. Calculated using a 12-month moving average (active listings/sales). July 2010 Market Watch, November 2013 27