SlideShare a Scribd company logo
1 of 33
Download to read offline
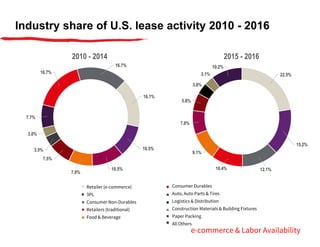
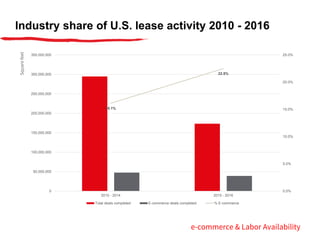
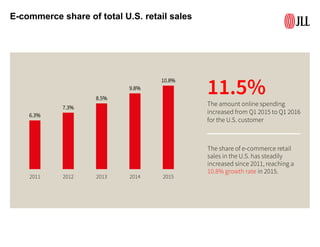
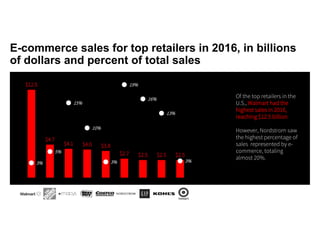
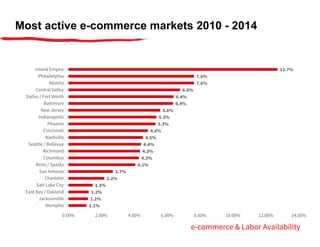
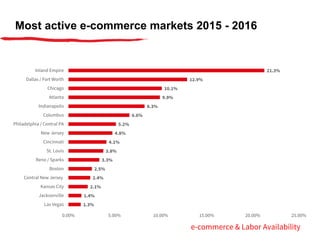
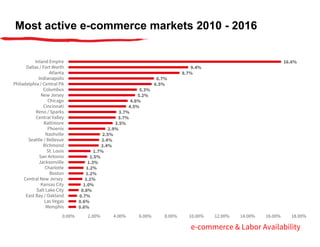
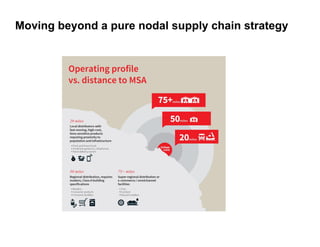
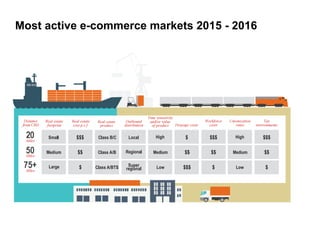
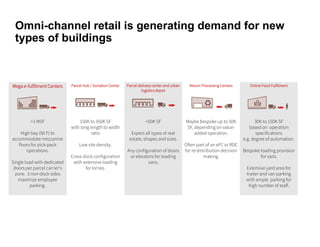
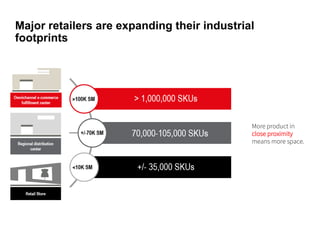
e-commerce Growth
March 2017
Lee Allen
Managing Director
lee.allen@am.jll.com
+1 843 566 2064
Industry share of U.S. lease activity 2010 - 2016
16.7%
16.7%
16.1%
10.5%
10.5%
7.9%
7.5%
3.5%
3.0%
7.7%
2010 - 2014
22.5%
15.2%
12.1%10.4%
9.1%
7.8%
5.8%
3.8%
3.1%
10.2%
2015 - 2016
Retailer (e-commerce)
3PL
Consumer Non-Durables
Retailers (traditional)
Food & Beverage
Consumer Durables
Auto, Auto Parts & Tires
Logistics & Distribution
Construction Materials & Building Fixtures
Paper Packing
All Others
e-commerce & Labor Availability
Industry share of U.S. lease activity 2010 - 2016
16.1%
22.5%
0.0%
5.0%
10.0%
15.0%
20.0%
25.0%
0
50,000,000
100,000,000
150,000,000
200,000,000
250,000,000
300,000,000
350,000,000
2010 - 2014 2015 - 2016
Total deals completed E-commerce deals completed % E-commerce
Squarefeet
e-commerce & Labor Availability
E-commerce share of total U.S. retail sales
6.3%
7.3%
8.5%
9.8%
10.8%
2011 2012 2013 2014 2015
The share of e-commerce retail
sales in the U.S. has steadily
increased since 2011, reaching a
10.8% growth rate in 2015.
11.5%
The amount online spending
increased from Q1 2015 to Q1 2016
for the U.S. customer
E-commerce sales for top retailers in 2016, in billions
of dollars and percent of total sales
$12.5
$4.7
$4.1 $4.0 $3.8
$2.7 $2.5 $2.5 $2.5
3%
5%
15%
10%
3%
19%
16%
13%
3%
0
0.02
0.04
0.06
0.08
0.1
0.12
0.14
0.16
0.18
0.2
0
2
4
6
8
10
12
14
Of the top retailers in the
U.S., Walmart had the
highest sales in 2016,
reaching $12.5 billion.
However, Nordstrom saw
the highest percentage of
sales represented by e-
commerce, totaling
almost 20%.
Research
online and in
store, buy
online
16%
Search and buy
online
42%
Search and
buy in store…
Research
online and in
store, buy in
store
22%
Research online and in store, buy online
Search and buy online
How purchases were made in 2016
A total of 58% of shoppers
made purchases online in
2016, a shift away from in
store purchases.
Survey of 5,000 shoppers in a Wall Street Journal study
U.S. shoppers buying groceries online, by age group
Every age group saw an
18% two-year increase in
online grocery shopping,
illustrating a significant
increase in all consumers’
level of comfort with
stepping out of the
traditional grocery store.
7%
11%
5%
7% 6% 7%
25%
37%
34%
28%
32%
25%
Ages 18-24 25-34 35-44 45-54 55-64 65 and
older
2014
2016
12.7%
7.6%
7.6%
6.8%
6.4%
6.4%
5.6%
5.3%
5.3%
4.8%
4.5%
4.4%
4.3%
4.3%
4.1%
2.7%
2.2%
1.5%
1.2%
1.2%
1.1%
Inland Empire
Philadelphia
Atlanta
Central Valley
Dallas / Fort Worth
Baltimore
New Jersey
Indianapolis
Phoenix
Cincinnati
Nashville
Seattle / Bellevue
Richmond
Columbus
Reno / Sparks
San Antonio
Charlotte
Salt Lake City
East Bay / Oakland
Jacksonville
Memphis
0.00% 2.00% 4.00% 6.00% 8.00% 10.00% 12.00% 14.00%
Most active e-commerce markets 2010 - 2014
e-commerce & Labor Availability
21.3%
12.9%
10.1%
9.9%
8.3%
6.6%
5.2%
4.8%
4.1%
3.8%
3.3%
2.5%
2.4%
2.1%
1.4%
1.3%
Inland Empire
Dallas / Fort Worth
Chicago
Atlanta
Indianapolis
Columbus
Philadelphia / Central PA
New Jersey
Cincinnati
St. Louis
Reno / Sparks
Boston
Central New Jersey
Kansas City
Jacksonville
Las Vegas
0.00% 5.00% 10.00% 15.00% 20.00% 25.00%
Most active e-commerce markets 2015 - 2016
e-commerce & Labor Availability
Most active e-commerce markets 2010 - 2016
16.6%
9.4%
8.7%
6.7%
6.5%
5.3%
5.2%
4.6%
4.5%
3.7%
3.7%
3.5%
2.9%
2.5%
2.4%
2.4%
1.7%
1.5%
1.3%
1.2%
1.2%
1.1%
1.0%
0.8%
0.7%
0.6%
0.6%
Inland Empire
Dallas / Fort Worth
Atlanta
Indianapolis
Philadelphia / Central PA
Columbus
New Jersey
Chicago
Cincinnati
Reno / Sparks
Central Valley
Baltimore
Phoenix
Nashville
Seattle / Bellevue
Richmond
St. Louis
San Antonio
Jacksonville
Charlotte
Boston
Central New Jersey
Kansas City
Salt Lake City
East Bay / Oakland
Las Vegas
Memphis
0.00% 2.00% 4.00% 6.00% 8.00% 10.00% 12.00% 14.00% 16.00% 18.00%
e-commerce & Labor Availability
So much innovation
in the last 2-3 years
In the fourth industrial revolution, technology
giants have risen to the top
Sources: Yahoo Finance; Forbes; JLL Research
$0 $100 $200 $300 $400 $500 $600
Royal Dutch Shell
BP
Citigroup
Microsoft
General Electric
ExxonMobil
Facebook
ExxonMobil
Amazon
Microsoft
Alphabet
Apple
Market Capitalization, Billions
2006
2016
Those that do not adapt quickly will be disrupted
2004 2005 2006 2007 2008 2009 2010
6.0
Physical rental
0.5
2.5
Digital rental
Netflix vs. Blockbuster (2004-2010)
Revenues, USD billions
SOURCE: McKinsey
Moving beyond a pure nodal supply chain strategy
Different e-commerce strategies
Regional distribution
Dedicated e-commerce
‘Ship-from-store’
Outsourced ‘last mile’
‘Click & collect’
Drop shipping
Dedicated in-store pick-up
Innovative adaptive re-use
More than real estate…
Transportation, inventory and labor account for 80% of operating costs
A proven, proprietary* process for comparing real
estate alternatives based on transportation and
operating cost considerations.
Utilizes in-house supply chain modeling tools and
experts to support our clients’ decision making.
SM
Supply Chain Select SM is a proprietary service marked
offering from JLL.
Most active e-commerce markets 2015 - 2016
Omni-channel retail is generating demand for new
types of buildings
Mega e-fulfilment Centers Parcel Hub / Sortation Center Parcel delivery center and urban
logistics depot
Return Processing Centers Online Food Fulfilment
>1 MSF
High bay (50 F) to
accommodate mezzanine
floors for pick-pack
operations.
Single load with dedicated
doors per parcel carrier’s
zone. 3 non-dock sides
maximize employee
parking.
150K to 350K SF
with long length to width
ratio
Low site density.
Cross-dock configuration
with extensive loading
for lorries.
<50K SF
Expect all types of real
estate, shapes and sizes.
Any configuration of doors
or elevators for loading
vans.
Maybe bespoke up to 50K
SF, depending on value-
added operation.
Often part of an eFC or RDC
for re-distribution decision
making.
30K to 150K SF
based on operation
specifications
e.g. degree of automation.
Bespoke loading provision
for vans.
Extensive yard area for
trailer and van parking
with ample parking for
high number of staff.
Major retailers are expanding their industrial
footprints
More product in
close proximity
means more space.
April, 2017
JLL Research
Q1 2017 U.S. Industrial
Market Overview
U.S. economic
performance
indicators
March 2017 U.S. labor market highlights
After two strong months, March disappoints
• January and February both exceeded the 200,000-job threshold, while March fell well below expectations with
only 98,000 net new jobs. A contraction in retail trade and slowdowns in all major sectors with the exception of
professional and business services (PBS) were the primary drivers of this, compounded by volatility due to
tightening and employment growth continuing to exceed the rate of labor-force expansion. Although March’s
monthly growth did not meet consensus figures, the broader trend remains positive and future months will dictate
whether this is an anomalous month or a broader shift in growth rates.
1
Unemployment drops, but slack is beginning to run out
• Counter to job growth, unemployment metrics improved once again, with the unemployment rate dropping by
another 20 basis points to a cyclical low of 4.5 percent. Total unemployment fell below the 9.0-percent threshold
for the first time since 2007 and now stands at 8.9 percent. With unemployment already low, the slowing rate of
labor-force expansion (0.5 percent annually compared to total non-farm job growth of 1.5 percent) will present a
challenge for employers seeking to increase headcounts, particularly as unemployment for bachelor’s-degree
holders remains steady at 2.5 percent.
2
Confidence is up even as inflation ramps up
• The consumer confidence index spiked in March to 125.6 points, its highest figure since 2000. Business
confidence metrics have also showed optimism, indicating further economic growth ahead. The acceleration in
inflation to 2.7 percent – now at the same rate as wage growth – may begin to affect consumer spending,
however, but tightening labor-market conditions will likely push wages up further.
3
Source: JLL Research, Bureau of Labor Statistics
U.S. economy
March 2017 U.S. labor market at a glance
+98,000
(78 consecutive months
of growth)
1-month net change
+2,185,000
(+1.5% y-o-y)
12-month change
+795,000
10-year average annual
growth
4.5%
Unemployment rate
5,626,000
(-1.5% y-o-y)
Job openings
-50bp
12-month change in
unemployment
63.0%
Labor force participation
rate
5,440,000
(+6.3% y-o-y)
Hires
3,220,000
(+11.3% y-o-y)
Quits
Source: JLL Research, Bureau of Labor Statistics
U.S. economy
After two strong months, March disappoints
After a strong start to 2017, March saw only 98,000 net new jobs, while downward
revisions hit Jan. and Feb.
360,000
226,000
243,000
96,000
110,000
88,000
106,000
122,000
221,000
183,000
164,000
196,000
360,000
226,000
243,000
96,000
110,000
88,000
160,000
150,000
161,000
225,000
203,000
214,000
197,000
280,000
141,000
203,000
199,000
201,000
149,000
202,000
164,000
237,000
274,000
84,000
166,000
188,000
225,000
330,000
236,000
286,000
249,000
213,000
250,000
221,000
423,000
329,000
221,000
265,000
84,000
251,000
273,000
228,000
277,000
150,000
149,000
295,000
280,000
262,000
168,000
233,000
186,000
277,000
24,000
271,000
252,000
176,000
208,000
135,000
164,000
155,000
216,000
219,000
98,000
0
50,000
100,000
150,000
200,000
250,000
300,000
350,000
400,000
450,000
2011 2012 2013 2014 2015 2016 2017
1-monthnetchange
Source: JLL Research, Bureau of Labor Statistics
U.S. economy
Unemployment drops, but slack is beginning to
run out
Unemployment fell to its lowest rate this cycle (4.5 percent) on the back of further labor-
market tightening
Source: JLL Research, Bureau of Labor Statistics
0%
2%
4%
6%
8%
10%
12%
-1,000
-800
-600
-400
-200
0
200
400
600
Unemploymentrate(%)
1-monthnetchange(thousands)
1-month net change Unemployment rate
U.S. economy
Confidence is up even as inflation ramps up
Consumer confidence is soaring even as inflation rises and now strongly exceed their
previous peak
Source: JLL Research, Conference Board
0
20
40
60
80
100
120
140
Consumerconfidenceindex
U.S. economy
U.S. industrial
leasing
Industrial observations
2017 set to be another solid year for construction
• The construction pipeline continues to grow, led by a significant increase (29 percent from the fourth quarter) of
construction activity of build-to-suit properties.
• While the speculative pipeline remains robust, owner-user and BTS projects combined contributed 28 percent to
the “new-groundbreakings. Preleasing rates for speculatively-built buildings increased by 320 bps to nearly 27
percent, a sign of continued healthy demand from tenants.
1
Logistics & distribution and 3PL sectors dominate leasing
• Responding to healthy consumer spending and growing e-commerce sales, the combined logistics & distribution
and 3PL sectors committed to 24 percent of the total leasing activity. Inland Empire, Atlanta, Los Angeles and
Chicago are the top hubs of 3PL leasing activity.
• 68 percent of ‘big-box’ leasing signed at new construction buildings (built in last 3 years)
2
Total net absorption continues to outpace new deliveries.
• Philadelphia alone absorbed nearly 8.2 million square feet, followed by Dallas and Atlanta. Those three markets
contributed to 34 percent of U.S. absorption gains.
• Vacancy rates fell in nearly three quarters of U.S. markets, causing overall U.S. vacancy to decline another 30
basis points. This is despite a steady flow of new construction in most markets.
3
U.S. leasing
2017 set to be another solid year for construction
New deliveries on track to cross the 200 m.s.f. mark
Source: JLL Research U.S. leasing
0
50
100
150
200
250
2013 2014 2015 2016 Q1 2017
Expected 2017 completions
millionssquarefeet
22.0%
6.6%
71.5%
What is the pace of construction?
While the speculative pipeline remains robust, owner-user and BTS projects combined
contributed 28 percent to the “new-groundbreakings”
Source: JLL Research U.S. leasing
BTS Owner-user Spec
17.5%
25.4%
36.3%
43.2%
24.4%
26.9%
0%
5%
10%
15%
20%
25%
30%
35%
40%
45%
50%
Q4 15 Q1 16 Q2 16 Q3 16 Q4 16 Q1 17
Breakdown of new-groundbreakings Spec pre-leasing rates of new deliveries
Logistics & distribution and 3PL sectors
dominate leasing
Responding to healthy consumer spending and growing e-commerce sales, the combined
logistics & distribution and 3PL sectors committed to 24 percent of the total leasing
activity
Source: JLL Research U.S. leasing
Total leasing activity
3PL and Logistics Distribution Other sectors
24%
Hard to find,
existing ‘big-box’
space
• 68 percent of ‘big-
box’ leasing signed
at new construction
buildings (built in
last 3 years)
Total net absorption continues to outpace
new deliveries
Philadelphia, Dallas and Atlanta alone contributed to 34 percent of U.S. absorption
gains
Source: JLL Research U.S. leasing
0.0%
2.0%
4.0%
6.0%
8.0%
10.0%
12.0%
-150
-100
-50
0
50
100
150
200
250
300
2007 2008 2009 2010 2011 2012 2013 2014 2015 2016 YTD 2017
Nationalvacancyrate(in%)
Netabsorption(inmillionsofs.f.)
Q1 Q2 Q3 Q4 Total vacancy
5.3%
Thank you
© 2017 Jones Lang LaSalle IP, Inc. All rights reserved. The information contained in this document is proprietary to JLL and shall be used solely for the purposes of evaluating this proposal. All such
documentation and information remains the property of JLL and shall be kept confidential. Reproduction of any part of this document is authorized only to the extent necessary for its evaluation. It is not
to be shown to any third party without the prior written authorization of JLL. All information contained herein is from sources deemed reliable; however, no representation or warranty is made as to the
accuracy thereof.
Lee Allen
Managing Director
lee.allen@am.jll.com
+1 843 566 2064

More Related Content

What's hot

Northern Ireland new car sales
Northern Ireland new car salesNorthern Ireland new car sales
Northern Ireland new car salesRichard Ramsey
 
Supply Chain Metrics That Matter in a Market-Driven World
Supply Chain Metrics That Matter in a Market-Driven WorldSupply Chain Metrics That Matter in a Market-Driven World
Supply Chain Metrics That Matter in a Market-Driven WorldLora Cecere
 
What's on the horizon for the U.S. Skyline?
What's on the horizon for the U.S. Skyline?What's on the horizon for the U.S. Skyline?
What's on the horizon for the U.S. Skyline?JLL
 
National Employment Situation: January 2018
National Employment Situation: January 2018National Employment Situation: January 2018
National Employment Situation: January 2018DavidDominy1
 
February 2018 U.S. employment update and outlook
February 2018 U.S. employment update and outlookFebruary 2018 U.S. employment update and outlook
February 2018 U.S. employment update and outlookJLL
 
April 2017 U.S. employment update and outlook
April 2017 U.S. employment update and outlookApril 2017 U.S. employment update and outlook
April 2017 U.S. employment update and outlookJLL
 
Minneapolis–St. Paul Employment Update | September 2016
Minneapolis–St. Paul Employment Update | September 2016Minneapolis–St. Paul Employment Update | September 2016
Minneapolis–St. Paul Employment Update | September 2016Carolyn Bates
 
June 2017 U.S. employment update and outlook
June 2017 U.S. employment update and outlookJune 2017 U.S. employment update and outlook
June 2017 U.S. employment update and outlookJLL
 
May 2017 U.S. employment update and outlook
May 2017 U.S. employment update and outlookMay 2017 U.S. employment update and outlook
May 2017 U.S. employment update and outlookJLL
 
October 2016 U.S. employment update and outlook
October 2016 U.S. employment update and outlookOctober 2016 U.S. employment update and outlook
October 2016 U.S. employment update and outlookJLL
 
November 2016 U.S. employment update and outlook
November 2016 U.S. employment update and outlookNovember 2016 U.S. employment update and outlook
November 2016 U.S. employment update and outlookJLL
 
May 2018 U.S. employment update and outlook
May 2018 U.S. employment update and outlookMay 2018 U.S. employment update and outlook
May 2018 U.S. employment update and outlookJLL
 
Minneapolis–St. Employment Update | March 2016
Minneapolis–St. Employment Update | March 2016Minneapolis–St. Employment Update | March 2016
Minneapolis–St. Employment Update | March 2016Carolyn Bates
 
Philadelphia Fed Survey Reports Manufacturing Activity Increased in March
Philadelphia Fed Survey Reports Manufacturing Activity Increased in MarchPhiladelphia Fed Survey Reports Manufacturing Activity Increased in March
Philadelphia Fed Survey Reports Manufacturing Activity Increased in Marchgary9hendricks6
 
March 2017 U.S. employment update and outlook
March 2017 U.S. employment update and outlookMarch 2017 U.S. employment update and outlook
March 2017 U.S. employment update and outlookJLL
 
March 2018 U.S. employment update and outlook
March 2018 U.S. employment update and outlookMarch 2018 U.S. employment update and outlook
March 2018 U.S. employment update and outlookJLL
 
St louis Office Employment Update
St  louis Office Employment UpdateSt  louis Office Employment Update
St louis Office Employment UpdateBlaise Tomazic
 
US employment rate data and trends – January 2017
US employment rate data and trends – January 2017US employment rate data and trends – January 2017
US employment rate data and trends – January 2017JLL
 
US employment rate data and trends – December 2016
US employment rate data and trends – December 2016 US employment rate data and trends – December 2016
US employment rate data and trends – December 2016 JLL
 

What's hot (20)

Northern Ireland new car sales
Northern Ireland new car salesNorthern Ireland new car sales
Northern Ireland new car sales
 
Supply Chain Metrics That Matter in a Market-Driven World
Supply Chain Metrics That Matter in a Market-Driven WorldSupply Chain Metrics That Matter in a Market-Driven World
Supply Chain Metrics That Matter in a Market-Driven World
 
What's on the horizon for the U.S. Skyline?
What's on the horizon for the U.S. Skyline?What's on the horizon for the U.S. Skyline?
What's on the horizon for the U.S. Skyline?
 
National Employment Situation: January 2018
National Employment Situation: January 2018National Employment Situation: January 2018
National Employment Situation: January 2018
 
February 2018 U.S. employment update and outlook
February 2018 U.S. employment update and outlookFebruary 2018 U.S. employment update and outlook
February 2018 U.S. employment update and outlook
 
April 2017 U.S. employment update and outlook
April 2017 U.S. employment update and outlookApril 2017 U.S. employment update and outlook
April 2017 U.S. employment update and outlook
 
Minneapolis–St. Paul Employment Update | September 2016
Minneapolis–St. Paul Employment Update | September 2016Minneapolis–St. Paul Employment Update | September 2016
Minneapolis–St. Paul Employment Update | September 2016
 
Charleston Commercial Market Forecast | Lawrence Yun Economic Update
Charleston Commercial Market Forecast | Lawrence Yun Economic UpdateCharleston Commercial Market Forecast | Lawrence Yun Economic Update
Charleston Commercial Market Forecast | Lawrence Yun Economic Update
 
June 2017 U.S. employment update and outlook
June 2017 U.S. employment update and outlookJune 2017 U.S. employment update and outlook
June 2017 U.S. employment update and outlook
 
May 2017 U.S. employment update and outlook
May 2017 U.S. employment update and outlookMay 2017 U.S. employment update and outlook
May 2017 U.S. employment update and outlook
 
October 2016 U.S. employment update and outlook
October 2016 U.S. employment update and outlookOctober 2016 U.S. employment update and outlook
October 2016 U.S. employment update and outlook
 
November 2016 U.S. employment update and outlook
November 2016 U.S. employment update and outlookNovember 2016 U.S. employment update and outlook
November 2016 U.S. employment update and outlook
 
May 2018 U.S. employment update and outlook
May 2018 U.S. employment update and outlookMay 2018 U.S. employment update and outlook
May 2018 U.S. employment update and outlook
 
Minneapolis–St. Employment Update | March 2016
Minneapolis–St. Employment Update | March 2016Minneapolis–St. Employment Update | March 2016
Minneapolis–St. Employment Update | March 2016
 
Philadelphia Fed Survey Reports Manufacturing Activity Increased in March
Philadelphia Fed Survey Reports Manufacturing Activity Increased in MarchPhiladelphia Fed Survey Reports Manufacturing Activity Increased in March
Philadelphia Fed Survey Reports Manufacturing Activity Increased in March
 
March 2017 U.S. employment update and outlook
March 2017 U.S. employment update and outlookMarch 2017 U.S. employment update and outlook
March 2017 U.S. employment update and outlook
 
March 2018 U.S. employment update and outlook
March 2018 U.S. employment update and outlookMarch 2018 U.S. employment update and outlook
March 2018 U.S. employment update and outlook
 
St louis Office Employment Update
St  louis Office Employment UpdateSt  louis Office Employment Update
St louis Office Employment Update
 
US employment rate data and trends – January 2017
US employment rate data and trends – January 2017US employment rate data and trends – January 2017
US employment rate data and trends – January 2017
 
US employment rate data and trends – December 2016
US employment rate data and trends – December 2016 US employment rate data and trends – December 2016
US employment rate data and trends – December 2016
 

Similar to Market Update - Allen

Bartlett and west feb 2011 - ar
Bartlett and west   feb 2011 - arBartlett and west   feb 2011 - ar
Bartlett and west feb 2011 - arJustin Main
 
April 2016 U.S. employment update and outlook
April 2016 U.S. employment update and outlookApril 2016 U.S. employment update and outlook
April 2016 U.S. employment update and outlookJLL
 
U.S. employment update and outlook: December 2014
U.S. employment update and outlook: December 2014U.S. employment update and outlook: December 2014
U.S. employment update and outlook: December 2014JLL
 
Anika Khan: Commercial Real Estate and Construction, Turning the Corner
Anika Khan: Commercial Real Estate and Construction, Turning the CornerAnika Khan: Commercial Real Estate and Construction, Turning the Corner
Anika Khan: Commercial Real Estate and Construction, Turning the CornerNikki Wagner
 
July Snapshot: Employment Trends & Establishment Growth in Metro Atlanta
July Snapshot: Employment Trends & Establishment Growth in Metro Atlanta July Snapshot: Employment Trends & Establishment Growth in Metro Atlanta
July Snapshot: Employment Trends & Establishment Growth in Metro Atlanta ARCResearch
 
Investor roadshow presentation may 2017 final
Investor roadshow presentation  may 2017 finalInvestor roadshow presentation  may 2017 final
Investor roadshow presentation may 2017 finalTrueBlueInc
 
April 2015 U.S. employment update and outlook
April 2015 U.S. employment update and outlookApril 2015 U.S. employment update and outlook
April 2015 U.S. employment update and outlookJLL
 
U.S. employment update and outlook: October 2014
U.S. employment update and outlook: October 2014U.S. employment update and outlook: October 2014
U.S. employment update and outlook: October 2014JLL
 
June 2015 U.S. employment update and outlook
June 2015 U.S. employment update and outlookJune 2015 U.S. employment update and outlook
June 2015 U.S. employment update and outlookJLL
 
Investor roadshow presentation february 2017 final
Investor roadshow presentation   february 2017 finalInvestor roadshow presentation   february 2017 final
Investor roadshow presentation february 2017 finalTrueBlueInc
 
Marketing Website Performance Scorecard PowerPoint Presentation Slides
Marketing Website Performance Scorecard PowerPoint Presentation SlidesMarketing Website Performance Scorecard PowerPoint Presentation Slides
Marketing Website Performance Scorecard PowerPoint Presentation SlidesSlideTeam
 
June 2018 U.S. employment update and outlook
June 2018 U.S. employment update and outlookJune 2018 U.S. employment update and outlook
June 2018 U.S. employment update and outlookJLL
 
Investor roadshow presentation july 2017 final (1)
Investor roadshow presentation   july 2017 final (1)Investor roadshow presentation   july 2017 final (1)
Investor roadshow presentation july 2017 final (1)TrueBlueInc
 
March 2016 U.S. employment update and outlook
March 2016 U.S. employment update and outlookMarch 2016 U.S. employment update and outlook
March 2016 U.S. employment update and outlookJLL
 
Minneapolis–St. Paul Employment Update | July 2016
Minneapolis–St. Paul Employment Update | July 2016Minneapolis–St. Paul Employment Update | July 2016
Minneapolis–St. Paul Employment Update | July 2016Carolyn Bates
 
Net Lease Market Research Report Published by The Boulder Group
Net Lease Market Research Report  Published by The Boulder Group Net Lease Market Research Report  Published by The Boulder Group
Net Lease Market Research Report Published by The Boulder Group The Boulder Group
 
November 2015 U.S. employment update and outlook
November 2015 U.S. employment update and outlookNovember 2015 U.S. employment update and outlook
November 2015 U.S. employment update and outlookJLL
 
January 2016 U.S. employment update and outlook
January 2016 U.S. employment update and outlookJanuary 2016 U.S. employment update and outlook
January 2016 U.S. employment update and outlookJLL
 
September 2017 U.S. employment update and outlook
September 2017 U.S. employment update and outlookSeptember 2017 U.S. employment update and outlook
September 2017 U.S. employment update and outlookJLL
 

Similar to Market Update - Allen (20)

Bartlett and west feb 2011 - ar
Bartlett and west   feb 2011 - arBartlett and west   feb 2011 - ar
Bartlett and west feb 2011 - ar
 
April 2016 U.S. employment update and outlook
April 2016 U.S. employment update and outlookApril 2016 U.S. employment update and outlook
April 2016 U.S. employment update and outlook
 
U.S. employment update and outlook: December 2014
U.S. employment update and outlook: December 2014U.S. employment update and outlook: December 2014
U.S. employment update and outlook: December 2014
 
Anika Khan: Commercial Real Estate and Construction, Turning the Corner
Anika Khan: Commercial Real Estate and Construction, Turning the CornerAnika Khan: Commercial Real Estate and Construction, Turning the Corner
Anika Khan: Commercial Real Estate and Construction, Turning the Corner
 
July Snapshot: Employment Trends & Establishment Growth in Metro Atlanta
July Snapshot: Employment Trends & Establishment Growth in Metro Atlanta July Snapshot: Employment Trends & Establishment Growth in Metro Atlanta
July Snapshot: Employment Trends & Establishment Growth in Metro Atlanta
 
Investor roadshow presentation may 2017 final
Investor roadshow presentation  may 2017 finalInvestor roadshow presentation  may 2017 final
Investor roadshow presentation may 2017 final
 
April 2015 U.S. employment update and outlook
April 2015 U.S. employment update and outlookApril 2015 U.S. employment update and outlook
April 2015 U.S. employment update and outlook
 
U.S. employment update and outlook: October 2014
U.S. employment update and outlook: October 2014U.S. employment update and outlook: October 2014
U.S. employment update and outlook: October 2014
 
June 2015 U.S. employment update and outlook
June 2015 U.S. employment update and outlookJune 2015 U.S. employment update and outlook
June 2015 U.S. employment update and outlook
 
Investor roadshow presentation february 2017 final
Investor roadshow presentation   february 2017 finalInvestor roadshow presentation   february 2017 final
Investor roadshow presentation february 2017 final
 
Marketing Website Performance Scorecard PowerPoint Presentation Slides
Marketing Website Performance Scorecard PowerPoint Presentation SlidesMarketing Website Performance Scorecard PowerPoint Presentation Slides
Marketing Website Performance Scorecard PowerPoint Presentation Slides
 
June 2018 U.S. employment update and outlook
June 2018 U.S. employment update and outlookJune 2018 U.S. employment update and outlook
June 2018 U.S. employment update and outlook
 
Investor roadshow presentation july 2017 final (1)
Investor roadshow presentation   july 2017 final (1)Investor roadshow presentation   july 2017 final (1)
Investor roadshow presentation july 2017 final (1)
 
Oregon Economic and Revenue Forecast, December 2014
Oregon Economic and Revenue Forecast, December 2014Oregon Economic and Revenue Forecast, December 2014
Oregon Economic and Revenue Forecast, December 2014
 
March 2016 U.S. employment update and outlook
March 2016 U.S. employment update and outlookMarch 2016 U.S. employment update and outlook
March 2016 U.S. employment update and outlook
 
Minneapolis–St. Paul Employment Update | July 2016
Minneapolis–St. Paul Employment Update | July 2016Minneapolis–St. Paul Employment Update | July 2016
Minneapolis–St. Paul Employment Update | July 2016
 
Net Lease Market Research Report Published by The Boulder Group
Net Lease Market Research Report  Published by The Boulder Group Net Lease Market Research Report  Published by The Boulder Group
Net Lease Market Research Report Published by The Boulder Group
 
November 2015 U.S. employment update and outlook
November 2015 U.S. employment update and outlookNovember 2015 U.S. employment update and outlook
November 2015 U.S. employment update and outlook
 
January 2016 U.S. employment update and outlook
January 2016 U.S. employment update and outlookJanuary 2016 U.S. employment update and outlook
January 2016 U.S. employment update and outlook
 
September 2017 U.S. employment update and outlook
September 2017 U.S. employment update and outlookSeptember 2017 U.S. employment update and outlook
September 2017 U.S. employment update and outlook
 

More from EDR

Measure twice shields
Measure twice   shieldsMeasure twice   shields
Measure twice shieldsEDR
 
Brownfields under trump panel
Brownfields under trump panelBrownfields under trump panel
Brownfields under trump panelEDR
 
How technology is changing opp danielson
How technology is changing opp danielsonHow technology is changing opp danielson
How technology is changing opp danielsonEDR
 
Measure twice van buren
Measure twice   van burenMeasure twice   van buren
Measure twice van burenEDR
 
Covering your bases parson
Covering your bases parsonCovering your bases parson
Covering your bases parsonEDR
 
Covering Your Bases Parson
Covering Your Bases ParsonCovering Your Bases Parson
Covering Your Bases ParsonEDR
 
CRE At A Crossroads Golin
CRE At A Crossroads GolinCRE At A Crossroads Golin
CRE At A Crossroads GolinEDR
 
Covering Your Bases McDonald
Covering Your Bases McDonaldCovering Your Bases McDonald
Covering Your Bases McDonaldEDR
 
Strategic Growth Spiers
Strategic Growth SpiersStrategic Growth Spiers
Strategic Growth SpiersEDR
 
Market Update Rossi
Market Update RossiMarket Update Rossi
Market Update RossiEDR
 
Market Update - Rossi
Market Update - RossiMarket Update - Rossi
Market Update - RossiEDR
 
Market Update - Keene
Market Update - KeeneMarket Update - Keene
Market Update - KeeneEDR
 
The World of CRE Finance
The World of CRE FinanceThe World of CRE Finance
The World of CRE FinanceEDR
 
Two Roads Diverged - Conway
Two Roads Diverged - ConwayTwo Roads Diverged - Conway
Two Roads Diverged - ConwayEDR
 
Brownfields Under Trump - Panel
Brownfields Under Trump - PanelBrownfields Under Trump - Panel
Brownfields Under Trump - PanelEDR
 
Brownfields Under Trump - Bartsch
Brownfields Under Trump - BartschBrownfields Under Trump - Bartsch
Brownfields Under Trump - BartschEDR
 
Covering Your Bases - Parson
Covering Your Bases - ParsonCovering Your Bases - Parson
Covering Your Bases - ParsonEDR
 
A Look at Brexit - Mellott
A Look at Brexit - MellottA Look at Brexit - Mellott
A Look at Brexit - MellottEDR
 
EDR REC CREC-HREC Presentation - Boston DDD
EDR REC CREC-HREC Presentation - Boston DDDEDR REC CREC-HREC Presentation - Boston DDD
EDR REC CREC-HREC Presentation - Boston DDDEDR
 
Conducting the VEC Investigation for a Phase I - Boston DDD
Conducting the VEC Investigation for a Phase I - Boston DDDConducting the VEC Investigation for a Phase I - Boston DDD
Conducting the VEC Investigation for a Phase I - Boston DDDEDR
 

More from EDR (20)

Measure twice shields
Measure twice   shieldsMeasure twice   shields
Measure twice shields
 
Brownfields under trump panel
Brownfields under trump panelBrownfields under trump panel
Brownfields under trump panel
 
How technology is changing opp danielson
How technology is changing opp danielsonHow technology is changing opp danielson
How technology is changing opp danielson
 
Measure twice van buren
Measure twice   van burenMeasure twice   van buren
Measure twice van buren
 
Covering your bases parson
Covering your bases parsonCovering your bases parson
Covering your bases parson
 
Covering Your Bases Parson
Covering Your Bases ParsonCovering Your Bases Parson
Covering Your Bases Parson
 
CRE At A Crossroads Golin
CRE At A Crossroads GolinCRE At A Crossroads Golin
CRE At A Crossroads Golin
 
Covering Your Bases McDonald
Covering Your Bases McDonaldCovering Your Bases McDonald
Covering Your Bases McDonald
 
Strategic Growth Spiers
Strategic Growth SpiersStrategic Growth Spiers
Strategic Growth Spiers
 
Market Update Rossi
Market Update RossiMarket Update Rossi
Market Update Rossi
 
Market Update - Rossi
Market Update - RossiMarket Update - Rossi
Market Update - Rossi
 
Market Update - Keene
Market Update - KeeneMarket Update - Keene
Market Update - Keene
 
The World of CRE Finance
The World of CRE FinanceThe World of CRE Finance
The World of CRE Finance
 
Two Roads Diverged - Conway
Two Roads Diverged - ConwayTwo Roads Diverged - Conway
Two Roads Diverged - Conway
 
Brownfields Under Trump - Panel
Brownfields Under Trump - PanelBrownfields Under Trump - Panel
Brownfields Under Trump - Panel
 
Brownfields Under Trump - Bartsch
Brownfields Under Trump - BartschBrownfields Under Trump - Bartsch
Brownfields Under Trump - Bartsch
 
Covering Your Bases - Parson
Covering Your Bases - ParsonCovering Your Bases - Parson
Covering Your Bases - Parson
 
A Look at Brexit - Mellott
A Look at Brexit - MellottA Look at Brexit - Mellott
A Look at Brexit - Mellott
 
EDR REC CREC-HREC Presentation - Boston DDD
EDR REC CREC-HREC Presentation - Boston DDDEDR REC CREC-HREC Presentation - Boston DDD
EDR REC CREC-HREC Presentation - Boston DDD
 
Conducting the VEC Investigation for a Phase I - Boston DDD
Conducting the VEC Investigation for a Phase I - Boston DDDConducting the VEC Investigation for a Phase I - Boston DDD
Conducting the VEC Investigation for a Phase I - Boston DDD
 

Recently uploaded

Kenya’s Coconut Value Chain by Gatsby Africa
Kenya’s Coconut Value Chain by Gatsby AfricaKenya’s Coconut Value Chain by Gatsby Africa
Kenya’s Coconut Value Chain by Gatsby Africaictsugar
 
Kenya Coconut Production Presentation by Dr. Lalith Perera
Kenya Coconut Production Presentation by Dr. Lalith PereraKenya Coconut Production Presentation by Dr. Lalith Perera
Kenya Coconut Production Presentation by Dr. Lalith Pereraictsugar
 
Market Sizes Sample Report - 2024 Edition
Market Sizes Sample Report - 2024 EditionMarket Sizes Sample Report - 2024 Edition
Market Sizes Sample Report - 2024 EditionMintel Group
 
BEST Call Girls In Old Faridabad ✨ 9773824855 ✨ Escorts Service In Delhi Ncr,
BEST Call Girls In Old Faridabad ✨ 9773824855 ✨ Escorts Service In Delhi Ncr,BEST Call Girls In Old Faridabad ✨ 9773824855 ✨ Escorts Service In Delhi Ncr,
BEST Call Girls In Old Faridabad ✨ 9773824855 ✨ Escorts Service In Delhi Ncr,noida100girls
 
Independent Call Girls Andheri Nightlaila 9967584737
Independent Call Girls Andheri Nightlaila 9967584737Independent Call Girls Andheri Nightlaila 9967584737
Independent Call Girls Andheri Nightlaila 9967584737Riya Pathan
 
8447779800, Low rate Call girls in Saket Delhi NCR
8447779800, Low rate Call girls in Saket Delhi NCR8447779800, Low rate Call girls in Saket Delhi NCR
8447779800, Low rate Call girls in Saket Delhi NCRashishs7044
 
Buy gmail accounts.pdf Buy Old Gmail Accounts
Buy gmail accounts.pdf Buy Old Gmail AccountsBuy gmail accounts.pdf Buy Old Gmail Accounts
Buy gmail accounts.pdf Buy Old Gmail AccountsBuy Verified Accounts
 
Marketplace and Quality Assurance Presentation - Vincent Chirchir
Marketplace and Quality Assurance Presentation - Vincent ChirchirMarketplace and Quality Assurance Presentation - Vincent Chirchir
Marketplace and Quality Assurance Presentation - Vincent Chirchirictsugar
 
Call US-88OO1O2216 Call Girls In Mahipalpur Female Escort Service
Call US-88OO1O2216 Call Girls In Mahipalpur Female Escort ServiceCall US-88OO1O2216 Call Girls In Mahipalpur Female Escort Service
Call US-88OO1O2216 Call Girls In Mahipalpur Female Escort Servicecallgirls2057
 
Intro to BCG's Carbon Emissions Benchmark_vF.pdf
Intro to BCG's Carbon Emissions Benchmark_vF.pdfIntro to BCG's Carbon Emissions Benchmark_vF.pdf
Intro to BCG's Carbon Emissions Benchmark_vF.pdfpollardmorgan
 
Call Girls In Sikandarpur Gurgaon ❤️8860477959_Russian 100% Genuine Escorts I...
Call Girls In Sikandarpur Gurgaon ❤️8860477959_Russian 100% Genuine Escorts I...Call Girls In Sikandarpur Gurgaon ❤️8860477959_Russian 100% Genuine Escorts I...
Call Girls In Sikandarpur Gurgaon ❤️8860477959_Russian 100% Genuine Escorts I...lizamodels9
 
Lowrate Call Girls In Sector 18 Noida ❤️8860477959 Escorts 100% Genuine Servi...
Lowrate Call Girls In Sector 18 Noida ❤️8860477959 Escorts 100% Genuine Servi...Lowrate Call Girls In Sector 18 Noida ❤️8860477959 Escorts 100% Genuine Servi...
Lowrate Call Girls In Sector 18 Noida ❤️8860477959 Escorts 100% Genuine Servi...lizamodels9
 
MAHA Global and IPR: Do Actions Speak Louder Than Words?
MAHA Global and IPR: Do Actions Speak Louder Than Words?MAHA Global and IPR: Do Actions Speak Louder Than Words?
MAHA Global and IPR: Do Actions Speak Louder Than Words?Olivia Kresic
 
Call Us 📲8800102216📞 Call Girls In DLF City Gurgaon
Call Us 📲8800102216📞 Call Girls In DLF City GurgaonCall Us 📲8800102216📞 Call Girls In DLF City Gurgaon
Call Us 📲8800102216📞 Call Girls In DLF City Gurgaoncallgirls2057
 
Digital Transformation in the PLM domain - distrib.pdf
Digital Transformation in the PLM domain - distrib.pdfDigital Transformation in the PLM domain - distrib.pdf
Digital Transformation in the PLM domain - distrib.pdfJos Voskuil
 
2024 Numerator Consumer Study of Cannabis Usage
2024 Numerator Consumer Study of Cannabis Usage2024 Numerator Consumer Study of Cannabis Usage
2024 Numerator Consumer Study of Cannabis UsageNeil Kimberley
 
Marketing Management Business Plan_My Sweet Creations
Marketing Management Business Plan_My Sweet CreationsMarketing Management Business Plan_My Sweet Creations
Marketing Management Business Plan_My Sweet Creationsnakalysalcedo61
 
8447779800, Low rate Call girls in Tughlakabad Delhi NCR
8447779800, Low rate Call girls in Tughlakabad Delhi NCR8447779800, Low rate Call girls in Tughlakabad Delhi NCR
8447779800, Low rate Call girls in Tughlakabad Delhi NCRashishs7044
 
Contemporary Economic Issues Facing the Filipino Entrepreneur (1).pptx
Contemporary Economic Issues Facing the Filipino Entrepreneur (1).pptxContemporary Economic Issues Facing the Filipino Entrepreneur (1).pptx
Contemporary Economic Issues Facing the Filipino Entrepreneur (1).pptxMarkAnthonyAurellano
 

Recently uploaded (20)

Kenya’s Coconut Value Chain by Gatsby Africa
Kenya’s Coconut Value Chain by Gatsby AfricaKenya’s Coconut Value Chain by Gatsby Africa
Kenya’s Coconut Value Chain by Gatsby Africa
 
Kenya Coconut Production Presentation by Dr. Lalith Perera
Kenya Coconut Production Presentation by Dr. Lalith PereraKenya Coconut Production Presentation by Dr. Lalith Perera
Kenya Coconut Production Presentation by Dr. Lalith Perera
 
Market Sizes Sample Report - 2024 Edition
Market Sizes Sample Report - 2024 EditionMarket Sizes Sample Report - 2024 Edition
Market Sizes Sample Report - 2024 Edition
 
BEST Call Girls In Old Faridabad ✨ 9773824855 ✨ Escorts Service In Delhi Ncr,
BEST Call Girls In Old Faridabad ✨ 9773824855 ✨ Escorts Service In Delhi Ncr,BEST Call Girls In Old Faridabad ✨ 9773824855 ✨ Escorts Service In Delhi Ncr,
BEST Call Girls In Old Faridabad ✨ 9773824855 ✨ Escorts Service In Delhi Ncr,
 
Independent Call Girls Andheri Nightlaila 9967584737
Independent Call Girls Andheri Nightlaila 9967584737Independent Call Girls Andheri Nightlaila 9967584737
Independent Call Girls Andheri Nightlaila 9967584737
 
8447779800, Low rate Call girls in Saket Delhi NCR
8447779800, Low rate Call girls in Saket Delhi NCR8447779800, Low rate Call girls in Saket Delhi NCR
8447779800, Low rate Call girls in Saket Delhi NCR
 
Buy gmail accounts.pdf Buy Old Gmail Accounts
Buy gmail accounts.pdf Buy Old Gmail AccountsBuy gmail accounts.pdf Buy Old Gmail Accounts
Buy gmail accounts.pdf Buy Old Gmail Accounts
 
Marketplace and Quality Assurance Presentation - Vincent Chirchir
Marketplace and Quality Assurance Presentation - Vincent ChirchirMarketplace and Quality Assurance Presentation - Vincent Chirchir
Marketplace and Quality Assurance Presentation - Vincent Chirchir
 
Call US-88OO1O2216 Call Girls In Mahipalpur Female Escort Service
Call US-88OO1O2216 Call Girls In Mahipalpur Female Escort ServiceCall US-88OO1O2216 Call Girls In Mahipalpur Female Escort Service
Call US-88OO1O2216 Call Girls In Mahipalpur Female Escort Service
 
Intro to BCG's Carbon Emissions Benchmark_vF.pdf
Intro to BCG's Carbon Emissions Benchmark_vF.pdfIntro to BCG's Carbon Emissions Benchmark_vF.pdf
Intro to BCG's Carbon Emissions Benchmark_vF.pdf
 
Corporate Profile 47Billion Information Technology
Corporate Profile 47Billion Information TechnologyCorporate Profile 47Billion Information Technology
Corporate Profile 47Billion Information Technology
 
Call Girls In Sikandarpur Gurgaon ❤️8860477959_Russian 100% Genuine Escorts I...
Call Girls In Sikandarpur Gurgaon ❤️8860477959_Russian 100% Genuine Escorts I...Call Girls In Sikandarpur Gurgaon ❤️8860477959_Russian 100% Genuine Escorts I...
Call Girls In Sikandarpur Gurgaon ❤️8860477959_Russian 100% Genuine Escorts I...
 
Lowrate Call Girls In Sector 18 Noida ❤️8860477959 Escorts 100% Genuine Servi...
Lowrate Call Girls In Sector 18 Noida ❤️8860477959 Escorts 100% Genuine Servi...Lowrate Call Girls In Sector 18 Noida ❤️8860477959 Escorts 100% Genuine Servi...
Lowrate Call Girls In Sector 18 Noida ❤️8860477959 Escorts 100% Genuine Servi...
 
MAHA Global and IPR: Do Actions Speak Louder Than Words?
MAHA Global and IPR: Do Actions Speak Louder Than Words?MAHA Global and IPR: Do Actions Speak Louder Than Words?
MAHA Global and IPR: Do Actions Speak Louder Than Words?
 
Call Us 📲8800102216📞 Call Girls In DLF City Gurgaon
Call Us 📲8800102216📞 Call Girls In DLF City GurgaonCall Us 📲8800102216📞 Call Girls In DLF City Gurgaon
Call Us 📲8800102216📞 Call Girls In DLF City Gurgaon
 
Digital Transformation in the PLM domain - distrib.pdf
Digital Transformation in the PLM domain - distrib.pdfDigital Transformation in the PLM domain - distrib.pdf
Digital Transformation in the PLM domain - distrib.pdf
 
2024 Numerator Consumer Study of Cannabis Usage
2024 Numerator Consumer Study of Cannabis Usage2024 Numerator Consumer Study of Cannabis Usage
2024 Numerator Consumer Study of Cannabis Usage
 
Marketing Management Business Plan_My Sweet Creations
Marketing Management Business Plan_My Sweet CreationsMarketing Management Business Plan_My Sweet Creations
Marketing Management Business Plan_My Sweet Creations
 
8447779800, Low rate Call girls in Tughlakabad Delhi NCR
8447779800, Low rate Call girls in Tughlakabad Delhi NCR8447779800, Low rate Call girls in Tughlakabad Delhi NCR
8447779800, Low rate Call girls in Tughlakabad Delhi NCR
 
Contemporary Economic Issues Facing the Filipino Entrepreneur (1).pptx
Contemporary Economic Issues Facing the Filipino Entrepreneur (1).pptxContemporary Economic Issues Facing the Filipino Entrepreneur (1).pptx
Contemporary Economic Issues Facing the Filipino Entrepreneur (1).pptx
 

Market Update - Allen

  • 1. e-commerce Growth March 2017 Lee Allen Managing Director lee.allen@am.jll.com +1 843 566 2064
  • 2. Industry share of U.S. lease activity 2010 - 2016 16.7% 16.7% 16.1% 10.5% 10.5% 7.9% 7.5% 3.5% 3.0% 7.7% 2010 - 2014 22.5% 15.2% 12.1%10.4% 9.1% 7.8% 5.8% 3.8% 3.1% 10.2% 2015 - 2016 Retailer (e-commerce) 3PL Consumer Non-Durables Retailers (traditional) Food & Beverage Consumer Durables Auto, Auto Parts & Tires Logistics & Distribution Construction Materials & Building Fixtures Paper Packing All Others e-commerce & Labor Availability
  • 3. Industry share of U.S. lease activity 2010 - 2016 16.1% 22.5% 0.0% 5.0% 10.0% 15.0% 20.0% 25.0% 0 50,000,000 100,000,000 150,000,000 200,000,000 250,000,000 300,000,000 350,000,000 2010 - 2014 2015 - 2016 Total deals completed E-commerce deals completed % E-commerce Squarefeet e-commerce & Labor Availability
  • 4. E-commerce share of total U.S. retail sales 6.3% 7.3% 8.5% 9.8% 10.8% 2011 2012 2013 2014 2015 The share of e-commerce retail sales in the U.S. has steadily increased since 2011, reaching a 10.8% growth rate in 2015. 11.5% The amount online spending increased from Q1 2015 to Q1 2016 for the U.S. customer
  • 5. E-commerce sales for top retailers in 2016, in billions of dollars and percent of total sales $12.5 $4.7 $4.1 $4.0 $3.8 $2.7 $2.5 $2.5 $2.5 3% 5% 15% 10% 3% 19% 16% 13% 3% 0 0.02 0.04 0.06 0.08 0.1 0.12 0.14 0.16 0.18 0.2 0 2 4 6 8 10 12 14 Of the top retailers in the U.S., Walmart had the highest sales in 2016, reaching $12.5 billion. However, Nordstrom saw the highest percentage of sales represented by e- commerce, totaling almost 20%.
  • 6. Research online and in store, buy online 16% Search and buy online 42% Search and buy in store… Research online and in store, buy in store 22% Research online and in store, buy online Search and buy online How purchases were made in 2016 A total of 58% of shoppers made purchases online in 2016, a shift away from in store purchases. Survey of 5,000 shoppers in a Wall Street Journal study
  • 7. U.S. shoppers buying groceries online, by age group Every age group saw an 18% two-year increase in online grocery shopping, illustrating a significant increase in all consumers’ level of comfort with stepping out of the traditional grocery store. 7% 11% 5% 7% 6% 7% 25% 37% 34% 28% 32% 25% Ages 18-24 25-34 35-44 45-54 55-64 65 and older 2014 2016
  • 8. 12.7% 7.6% 7.6% 6.8% 6.4% 6.4% 5.6% 5.3% 5.3% 4.8% 4.5% 4.4% 4.3% 4.3% 4.1% 2.7% 2.2% 1.5% 1.2% 1.2% 1.1% Inland Empire Philadelphia Atlanta Central Valley Dallas / Fort Worth Baltimore New Jersey Indianapolis Phoenix Cincinnati Nashville Seattle / Bellevue Richmond Columbus Reno / Sparks San Antonio Charlotte Salt Lake City East Bay / Oakland Jacksonville Memphis 0.00% 2.00% 4.00% 6.00% 8.00% 10.00% 12.00% 14.00% Most active e-commerce markets 2010 - 2014 e-commerce & Labor Availability
  • 9. 21.3% 12.9% 10.1% 9.9% 8.3% 6.6% 5.2% 4.8% 4.1% 3.8% 3.3% 2.5% 2.4% 2.1% 1.4% 1.3% Inland Empire Dallas / Fort Worth Chicago Atlanta Indianapolis Columbus Philadelphia / Central PA New Jersey Cincinnati St. Louis Reno / Sparks Boston Central New Jersey Kansas City Jacksonville Las Vegas 0.00% 5.00% 10.00% 15.00% 20.00% 25.00% Most active e-commerce markets 2015 - 2016 e-commerce & Labor Availability
  • 10. Most active e-commerce markets 2010 - 2016 16.6% 9.4% 8.7% 6.7% 6.5% 5.3% 5.2% 4.6% 4.5% 3.7% 3.7% 3.5% 2.9% 2.5% 2.4% 2.4% 1.7% 1.5% 1.3% 1.2% 1.2% 1.1% 1.0% 0.8% 0.7% 0.6% 0.6% Inland Empire Dallas / Fort Worth Atlanta Indianapolis Philadelphia / Central PA Columbus New Jersey Chicago Cincinnati Reno / Sparks Central Valley Baltimore Phoenix Nashville Seattle / Bellevue Richmond St. Louis San Antonio Jacksonville Charlotte Boston Central New Jersey Kansas City Salt Lake City East Bay / Oakland Las Vegas Memphis 0.00% 2.00% 4.00% 6.00% 8.00% 10.00% 12.00% 14.00% 16.00% 18.00% e-commerce & Labor Availability
  • 11. So much innovation in the last 2-3 years
  • 12. In the fourth industrial revolution, technology giants have risen to the top Sources: Yahoo Finance; Forbes; JLL Research $0 $100 $200 $300 $400 $500 $600 Royal Dutch Shell BP Citigroup Microsoft General Electric ExxonMobil Facebook ExxonMobil Amazon Microsoft Alphabet Apple Market Capitalization, Billions 2006 2016
  • 13. Those that do not adapt quickly will be disrupted 2004 2005 2006 2007 2008 2009 2010 6.0 Physical rental 0.5 2.5 Digital rental Netflix vs. Blockbuster (2004-2010) Revenues, USD billions SOURCE: McKinsey
  • 14. Moving beyond a pure nodal supply chain strategy
  • 15. Different e-commerce strategies Regional distribution Dedicated e-commerce ‘Ship-from-store’ Outsourced ‘last mile’ ‘Click & collect’ Drop shipping Dedicated in-store pick-up Innovative adaptive re-use
  • 16. More than real estate… Transportation, inventory and labor account for 80% of operating costs A proven, proprietary* process for comparing real estate alternatives based on transportation and operating cost considerations. Utilizes in-house supply chain modeling tools and experts to support our clients’ decision making. SM Supply Chain Select SM is a proprietary service marked offering from JLL.
  • 17. Most active e-commerce markets 2015 - 2016
  • 18. Omni-channel retail is generating demand for new types of buildings Mega e-fulfilment Centers Parcel Hub / Sortation Center Parcel delivery center and urban logistics depot Return Processing Centers Online Food Fulfilment >1 MSF High bay (50 F) to accommodate mezzanine floors for pick-pack operations. Single load with dedicated doors per parcel carrier’s zone. 3 non-dock sides maximize employee parking. 150K to 350K SF with long length to width ratio Low site density. Cross-dock configuration with extensive loading for lorries. <50K SF Expect all types of real estate, shapes and sizes. Any configuration of doors or elevators for loading vans. Maybe bespoke up to 50K SF, depending on value- added operation. Often part of an eFC or RDC for re-distribution decision making. 30K to 150K SF based on operation specifications e.g. degree of automation. Bespoke loading provision for vans. Extensive yard area for trailer and van parking with ample parking for high number of staff.
  • 19. Major retailers are expanding their industrial footprints More product in close proximity means more space.
  • 20. April, 2017 JLL Research Q1 2017 U.S. Industrial Market Overview
  • 22. March 2017 U.S. labor market highlights After two strong months, March disappoints • January and February both exceeded the 200,000-job threshold, while March fell well below expectations with only 98,000 net new jobs. A contraction in retail trade and slowdowns in all major sectors with the exception of professional and business services (PBS) were the primary drivers of this, compounded by volatility due to tightening and employment growth continuing to exceed the rate of labor-force expansion. Although March’s monthly growth did not meet consensus figures, the broader trend remains positive and future months will dictate whether this is an anomalous month or a broader shift in growth rates. 1 Unemployment drops, but slack is beginning to run out • Counter to job growth, unemployment metrics improved once again, with the unemployment rate dropping by another 20 basis points to a cyclical low of 4.5 percent. Total unemployment fell below the 9.0-percent threshold for the first time since 2007 and now stands at 8.9 percent. With unemployment already low, the slowing rate of labor-force expansion (0.5 percent annually compared to total non-farm job growth of 1.5 percent) will present a challenge for employers seeking to increase headcounts, particularly as unemployment for bachelor’s-degree holders remains steady at 2.5 percent. 2 Confidence is up even as inflation ramps up • The consumer confidence index spiked in March to 125.6 points, its highest figure since 2000. Business confidence metrics have also showed optimism, indicating further economic growth ahead. The acceleration in inflation to 2.7 percent – now at the same rate as wage growth – may begin to affect consumer spending, however, but tightening labor-market conditions will likely push wages up further. 3 Source: JLL Research, Bureau of Labor Statistics U.S. economy
  • 23. March 2017 U.S. labor market at a glance +98,000 (78 consecutive months of growth) 1-month net change +2,185,000 (+1.5% y-o-y) 12-month change +795,000 10-year average annual growth 4.5% Unemployment rate 5,626,000 (-1.5% y-o-y) Job openings -50bp 12-month change in unemployment 63.0% Labor force participation rate 5,440,000 (+6.3% y-o-y) Hires 3,220,000 (+11.3% y-o-y) Quits Source: JLL Research, Bureau of Labor Statistics U.S. economy
  • 24. After two strong months, March disappoints After a strong start to 2017, March saw only 98,000 net new jobs, while downward revisions hit Jan. and Feb. 360,000 226,000 243,000 96,000 110,000 88,000 106,000 122,000 221,000 183,000 164,000 196,000 360,000 226,000 243,000 96,000 110,000 88,000 160,000 150,000 161,000 225,000 203,000 214,000 197,000 280,000 141,000 203,000 199,000 201,000 149,000 202,000 164,000 237,000 274,000 84,000 166,000 188,000 225,000 330,000 236,000 286,000 249,000 213,000 250,000 221,000 423,000 329,000 221,000 265,000 84,000 251,000 273,000 228,000 277,000 150,000 149,000 295,000 280,000 262,000 168,000 233,000 186,000 277,000 24,000 271,000 252,000 176,000 208,000 135,000 164,000 155,000 216,000 219,000 98,000 0 50,000 100,000 150,000 200,000 250,000 300,000 350,000 400,000 450,000 2011 2012 2013 2014 2015 2016 2017 1-monthnetchange Source: JLL Research, Bureau of Labor Statistics U.S. economy
  • 25. Unemployment drops, but slack is beginning to run out Unemployment fell to its lowest rate this cycle (4.5 percent) on the back of further labor- market tightening Source: JLL Research, Bureau of Labor Statistics 0% 2% 4% 6% 8% 10% 12% -1,000 -800 -600 -400 -200 0 200 400 600 Unemploymentrate(%) 1-monthnetchange(thousands) 1-month net change Unemployment rate U.S. economy
  • 26. Confidence is up even as inflation ramps up Consumer confidence is soaring even as inflation rises and now strongly exceed their previous peak Source: JLL Research, Conference Board 0 20 40 60 80 100 120 140 Consumerconfidenceindex U.S. economy
  • 28. Industrial observations 2017 set to be another solid year for construction • The construction pipeline continues to grow, led by a significant increase (29 percent from the fourth quarter) of construction activity of build-to-suit properties. • While the speculative pipeline remains robust, owner-user and BTS projects combined contributed 28 percent to the “new-groundbreakings. Preleasing rates for speculatively-built buildings increased by 320 bps to nearly 27 percent, a sign of continued healthy demand from tenants. 1 Logistics & distribution and 3PL sectors dominate leasing • Responding to healthy consumer spending and growing e-commerce sales, the combined logistics & distribution and 3PL sectors committed to 24 percent of the total leasing activity. Inland Empire, Atlanta, Los Angeles and Chicago are the top hubs of 3PL leasing activity. • 68 percent of ‘big-box’ leasing signed at new construction buildings (built in last 3 years) 2 Total net absorption continues to outpace new deliveries. • Philadelphia alone absorbed nearly 8.2 million square feet, followed by Dallas and Atlanta. Those three markets contributed to 34 percent of U.S. absorption gains. • Vacancy rates fell in nearly three quarters of U.S. markets, causing overall U.S. vacancy to decline another 30 basis points. This is despite a steady flow of new construction in most markets. 3 U.S. leasing
  • 29. 2017 set to be another solid year for construction New deliveries on track to cross the 200 m.s.f. mark Source: JLL Research U.S. leasing 0 50 100 150 200 250 2013 2014 2015 2016 Q1 2017 Expected 2017 completions millionssquarefeet
  • 30. 22.0% 6.6% 71.5% What is the pace of construction? While the speculative pipeline remains robust, owner-user and BTS projects combined contributed 28 percent to the “new-groundbreakings” Source: JLL Research U.S. leasing BTS Owner-user Spec 17.5% 25.4% 36.3% 43.2% 24.4% 26.9% 0% 5% 10% 15% 20% 25% 30% 35% 40% 45% 50% Q4 15 Q1 16 Q2 16 Q3 16 Q4 16 Q1 17 Breakdown of new-groundbreakings Spec pre-leasing rates of new deliveries
  • 31. Logistics & distribution and 3PL sectors dominate leasing Responding to healthy consumer spending and growing e-commerce sales, the combined logistics & distribution and 3PL sectors committed to 24 percent of the total leasing activity Source: JLL Research U.S. leasing Total leasing activity 3PL and Logistics Distribution Other sectors 24% Hard to find, existing ‘big-box’ space • 68 percent of ‘big- box’ leasing signed at new construction buildings (built in last 3 years)
  • 32. Total net absorption continues to outpace new deliveries Philadelphia, Dallas and Atlanta alone contributed to 34 percent of U.S. absorption gains Source: JLL Research U.S. leasing 0.0% 2.0% 4.0% 6.0% 8.0% 10.0% 12.0% -150 -100 -50 0 50 100 150 200 250 300 2007 2008 2009 2010 2011 2012 2013 2014 2015 2016 YTD 2017 Nationalvacancyrate(in%) Netabsorption(inmillionsofs.f.) Q1 Q2 Q3 Q4 Total vacancy 5.3%
  • 33. Thank you © 2017 Jones Lang LaSalle IP, Inc. All rights reserved. The information contained in this document is proprietary to JLL and shall be used solely for the purposes of evaluating this proposal. All such documentation and information remains the property of JLL and shall be kept confidential. Reproduction of any part of this document is authorized only to the extent necessary for its evaluation. It is not to be shown to any third party without the prior written authorization of JLL. All information contained herein is from sources deemed reliable; however, no representation or warranty is made as to the accuracy thereof. Lee Allen Managing Director lee.allen@am.jll.com +1 843 566 2064