SlideShare a Scribd company logo
1 of 39
Download to read offline
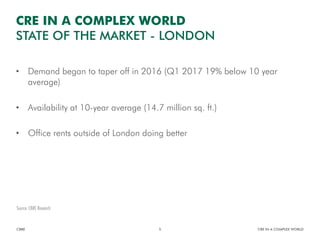
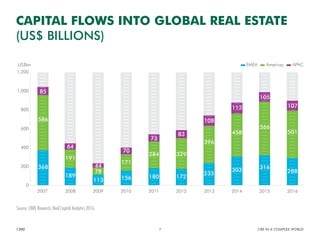
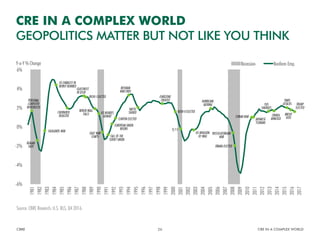
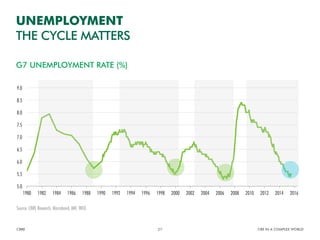
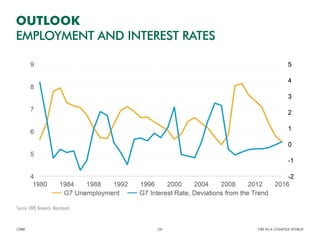
CRE IN A COMPLEX WORLD
MAY 2, 2017
• State of the Market
• What’s influencing markets?
• Some perspective: What really matters?
• What’s next? CRE Outlook
CBRE CRE IN A COMPLEX WORLD2
CRE IN A COMPLEX WORLD
WHAT’S THE PLAN?
LONDON
STATE OF THE MARKET
• 2.5 million sq. ft. of take-up in Central London
• Prime rents unchanged in the city, but down 2% in West End
• 14.7 million sq. ft. of availability
• 6.6 million sq. ft. of completed construction expected
• Less than 3 million sq. ft. (new) expected in 2018
CBRE CRE IN A COMPLEX WORLD4
CRE IN A COMPLEX WORLD
STATE OF THE MARKET - LONDON
Source: CBRE Research
• Demand began to taper off in 2016 (Q1 2017 19% below 10 year
average)
• Availability at 10-year average (14.7 million sq. ft.)
• Office rents outside of London doing better
CBRE CRE IN A COMPLEX WORLD5
CRE IN A COMPLEX WORLD
STATE OF THE MARKET - LONDON
Source: CBRE Research
• The value of real estate transactions in 2016 was down 25% YoY (most
since GFC)
• Central London investment down only 19%
• Not all attributed to referendum
• Volumes are down across the board
CBRE CRE IN A COMPLEX WORLD6
CRE IN A COMPLEX WORLD
STATE OF THE MARKET - LONDON
Source: CBRE Research
Figure 2: Capital flows into global real estate (US$ billions)
Source: CBRE Research, Real Capital Analytics, 2016.
368
586
85
189
191
64
113
78
44
156
171
70
73
284
180 172
329
83
233
396
108
303
458
113
316
566
105
107
501
288
EMEAUS$bn Americas APAC
2007 2008 2009 2010 2011 2012 2013 2014 2015 2016
1,200
1,000
800
600
400
200
0
CAPITAL FLOWS INTO GLOBAL REAL ESTATE
(US$ BILLIONS)
CBRE CRE IN A COMPLEX WORLD7
Source: CBRE Research, Real Capital Analytics 2016.
EUROPE
STATE OF THE MARKET
Figure 3: 2016 prime capital value growth (annual change)
Source: CBRE Research, NCREIF, 2016.
4.0%
5.4%
8.6%
8.7%
10.3%
6.6%
4.9%
2.7%
5.1%
Office Retail Industrial
AMERICAS EMEA ASIA PACIFIC
2016 PRIME CAPITAL VALUE GROWTH
(ANNUAL CHANGE)
CBRE CRE IN A COMPLEX WORLD9
Source: CBRE Research, NCREIF, 2016.
Figure 4: 2016 prime property rent growth (annual change)
Source: CBRE Research, 2016.
0.2%
2.3% 1.9%
-1.9%
6.6%
4.7%
1.8%
0.0%
0.9%
Office Retail Industrial
AMERICAS EMEA ASIA PACIFIC
2016 PRIME PROPERTY RENT GROWTH
(ANNUAL CHANGE)
CBRE CRE IN A COMPLEX WORLD10
Source: CBRE Research, 2016.
6.0
6.5
7.0
7.5
8.0
8.5
9.0
9.5
10.0
2004 2005 2006 2007 2008 2009 2010 2011 2012 2013 2014 2015 2016 2017 2018 2019 2020
OFFICE MARKET*
VACANCY RATES (%)
CBRE CRE IN A COMPLEX WORLD11
*All major markets where vacancy data are available except Moscow
Source: CBRE Research
WHAT’S INFLUENCING MARKETS?
In the UK
In the rest of Europe
Very Significant Significant Neutral Insignificant Very Insignificant
40%
35%
30%
25%
20%
15%
10%
5%
0%
BREXIT
BIG DEAL OR RED HERRING?
CBRE CRE IN A COMPLEX WORLD13
Source: CBRE European Occupier Survey 2017.
Access to sufficiently large/skilled labor pool
Exchange rate fluctuations
General policy uncertainty
Ability to operate in European markets
Possible changes to trading
arrangements / tariff introductions
Other
32%
28%
27%
8%
2% 3%
BREXIT
WHAT’S THE CONCERN?
CBRE CRE IN A COMPLEX WORLD14
Source: CBRE European Occupier Survey 2017.
MARCH
29: Article 50
issued
APRIL
29: EU Summit
signs off
negotiating
guidelines to
Commission
MAY
7: French
elections
JUNE
Substantive
‘divorce’
negotiations on
money, EU
citizens and N
Ireland
JULY,
AUGUST
(Go on holiday)
SEPTEMBER
German
elections
ARTICLE 50
WHAT HAPPENS NEXT?
CBRE CRE IN A COMPLEX WORLD15
GREATEST CHALLENGES FOR ORGANIZATIONS FUTURE OPERATIONS
EMEA OCCUPIER SURVEY
KEY FINDINGS
CBRE CRE IN A COMPLEX WORLD16
Source: CBRE Research, 2017; EMEA Occupier Survey Report 2017.
- 100 200 300 400 500 600 700 800 900
UK
Germany
France
Sweden
Netherlands
Spain
Italy
Norway
Finland
Denmark
Belgium
Poland
Russia
Austria
Ireland
EUROPEAN CRE
INVESTMENT 2003-2016
CBRE CRE IN A COMPLEX WORLD17
Source: CBRE Research 2016.
0% 10% 20% 30% 40% 50% 60% 70% 80%
Czech Republic
Russia
Norway
Sweden
Poland
Ireland
Italy
Netherlands
Spain
France
Germany
UK London
0% 10% 20% 30% 40% 50% 60% 70% 80%
Czech Republic
Switzerland
Portugal
Russia
Denmark
Netherlands
Italy
Belgium
Spain
France
Germany
UK
Total investment from North America, % of total
KEY DESTINATIONS IN EUROPE
TOP COUNTRIES 2013-2016
CBRE CRE IN A COMPLEX WORLD18
Source: CBRE Research 2016.
London
Total investment from Asia, % of total
WHAT REALLY MATTERS?
SOME PERSPECTIVE
• London most connected city*
• Hosts 40% of European HQ for world’s top companies**
CBRE CRE IN A COMPLEX WORLD20
CRE IN A COMPLEX WORLD
SOME PERSPECTIVE
*Source: Global and World Cities Network
**Source: Deloitte
• 65,000 people EU-facing financial services
• 3% of UK office stock (6 million sq. ft.)
• About the level of space leased in Central London every 6 months
CBRE CRE IN A COMPLEX WORLD21
CRE IN A COMPLEX WORLD
SOME PERSPECTIVE
Source: CBRE Research
• Top 10 global investment banks 52,000 in London
• Could see 27% of those jobs moved
• Equal to 5 weeks of leasing in London
CBRE CRE IN A COMPLEX WORLD22
CRE IN A COMPLEX WORLD
SOME PERSPECTIVE
Source: CBRE Research
• In 2006 financial services accounted for 41% of Central London leasing
(sq. ft.)
• In 2016 only 23%
• London has diversified
• Tech and media (immigration key)
CBRE CRE IN A COMPLEX WORLD23
CRE IN A COMPLEX WORLD
SOME PERSPECTIVE
Source: CBRE Research
• London boasts a lot of advantages
• Housing, schools, infrastructure and culture
• Legal and regulatory environment
• Alternatives aren’t clear
• Impacts will be over the long term
CBRE CRE IN A COMPLEX WORLD24
CRE IN A COMPLEX WORLD
SOME PERSPECTIVE
CBRE CRE IN A COMPLEX WORLD25
CRE IN A COMPLEX WORLD
SOME PERSPECTIVE
TRANSPARENCY FX ADVANTAGE
SIZELIQUIDITY
-6%
-4%
-2%
0%
2%
4%
6%
Y-o-Y % Change Recession Nonfarm Emp.
1981
1982
1983
1984
1985
1986
1987
1988
1989
1990
1991
1992
1993
1994
1995
1996
1997
1998
1999
2000
2001
2002
2003
2004
2005
2006
2007
2008
2009
2010
2011
2012
2013
2014
2015
2017
2016
REAGAN
SHOT
FALKLANDS WAR
US EMBASSY IN
BEIRUT BOMBED
CHERNOBYL
DISASTER
GLASTNOST
IN USSR
BERLIN WALL
FALLS US INVADES
KUWAIT
GULF WAR
STARTS FALL OF THE
SOVIET UNION
EUROPEAN UNION
BEGINS
BOSNIAN
WAR ENDS
EUROZONE
CREATED
9/11
US INVASION
OF IRAQ
RUSSO-GEORGIAN
WAR
OBAMA ELECTED
SYRIAN WAR
JAPANESE
TSUNAMI
ISIS
EMERGES
CRIMEA
ANNEXED
PARIS
ATTACKS
BREXIT
VOTE
NAFTA
SIGNED
HURRICANE
KATRINA
BUSH I ELECTED
CLINTON ELECTED
BUSH II ELECTED
TRUMP
ELECTED
PERSONAL
COMPUTER
INTRODUCED
CRE IN A COMPLEX WORLD
GEOPOLITICS MATTER BUT NOT LIKE YOU THINK
CBRE CRE IN A COMPLEX WORLD26
Source: CBRE Research; U.S. BLS, Q4 2016.
UNEMPLOYMENT
THE CYCLE MATTERS
CBRE CRE IN A COMPLEX WORLD27
Source: CBRE Research, Macrobond, IMF, WEO.
G7 UNEMPLOYMENT RATE (%)
5.0
5.5
6.0
6.5
7.0
7.5
8.0
8.5
9.0
1980 1982 1984 1986 1988 1990 1992 1994 1996 1998 2000 2002 2004 2006 2008 2010 2012 2014 2016
OUTLOOK
EMPLOYMENT AND INTEREST RATES
CBRE CRE IN A COMPLEX WORLD28
Source: CBRE Research, Macrobond.
CRE OUTLOOK
WHAT’S NEXT?
Figure 7: Purchasing activity relative to 2016, global and regional
Source: CBRE 2017 Global Investor Intentions Survey.
Global EMEA Americas Asia Pacific
More than
20% lower
Between
10% - 20% lower
Between
10% - 20% higher
More than
20% higher
Up to 10%
lower
About the
same
Up to 10%
higher
%
50
45
40
35
30
25
20
15
10
5
0
PURCHASING ACTIVITY RELATIVE TO 2016
GLOBAL AND REGIONAL
CBRE CRE IN A COMPLEX WORLD30
Source: CBRE 2017 Global Investor Intentions Survey.
on
ORTH
C
#1 SYDNEY
#2 TOKYO
#3 SHANGHAI
#4 MELBOURNE
#5 BRISBANE
#6 HONG KONG
#1 LONDON
#2 BERLIN
#3 MADRID
#4 AMSTERDAM
#5 PARIS
#6 WARSAW
EMEA ASIA PACIFIC
TOP TARGET CITIES
BY REGION
CBRE CRE IN A COMPLEX WORLD31
Source: CBRE 2017 Global Investor Intentions Survey.
Figure 12: Top target cities by region
#1 LOS ANGELES
#2 DALLAS/FORT WORTH
#3 NEW YORK
#4 WASHINGTON DC
#5 ATLANTA
#6 SAN FRANCISCO
#7 SEATTLE
#1 SYDNEY
#2 TOKYO
#3 SHANGHAI
#4 MELBOURNE
#5 BRISBANE
#6 HONG KONG
#1 LONDON
#2 BERLIN
#3 MADRID
#4 AMSTERDAM
#5 PARIS
#6 WARSAW
AMERICAS EMEA ASIA PACIFIC
Source: CBRE 2017 Global Investor Intentions Survey.
#1 SYDNEY
#2 TOKYO
#3 SHANGHAI
#4 MELBOURNE
ASIA PACIFIC
Figure 12: Top target cities by region
#1 LOS ANGELES
#2 DALLAS/FORT WORTH
#3 NEW YORK
#4 WASHINGTON DC
#5 ATLANTA
#6 SAN FRANCISCO
#7 SEATTLE
#1 SYDNEY
#2 TOKYO
#3 SHANGHAI
#4 MELBOURNE
#5 BRISBANE
#6 HONG KONG
#1 LONDON
#2 BERLIN
#3 MADRID
#4 AMSTERDAM
#5 PARIS
#6 WARSAW
AMERICAS EMEA ASIA PACIFIC
Source: CBRE 2017 Global Investor Intentions Survey.
Figure 12: Top target cities by region
#1 LOS ANGELES
#2 DALLAS/FORT WORTH
#3 NEW YORK
#4 WASHINGTON DC
#5 ATLANTA
#6 SAN FRANCISCO
#7 SEATTLE
#1 SYDNEY
#2 TOKYO
#3 SHANGHAI
#4 MELBOURNE
#5 BRISBANE
#6 HONG KONG
#1 LONDON
#2 BERLIN
#3 MADRID
#4 AMSTERDAM
#5 PARIS
#6 WARSAW
AMERICAS EMEA ASIA PACIFIC
n
RTH
#1 SYDNEY
#2 TOKYO
#3 SHANGHAI
#4 MELBOURNE
#5 BRISBANE
#1 LONDON
#2 BERLIN
#3 MADRID
#4 AMSTERDAM
#5 PARIS
EMEA ASIA PACIFIC
Figure 12: Top target cities by region
#1 LOS ANGELES
#2 DALLAS/FORT WORTH
#3 NEW YORK
#4 WASHINGTON DC
#5 ATLANTA
#6 SAN FRANCISCO
#7 SEATTLE
#1 SYDNEY
#2 TOKYO
#3 SHANGHAI
#4 MELBOURNE
#5 BRISBANE
#6 HONG KONG
#1 LONDON
#2 BERLIN
#3 MADRID
#4 AMSTERDAM
#5 PARIS
#6 WARSAW
AMERICAS EMEA ASIA PACIFIC
Source: CBRE 2017 Global Investor Intentions Survey.
Figure 12: Top target cities by region
#1 LOS ANGELES
#2 DALLAS/FORT WORTH
#3 NEW YORK
#4 WASHINGTON DC
#5 ATLANTA
#6 SAN FRANCISCO
#7 SEATTLE
#1 SYDNEY
#2 TOKYO
#3 SHANGHAI
#4 MELBOURNE
#5 BRISBANE
#6 HONG KONG
#1 LONDON
#2 BERLIN
#3 MADRID
#4 AMSTERDAM
#5 PARIS
#6 WARSAW
AMERICAS EMEA ASIA PACIFIC
Source: CBRE 2017 Global Investor Intentions Survey.
Figure 12: Top target cities by region
#1 LOS ANGELES
#2 DALLAS/FORT WORTH
#3 NEW YORK
#4 WASHINGTON DC
#5 ATLANTA
#6 SAN FRANCISCO
#1 SYDNEY
#2 TOKYO
#3 SHANGHAI
#4 MELBOURNE
#5 BRISBANE
#6 HONG KONG
#1 LONDON
#2 BERLIN
#3 MADRID
#4 AMSTERDAM
#5 PARIS
#6 WARSAW
AMERICAS EMEA ASIA PACIFIC
#1 LOS ANGELES
#2 DALLAS/FORT WORTH
#3 NEW YORK
#4 WASHINGTON DC
#5 ATLANTA
#6 SAN FRANCISCO
#7 SEATTLE
#1 SYDNEY
#2 TOKYO
#3 SHANGHAI
#4 MELBOURNE
#5 BRISBANE
#6 HONG KONG
#1 LONDON
#2 BERLIN
#3 MADRID
#4 AMSTERDAM
#5 PARIS
#6 WARSAW
AMERICAS EMEA ASIA PACIFIC
Source: CBRE 2017 Global Investor Intentions Survey.
Figure 12: Top target cities by region
#1 LOS ANGELES
#2 DALLAS/FORT WORTH
#3 NEW YORK
#4 WASHINGTON DC
#5 ATLANTA
#6 SAN FRANCISCO
#7 SEATTLE
#1 SYDNEY
#2 TOKYO
#3 SHANGHAI
#4 MELBOURNE
#5 BRISBANE
#6 HONG KONG
#1 LONDON
#2 BERLIN
#3 MADRID
#4 AMSTERDAM
#5 PARIS
#6 WARSAW
AMERICAS EMEA ASIA PACIFIC
Source: CBRE 2017 Global Investor Intentions Survey.
Figure 12: Top target cities by region
#1 LOS ANGELES
#2 DALLAS/FORT WORTH
#3 NEW YORK
#4 WASHINGTON DC
#5 ATLANTA
#6 SAN FRANCISCO
#7 SEATTLE
#1 SYDNEY
#2 TOKYO
#3 SHANGHAI
#4 MELBOURNE
#5 BRISBANE
#6 HONG KONG
#1 LONDON
#2 BERLIN
#3 MADRID
#4 AMSTERDAM
#5 PARIS
#6 WARSAW
AMERICAS EMEA ASIA PACIFIC
Source: CBRE 2017 Global Investor Intentions Survey.
Figure 12: Top target cities by region
#1 LOS ANGELES
#2 DALLAS/FORT WORTH
#3 NEW YORK
#4 WASHINGTON DC
#5 ATLANTA
#6 SAN FRANCISCO
#7 SEATTLE
#1 SYDN
#2 TOK
#3 SHAN
#4 MELB
#5 BRISB
#6 HON
#1 LONDON
#2 BERLIN
#3 MADRID
#4 AMSTERDAM
#5 PARIS
#6 WARSAW
AMERICAS EMEA ASIA PAC
Source: CBRE 2017 Global Investor Intentions Survey.
#2 DALLAS/FORT WORTH
#3 NEW YORK
#4 WASHINGTON DC
#5 ATLANTA
#6 SAN FRANCISCO
#7 SEATTLE
#2 TOKYO
#3 SHANG
#4 MELBO
#5 BRISBA
#6 HONG
#2 BERLIN
#3 MADRID
#4 AMSTERDAM
#5 PARIS
#6 WARSAW
Source: CBRE 2017 Global Investor Intentions Survey.
#3 NEW YORK
#4 WASHINGTON DC
#5 ATLANTA
#6 SAN FRANCISCO
#7 SEATTLE
#3 MADR
#4 AMST
#5 PARIS
#6 WARS
Source: CBRE 2017 Global Investor Intentions Survey.
#3 NEW YORK
#4 WASHINGTON DC
#5 ATLANTA
#6 SAN FRANCISCO
#7 SEATTLE
#3 SHANGHAI
#4 MELBOURNE
#5 BRISBANE
#6 HONG KONG
#3 MADRID
#4 AMSTERDAM
#5 PARIS
#6 WARSAW
Source: CBRE 2017 Global Investor Intentions Survey.
AMERICAS
EMEA
ASIA PACIFIC
Source: CBRE 2017 Global Investor Intentions Survey.
79%
DIRECT
26%
DEVELOPMENT
FUNDING
8%
CORPORATE
AQUISITIONS
7%
OTHER
EQUITY
7%
OTHER
DEBTS
49%
PARTNERSHIP /
JOINT VENTURE /
PARTIAL INTERESTS
22%
LISTED REAL ESTATE
(INCLUDING
LISTED REITS)
PREFERED INVESTOR VEHICLES
2016 VERSUS 2017
CBRE CRE IN A COMPLEX WORLD32
Source: CBRE 2017 Global Investor Intentions Survey.
Figure 15: Preferred investor vehicles
Source: CBRE 2017 Global Investor Intentions Survey.
79%
DIRECT
26%
PROPERTY
FUND
26%
DEVELOPMENT
FUNDING
16%
PRIVATE
DEBT
8%
CORPORATE
AQUISITIONS
7%
OTHER
EQUITY
7%
OTHER
DEBTS
5%
CMBS
49%
PARTNERSHIP /
JOINT VENTURE /
PARTIAL INTERESTS
22%
LISTED REAL ESTATE
(INCLUDING
LISTED REITS)
Figure 15: Preferred investor vehicles
79%
DIRECT
26%
PROPERTY
FUND
26%
DEVELOPMENT
FUNDING
16%
PRIVATE
DEBT
8%
CORPORATE
AQUISITIONS
7%
OTHER
EQUITY
7%
OTHER
DEBTS
5%
CMBS
49%
PARTNERSHIP /
JOINT VENTURE /
PARTIAL INTERESTS
22%
LISTED REAL ESTATE
(INCLUDING
LISTED REITS)
26%
PROPERTY
FUND
16%
PRIVATE
DEBT
7%
OTHER
DEBTS
5%
CMBS
Figure 15: Preferred investor vehicles
Source: CBRE 2017 Global Investor Intentions Survey.
79%
DIRECT
26%
PROPERTY
FUND
26%
DEVELOPMENT
FUNDING
16%
PRIVATE
DEBT
8%
CORPORATE
AQUISITIONS
7%
OTHER
EQUITY
7%
OTHER
DEBTS
5%
CMBS
49%
PARTNERSHIP /
JOINT VENTURE /
PARTIAL INTERESTS
22%
LISTED REAL ESTATE
(INCLUDING
LISTED REITS)
Figure 15: Preferred investor vehicles
Source: CBRE 2017 Global Investor Intentions Survey.
79%
DIRECT
26%
PROPERTY
FUND
26%
DEVELOPMENT
FUNDING
16%
PRIVATE
DEBT
8%
CORPORATE
AQUISITIONS
7%
OTHER
EQUITY
7%
OTHER
DEBTS
5%
CMBS
49%
PARTNERSHIP /
JOINT VENTURE /
PARTIAL INTERESTS
22%
LISTED REAL ESTATE
(INCLUDING
LISTED REITS)
Source: CBRE 2017 Global Investor Intentions Survey.
79%
DIRECT
26%
DEVELOPMENT
FUNDING
8%
CORPORATE
AQUISITIONS
7%
OTHER
EQUITY
7%
OTHER
DEBTS
49%
PARTNERSHIP /
JOINT VENTURE /
PARTIAL INTERESTS
22%
LISTED REAL ESTATE
(INCLUDING
LISTED REITS)
Source: CBRE 2017 Global Investor Intentions Survey.
Figure 16: Investors main motivation for investing in real estate
2017
Yield relative to
other asset classes
Higher income return
than other assets classes
Expectation of better
capital value growth than
asset classes
Other
Hedge against inflation
Asset class diversification
Steady income
stream from rents
%
0 5 10 15 20 25 30 35
30
20
15
Geographic
diversification 7
2
0
0
20
Yield relative to cost of debt
(positive leverage advantage) 6
INVESTOR MOTIVATION
WHY INVEST IN REAL ESTATE?
CBRE CRE IN A COMPLEX WORLD33
Source: CBRE 2017 Global Investor Intentions Survey.
Figure 17: Investor main obstacles to purchase
2017
Asset pricing
Availability of assets
Competition from
other investors
Low market transparency
Other
Currency risk
Tax
Deflation
%
0 6010 3020 40 50
48
25
16
3
2
2
1
1
1
0
Availability and/
or cost of debt
Lack of investment
partners
INVESTOR CHALLENGES
MAIN OBSTACLES TO PURCHASE
CBRE CRE IN A COMPLEX WORLD34
Source: CBRE 2017 Global Investor Intentions Survey.
Figure 18: Investor main concerns
2017
A global economic shock
undermining occupier demand
Faster than expected,
a bubble waiting to burst
Overbuilding leading
to excess supply
Property is overpriced,
a bubble waiting to burst
A local economic shock
undermiming occupier demand
Local politcal instability
Some other property
market related shock
Higher than
expected owners
Other
Distressed sales by
existing owners
Deflation
%
0 5 10 15 20 25
Global political instability
(conflict and or terrorism)
A change of government policy
that makes property less attractive
22
6
2
1
1
1
6
4
21
10
10
15
0
Source: CBRE 2017 Global Investor Intentions Survey.
INVESTOR CHALLENGES
MAIN CONCERNS
CBRE CRE IN A COMPLEX WORLD35
Source: CBRE 2017 Global Investor Intentions Survey.
CONCLUSION
• Europe currently well-positioned cyclically
• Late cycle
• Some room to run
• Politics increasingly important, but not how you think
• Watch interest rates and FX
CBRE CRE IN A COMPLEX WORLD37
CONCLUSION
THE WORLD AT AN INFLECTION POINT
CBRE CRE IN A COMPLEX WORLD38
THANK YOU
DARIN MELLOTT
Director, Research and Analysis
CBRE

More Related Content

Similar to A Look at Brexit - Mellott

170123 vietnam market outlook en
170123 vietnam market outlook   en170123 vietnam market outlook   en
170123 vietnam market outlook enHoang Dung Luu
 
Venture capital market trends 2016
Venture capital market trends 2016Venture capital market trends 2016
Venture capital market trends 2016GVA
 
2Q16 NGKF US Capital Markets Report
2Q16 NGKF US Capital Markets Report2Q16 NGKF US Capital Markets Report
2Q16 NGKF US Capital Markets ReportTodd Hershman
 
Knight Frank Global Cities Report - Mumbai
Knight Frank Global Cities Report - MumbaiKnight Frank Global Cities Report - Mumbai
Knight Frank Global Cities Report - MumbaiKnight Frank India
 
The wealth report 2014
The wealth report 2014The wealth report 2014
The wealth report 2014ajdebre
 
Global Cities The 2016 Report
Global Cities The 2016 ReportGlobal Cities The 2016 Report
Global Cities The 2016 ReportAlfredo Musitani
 
Foreign Investment Capital - U.S. Outlook 2016, Oct. 15, 2016
Foreign Investment Capital - U.S. Outlook 2016, Oct. 15, 2016Foreign Investment Capital - U.S. Outlook 2016, Oct. 15, 2016
Foreign Investment Capital - U.S. Outlook 2016, Oct. 15, 2016Tony D'Silva Kamath, MAI, MRICS
 
Global Development Report 2015
Global Development Report 2015Global Development Report 2015
Global Development Report 2015Johanna Cosham
 
c620708e-913c-4440-b4a6-b936219f2994-150506143646-conversion-gate01
c620708e-913c-4440-b4a6-b936219f2994-150506143646-conversion-gate01c620708e-913c-4440-b4a6-b936219f2994-150506143646-conversion-gate01
c620708e-913c-4440-b4a6-b936219f2994-150506143646-conversion-gate01Marcus Arredondo
 
12 Cities H1 2015 (double pages lo-res)
12 Cities H1 2015 (double pages lo-res)12 Cities H1 2015 (double pages lo-res)
12 Cities H1 2015 (double pages lo-res)Josh Gorin
 
Singapore & Asia Real Estate Investment Market Outlook | REDAS Property Updat...
Singapore & Asia Real Estate Investment Market Outlook | REDAS Property Updat...Singapore & Asia Real Estate Investment Market Outlook | REDAS Property Updat...
Singapore & Asia Real Estate Investment Market Outlook | REDAS Property Updat...Colliers Singapore
 
Colliers UK Hotel Market Index Mar 2016
Colliers UK Hotel Market Index Mar 2016Colliers UK Hotel Market Index Mar 2016
Colliers UK Hotel Market Index Mar 2016James Shorthouse
 
Рейтинг глобальных туристических городов от Mastercard
Рейтинг глобальных туристических городов от MastercardРейтинг глобальных туристических городов от Mastercard
Рейтинг глобальных туристических городов от MastercardGaranin_Konstantin
 
Winning in growth cities 2018 2019 preview
Winning in growth cities 2018 2019 preview Winning in growth cities 2018 2019 preview
Winning in growth cities 2018 2019 preview Cushman & Wakefield
 
Real Estate and Economy Forecast 2014
Real Estate and Economy Forecast 2014Real Estate and Economy Forecast 2014
Real Estate and Economy Forecast 2014Mike Stanko
 
9434_International Construction Costs 2015
9434_International Construction Costs 20159434_International Construction Costs 2015
9434_International Construction Costs 2015Kevin Fitzpatrick
 
Asia Pacific Real Estate Market Outlook 2019
Asia Pacific Real Estate Market Outlook 2019Asia Pacific Real Estate Market Outlook 2019
Asia Pacific Real Estate Market Outlook 2019Đoàn Trọng Hiếu
 

Similar to A Look at Brexit - Mellott (20)

170123 vietnam market outlook en
170123 vietnam market outlook   en170123 vietnam market outlook   en
170123 vietnam market outlook en
 
Stanlib Offshore property presentation
Stanlib Offshore property presentationStanlib Offshore property presentation
Stanlib Offshore property presentation
 
Venture capital market trends 2016
Venture capital market trends 2016Venture capital market trends 2016
Venture capital market trends 2016
 
2Q16 NGKF US Capital Markets Report
2Q16 NGKF US Capital Markets Report2Q16 NGKF US Capital Markets Report
2Q16 NGKF US Capital Markets Report
 
Knight Frank Global Cities Report - Mumbai
Knight Frank Global Cities Report - MumbaiKnight Frank Global Cities Report - Mumbai
Knight Frank Global Cities Report - Mumbai
 
Thewealthreport2014
Thewealthreport2014Thewealthreport2014
Thewealthreport2014
 
The wealth report2014
The wealth report2014The wealth report2014
The wealth report2014
 
The wealth report 2014
The wealth report 2014The wealth report 2014
The wealth report 2014
 
Global Cities The 2016 Report
Global Cities The 2016 ReportGlobal Cities The 2016 Report
Global Cities The 2016 Report
 
Foreign Investment Capital - U.S. Outlook 2016, Oct. 15, 2016
Foreign Investment Capital - U.S. Outlook 2016, Oct. 15, 2016Foreign Investment Capital - U.S. Outlook 2016, Oct. 15, 2016
Foreign Investment Capital - U.S. Outlook 2016, Oct. 15, 2016
 
Global Development Report 2015
Global Development Report 2015Global Development Report 2015
Global Development Report 2015
 
c620708e-913c-4440-b4a6-b936219f2994-150506143646-conversion-gate01
c620708e-913c-4440-b4a6-b936219f2994-150506143646-conversion-gate01c620708e-913c-4440-b4a6-b936219f2994-150506143646-conversion-gate01
c620708e-913c-4440-b4a6-b936219f2994-150506143646-conversion-gate01
 
12 Cities H1 2015 (double pages lo-res)
12 Cities H1 2015 (double pages lo-res)12 Cities H1 2015 (double pages lo-res)
12 Cities H1 2015 (double pages lo-res)
 
Singapore & Asia Real Estate Investment Market Outlook | REDAS Property Updat...
Singapore & Asia Real Estate Investment Market Outlook | REDAS Property Updat...Singapore & Asia Real Estate Investment Market Outlook | REDAS Property Updat...
Singapore & Asia Real Estate Investment Market Outlook | REDAS Property Updat...
 
Colliers UK Hotel Market Index Mar 2016
Colliers UK Hotel Market Index Mar 2016Colliers UK Hotel Market Index Mar 2016
Colliers UK Hotel Market Index Mar 2016
 
Рейтинг глобальных туристических городов от Mastercard
Рейтинг глобальных туристических городов от MastercardРейтинг глобальных туристических городов от Mastercard
Рейтинг глобальных туристических городов от Mastercard
 
Winning in growth cities 2018 2019 preview
Winning in growth cities 2018 2019 preview Winning in growth cities 2018 2019 preview
Winning in growth cities 2018 2019 preview
 
Real Estate and Economy Forecast 2014
Real Estate and Economy Forecast 2014Real Estate and Economy Forecast 2014
Real Estate and Economy Forecast 2014
 
9434_International Construction Costs 2015
9434_International Construction Costs 20159434_International Construction Costs 2015
9434_International Construction Costs 2015
 
Asia Pacific Real Estate Market Outlook 2019
Asia Pacific Real Estate Market Outlook 2019Asia Pacific Real Estate Market Outlook 2019
Asia Pacific Real Estate Market Outlook 2019
 

More from EDR

Measure twice shields
Measure twice   shieldsMeasure twice   shields
Measure twice shieldsEDR
 
Brownfields under trump panel
Brownfields under trump panelBrownfields under trump panel
Brownfields under trump panelEDR
 
How technology is changing opp danielson
How technology is changing opp danielsonHow technology is changing opp danielson
How technology is changing opp danielsonEDR
 
Measure twice van buren
Measure twice   van burenMeasure twice   van buren
Measure twice van burenEDR
 
Covering your bases parson
Covering your bases parsonCovering your bases parson
Covering your bases parsonEDR
 
Covering Your Bases Parson
Covering Your Bases ParsonCovering Your Bases Parson
Covering Your Bases ParsonEDR
 
CRE At A Crossroads Golin
CRE At A Crossroads GolinCRE At A Crossroads Golin
CRE At A Crossroads GolinEDR
 
Covering Your Bases McDonald
Covering Your Bases McDonaldCovering Your Bases McDonald
Covering Your Bases McDonaldEDR
 
Strategic Growth Spiers
Strategic Growth SpiersStrategic Growth Spiers
Strategic Growth SpiersEDR
 
Market Update Rossi
Market Update RossiMarket Update Rossi
Market Update RossiEDR
 
Market Update - Rossi
Market Update - RossiMarket Update - Rossi
Market Update - RossiEDR
 
Market Update - Keene
Market Update - KeeneMarket Update - Keene
Market Update - KeeneEDR
 
Market Update - Allen
Market Update - AllenMarket Update - Allen
Market Update - AllenEDR
 
The World of CRE Finance
The World of CRE FinanceThe World of CRE Finance
The World of CRE FinanceEDR
 
Two Roads Diverged - Conway
Two Roads Diverged - ConwayTwo Roads Diverged - Conway
Two Roads Diverged - ConwayEDR
 
Brownfields Under Trump - Panel
Brownfields Under Trump - PanelBrownfields Under Trump - Panel
Brownfields Under Trump - PanelEDR
 
Brownfields Under Trump - Bartsch
Brownfields Under Trump - BartschBrownfields Under Trump - Bartsch
Brownfields Under Trump - BartschEDR
 
Covering Your Bases - Parson
Covering Your Bases - ParsonCovering Your Bases - Parson
Covering Your Bases - ParsonEDR
 
EDR REC CREC-HREC Presentation - Boston DDD
EDR REC CREC-HREC Presentation - Boston DDDEDR REC CREC-HREC Presentation - Boston DDD
EDR REC CREC-HREC Presentation - Boston DDDEDR
 
Conducting the VEC Investigation for a Phase I - Boston DDD
Conducting the VEC Investigation for a Phase I - Boston DDDConducting the VEC Investigation for a Phase I - Boston DDD
Conducting the VEC Investigation for a Phase I - Boston DDDEDR
 

More from EDR (20)

Measure twice shields
Measure twice   shieldsMeasure twice   shields
Measure twice shields
 
Brownfields under trump panel
Brownfields under trump panelBrownfields under trump panel
Brownfields under trump panel
 
How technology is changing opp danielson
How technology is changing opp danielsonHow technology is changing opp danielson
How technology is changing opp danielson
 
Measure twice van buren
Measure twice   van burenMeasure twice   van buren
Measure twice van buren
 
Covering your bases parson
Covering your bases parsonCovering your bases parson
Covering your bases parson
 
Covering Your Bases Parson
Covering Your Bases ParsonCovering Your Bases Parson
Covering Your Bases Parson
 
CRE At A Crossroads Golin
CRE At A Crossroads GolinCRE At A Crossroads Golin
CRE At A Crossroads Golin
 
Covering Your Bases McDonald
Covering Your Bases McDonaldCovering Your Bases McDonald
Covering Your Bases McDonald
 
Strategic Growth Spiers
Strategic Growth SpiersStrategic Growth Spiers
Strategic Growth Spiers
 
Market Update Rossi
Market Update RossiMarket Update Rossi
Market Update Rossi
 
Market Update - Rossi
Market Update - RossiMarket Update - Rossi
Market Update - Rossi
 
Market Update - Keene
Market Update - KeeneMarket Update - Keene
Market Update - Keene
 
Market Update - Allen
Market Update - AllenMarket Update - Allen
Market Update - Allen
 
The World of CRE Finance
The World of CRE FinanceThe World of CRE Finance
The World of CRE Finance
 
Two Roads Diverged - Conway
Two Roads Diverged - ConwayTwo Roads Diverged - Conway
Two Roads Diverged - Conway
 
Brownfields Under Trump - Panel
Brownfields Under Trump - PanelBrownfields Under Trump - Panel
Brownfields Under Trump - Panel
 
Brownfields Under Trump - Bartsch
Brownfields Under Trump - BartschBrownfields Under Trump - Bartsch
Brownfields Under Trump - Bartsch
 
Covering Your Bases - Parson
Covering Your Bases - ParsonCovering Your Bases - Parson
Covering Your Bases - Parson
 
EDR REC CREC-HREC Presentation - Boston DDD
EDR REC CREC-HREC Presentation - Boston DDDEDR REC CREC-HREC Presentation - Boston DDD
EDR REC CREC-HREC Presentation - Boston DDD
 
Conducting the VEC Investigation for a Phase I - Boston DDD
Conducting the VEC Investigation for a Phase I - Boston DDDConducting the VEC Investigation for a Phase I - Boston DDD
Conducting the VEC Investigation for a Phase I - Boston DDD
 

Recently uploaded

Sales & Marketing Alignment: How to Synergize for Success
Sales & Marketing Alignment: How to Synergize for SuccessSales & Marketing Alignment: How to Synergize for Success
Sales & Marketing Alignment: How to Synergize for SuccessAggregage
 
Cash Payment 9602870969 Escort Service in Udaipur Call Girls
Cash Payment 9602870969 Escort Service in Udaipur Call GirlsCash Payment 9602870969 Escort Service in Udaipur Call Girls
Cash Payment 9602870969 Escort Service in Udaipur Call GirlsApsara Of India
 
India Consumer 2024 Redacted Sample Report
India Consumer 2024 Redacted Sample ReportIndia Consumer 2024 Redacted Sample Report
India Consumer 2024 Redacted Sample ReportMintel Group
 
Call Girls In Sikandarpur Gurgaon ❤️8860477959_Russian 100% Genuine Escorts I...
Call Girls In Sikandarpur Gurgaon ❤️8860477959_Russian 100% Genuine Escorts I...Call Girls In Sikandarpur Gurgaon ❤️8860477959_Russian 100% Genuine Escorts I...
Call Girls In Sikandarpur Gurgaon ❤️8860477959_Russian 100% Genuine Escorts I...lizamodels9
 
8447779800, Low rate Call girls in Saket Delhi NCR
8447779800, Low rate Call girls in Saket Delhi NCR8447779800, Low rate Call girls in Saket Delhi NCR
8447779800, Low rate Call girls in Saket Delhi NCRashishs7044
 
Marketing Management Business Plan_My Sweet Creations
Marketing Management Business Plan_My Sweet CreationsMarketing Management Business Plan_My Sweet Creations
Marketing Management Business Plan_My Sweet Creationsnakalysalcedo61
 
2024 Numerator Consumer Study of Cannabis Usage
2024 Numerator Consumer Study of Cannabis Usage2024 Numerator Consumer Study of Cannabis Usage
2024 Numerator Consumer Study of Cannabis UsageNeil Kimberley
 
VIP Kolkata Call Girl Howrah 👉 8250192130 Available With Room
VIP Kolkata Call Girl Howrah 👉 8250192130  Available With RoomVIP Kolkata Call Girl Howrah 👉 8250192130  Available With Room
VIP Kolkata Call Girl Howrah 👉 8250192130 Available With Roomdivyansh0kumar0
 
Kenya’s Coconut Value Chain by Gatsby Africa
Kenya’s Coconut Value Chain by Gatsby AfricaKenya’s Coconut Value Chain by Gatsby Africa
Kenya’s Coconut Value Chain by Gatsby Africaictsugar
 
Call Girls Miyapur 7001305949 all area service COD available Any Time
Call Girls Miyapur 7001305949 all area service COD available Any TimeCall Girls Miyapur 7001305949 all area service COD available Any Time
Call Girls Miyapur 7001305949 all area service COD available Any Timedelhimodelshub1
 
Tech Startup Growth Hacking 101 - Basics on Growth Marketing
Tech Startup Growth Hacking 101  - Basics on Growth MarketingTech Startup Growth Hacking 101  - Basics on Growth Marketing
Tech Startup Growth Hacking 101 - Basics on Growth MarketingShawn Pang
 
Global Scenario On Sustainable and Resilient Coconut Industry by Dr. Jelfina...
Global Scenario On Sustainable  and Resilient Coconut Industry by Dr. Jelfina...Global Scenario On Sustainable  and Resilient Coconut Industry by Dr. Jelfina...
Global Scenario On Sustainable and Resilient Coconut Industry by Dr. Jelfina...ictsugar
 
Call Girls In Sikandarpur Gurgaon ❤️8860477959_Russian 100% Genuine Escorts I...
Call Girls In Sikandarpur Gurgaon ❤️8860477959_Russian 100% Genuine Escorts I...Call Girls In Sikandarpur Gurgaon ❤️8860477959_Russian 100% Genuine Escorts I...
Call Girls In Sikandarpur Gurgaon ❤️8860477959_Russian 100% Genuine Escorts I...lizamodels9
 
FULL ENJOY Call girls in Paharganj Delhi | 8377087607
FULL ENJOY Call girls in Paharganj Delhi | 8377087607FULL ENJOY Call girls in Paharganj Delhi | 8377087607
FULL ENJOY Call girls in Paharganj Delhi | 8377087607dollysharma2066
 
Call Us 📲8800102216📞 Call Girls In DLF City Gurgaon
Call Us 📲8800102216📞 Call Girls In DLF City GurgaonCall Us 📲8800102216📞 Call Girls In DLF City Gurgaon
Call Us 📲8800102216📞 Call Girls In DLF City Gurgaoncallgirls2057
 
(Best) ENJOY Call Girls in Faridabad Ex | 8377087607
(Best) ENJOY Call Girls in Faridabad Ex | 8377087607(Best) ENJOY Call Girls in Faridabad Ex | 8377087607
(Best) ENJOY Call Girls in Faridabad Ex | 8377087607dollysharma2066
 
8447779800, Low rate Call girls in Uttam Nagar Delhi NCR
8447779800, Low rate Call girls in Uttam Nagar Delhi NCR8447779800, Low rate Call girls in Uttam Nagar Delhi NCR
8447779800, Low rate Call girls in Uttam Nagar Delhi NCRashishs7044
 
8447779800, Low rate Call girls in Tughlakabad Delhi NCR
8447779800, Low rate Call girls in Tughlakabad Delhi NCR8447779800, Low rate Call girls in Tughlakabad Delhi NCR
8447779800, Low rate Call girls in Tughlakabad Delhi NCRashishs7044
 
BEST Call Girls In Old Faridabad ✨ 9773824855 ✨ Escorts Service In Delhi Ncr,
BEST Call Girls In Old Faridabad ✨ 9773824855 ✨ Escorts Service In Delhi Ncr,BEST Call Girls In Old Faridabad ✨ 9773824855 ✨ Escorts Service In Delhi Ncr,
BEST Call Girls In Old Faridabad ✨ 9773824855 ✨ Escorts Service In Delhi Ncr,noida100girls
 
Market Sizes Sample Report - 2024 Edition
Market Sizes Sample Report - 2024 EditionMarket Sizes Sample Report - 2024 Edition
Market Sizes Sample Report - 2024 EditionMintel Group
 

Recently uploaded (20)

Sales & Marketing Alignment: How to Synergize for Success
Sales & Marketing Alignment: How to Synergize for SuccessSales & Marketing Alignment: How to Synergize for Success
Sales & Marketing Alignment: How to Synergize for Success
 
Cash Payment 9602870969 Escort Service in Udaipur Call Girls
Cash Payment 9602870969 Escort Service in Udaipur Call GirlsCash Payment 9602870969 Escort Service in Udaipur Call Girls
Cash Payment 9602870969 Escort Service in Udaipur Call Girls
 
India Consumer 2024 Redacted Sample Report
India Consumer 2024 Redacted Sample ReportIndia Consumer 2024 Redacted Sample Report
India Consumer 2024 Redacted Sample Report
 
Call Girls In Sikandarpur Gurgaon ❤️8860477959_Russian 100% Genuine Escorts I...
Call Girls In Sikandarpur Gurgaon ❤️8860477959_Russian 100% Genuine Escorts I...Call Girls In Sikandarpur Gurgaon ❤️8860477959_Russian 100% Genuine Escorts I...
Call Girls In Sikandarpur Gurgaon ❤️8860477959_Russian 100% Genuine Escorts I...
 
8447779800, Low rate Call girls in Saket Delhi NCR
8447779800, Low rate Call girls in Saket Delhi NCR8447779800, Low rate Call girls in Saket Delhi NCR
8447779800, Low rate Call girls in Saket Delhi NCR
 
Marketing Management Business Plan_My Sweet Creations
Marketing Management Business Plan_My Sweet CreationsMarketing Management Business Plan_My Sweet Creations
Marketing Management Business Plan_My Sweet Creations
 
2024 Numerator Consumer Study of Cannabis Usage
2024 Numerator Consumer Study of Cannabis Usage2024 Numerator Consumer Study of Cannabis Usage
2024 Numerator Consumer Study of Cannabis Usage
 
VIP Kolkata Call Girl Howrah 👉 8250192130 Available With Room
VIP Kolkata Call Girl Howrah 👉 8250192130  Available With RoomVIP Kolkata Call Girl Howrah 👉 8250192130  Available With Room
VIP Kolkata Call Girl Howrah 👉 8250192130 Available With Room
 
Kenya’s Coconut Value Chain by Gatsby Africa
Kenya’s Coconut Value Chain by Gatsby AfricaKenya’s Coconut Value Chain by Gatsby Africa
Kenya’s Coconut Value Chain by Gatsby Africa
 
Call Girls Miyapur 7001305949 all area service COD available Any Time
Call Girls Miyapur 7001305949 all area service COD available Any TimeCall Girls Miyapur 7001305949 all area service COD available Any Time
Call Girls Miyapur 7001305949 all area service COD available Any Time
 
Tech Startup Growth Hacking 101 - Basics on Growth Marketing
Tech Startup Growth Hacking 101  - Basics on Growth MarketingTech Startup Growth Hacking 101  - Basics on Growth Marketing
Tech Startup Growth Hacking 101 - Basics on Growth Marketing
 
Global Scenario On Sustainable and Resilient Coconut Industry by Dr. Jelfina...
Global Scenario On Sustainable  and Resilient Coconut Industry by Dr. Jelfina...Global Scenario On Sustainable  and Resilient Coconut Industry by Dr. Jelfina...
Global Scenario On Sustainable and Resilient Coconut Industry by Dr. Jelfina...
 
Call Girls In Sikandarpur Gurgaon ❤️8860477959_Russian 100% Genuine Escorts I...
Call Girls In Sikandarpur Gurgaon ❤️8860477959_Russian 100% Genuine Escorts I...Call Girls In Sikandarpur Gurgaon ❤️8860477959_Russian 100% Genuine Escorts I...
Call Girls In Sikandarpur Gurgaon ❤️8860477959_Russian 100% Genuine Escorts I...
 
FULL ENJOY Call girls in Paharganj Delhi | 8377087607
FULL ENJOY Call girls in Paharganj Delhi | 8377087607FULL ENJOY Call girls in Paharganj Delhi | 8377087607
FULL ENJOY Call girls in Paharganj Delhi | 8377087607
 
Call Us 📲8800102216📞 Call Girls In DLF City Gurgaon
Call Us 📲8800102216📞 Call Girls In DLF City GurgaonCall Us 📲8800102216📞 Call Girls In DLF City Gurgaon
Call Us 📲8800102216📞 Call Girls In DLF City Gurgaon
 
(Best) ENJOY Call Girls in Faridabad Ex | 8377087607
(Best) ENJOY Call Girls in Faridabad Ex | 8377087607(Best) ENJOY Call Girls in Faridabad Ex | 8377087607
(Best) ENJOY Call Girls in Faridabad Ex | 8377087607
 
8447779800, Low rate Call girls in Uttam Nagar Delhi NCR
8447779800, Low rate Call girls in Uttam Nagar Delhi NCR8447779800, Low rate Call girls in Uttam Nagar Delhi NCR
8447779800, Low rate Call girls in Uttam Nagar Delhi NCR
 
8447779800, Low rate Call girls in Tughlakabad Delhi NCR
8447779800, Low rate Call girls in Tughlakabad Delhi NCR8447779800, Low rate Call girls in Tughlakabad Delhi NCR
8447779800, Low rate Call girls in Tughlakabad Delhi NCR
 
BEST Call Girls In Old Faridabad ✨ 9773824855 ✨ Escorts Service In Delhi Ncr,
BEST Call Girls In Old Faridabad ✨ 9773824855 ✨ Escorts Service In Delhi Ncr,BEST Call Girls In Old Faridabad ✨ 9773824855 ✨ Escorts Service In Delhi Ncr,
BEST Call Girls In Old Faridabad ✨ 9773824855 ✨ Escorts Service In Delhi Ncr,
 
Market Sizes Sample Report - 2024 Edition
Market Sizes Sample Report - 2024 EditionMarket Sizes Sample Report - 2024 Edition
Market Sizes Sample Report - 2024 Edition
 

A Look at Brexit - Mellott

  • 1. CRE IN A COMPLEX WORLD MAY 2, 2017
  • 2. • State of the Market • What’s influencing markets? • Some perspective: What really matters? • What’s next? CRE Outlook CBRE CRE IN A COMPLEX WORLD2 CRE IN A COMPLEX WORLD WHAT’S THE PLAN?
  • 4. • 2.5 million sq. ft. of take-up in Central London • Prime rents unchanged in the city, but down 2% in West End • 14.7 million sq. ft. of availability • 6.6 million sq. ft. of completed construction expected • Less than 3 million sq. ft. (new) expected in 2018 CBRE CRE IN A COMPLEX WORLD4 CRE IN A COMPLEX WORLD STATE OF THE MARKET - LONDON Source: CBRE Research
  • 5. • Demand began to taper off in 2016 (Q1 2017 19% below 10 year average) • Availability at 10-year average (14.7 million sq. ft.) • Office rents outside of London doing better CBRE CRE IN A COMPLEX WORLD5 CRE IN A COMPLEX WORLD STATE OF THE MARKET - LONDON Source: CBRE Research
  • 6. • The value of real estate transactions in 2016 was down 25% YoY (most since GFC) • Central London investment down only 19% • Not all attributed to referendum • Volumes are down across the board CBRE CRE IN A COMPLEX WORLD6 CRE IN A COMPLEX WORLD STATE OF THE MARKET - LONDON Source: CBRE Research
  • 7. Figure 2: Capital flows into global real estate (US$ billions) Source: CBRE Research, Real Capital Analytics, 2016. 368 586 85 189 191 64 113 78 44 156 171 70 73 284 180 172 329 83 233 396 108 303 458 113 316 566 105 107 501 288 EMEAUS$bn Americas APAC 2007 2008 2009 2010 2011 2012 2013 2014 2015 2016 1,200 1,000 800 600 400 200 0 CAPITAL FLOWS INTO GLOBAL REAL ESTATE (US$ BILLIONS) CBRE CRE IN A COMPLEX WORLD7 Source: CBRE Research, Real Capital Analytics 2016.
  • 9. Figure 3: 2016 prime capital value growth (annual change) Source: CBRE Research, NCREIF, 2016. 4.0% 5.4% 8.6% 8.7% 10.3% 6.6% 4.9% 2.7% 5.1% Office Retail Industrial AMERICAS EMEA ASIA PACIFIC 2016 PRIME CAPITAL VALUE GROWTH (ANNUAL CHANGE) CBRE CRE IN A COMPLEX WORLD9 Source: CBRE Research, NCREIF, 2016.
  • 10. Figure 4: 2016 prime property rent growth (annual change) Source: CBRE Research, 2016. 0.2% 2.3% 1.9% -1.9% 6.6% 4.7% 1.8% 0.0% 0.9% Office Retail Industrial AMERICAS EMEA ASIA PACIFIC 2016 PRIME PROPERTY RENT GROWTH (ANNUAL CHANGE) CBRE CRE IN A COMPLEX WORLD10 Source: CBRE Research, 2016.
  • 11. 6.0 6.5 7.0 7.5 8.0 8.5 9.0 9.5 10.0 2004 2005 2006 2007 2008 2009 2010 2011 2012 2013 2014 2015 2016 2017 2018 2019 2020 OFFICE MARKET* VACANCY RATES (%) CBRE CRE IN A COMPLEX WORLD11 *All major markets where vacancy data are available except Moscow Source: CBRE Research
  • 13. In the UK In the rest of Europe Very Significant Significant Neutral Insignificant Very Insignificant 40% 35% 30% 25% 20% 15% 10% 5% 0% BREXIT BIG DEAL OR RED HERRING? CBRE CRE IN A COMPLEX WORLD13 Source: CBRE European Occupier Survey 2017.
  • 14. Access to sufficiently large/skilled labor pool Exchange rate fluctuations General policy uncertainty Ability to operate in European markets Possible changes to trading arrangements / tariff introductions Other 32% 28% 27% 8% 2% 3% BREXIT WHAT’S THE CONCERN? CBRE CRE IN A COMPLEX WORLD14 Source: CBRE European Occupier Survey 2017.
  • 15. MARCH 29: Article 50 issued APRIL 29: EU Summit signs off negotiating guidelines to Commission MAY 7: French elections JUNE Substantive ‘divorce’ negotiations on money, EU citizens and N Ireland JULY, AUGUST (Go on holiday) SEPTEMBER German elections ARTICLE 50 WHAT HAPPENS NEXT? CBRE CRE IN A COMPLEX WORLD15
  • 16. GREATEST CHALLENGES FOR ORGANIZATIONS FUTURE OPERATIONS EMEA OCCUPIER SURVEY KEY FINDINGS CBRE CRE IN A COMPLEX WORLD16 Source: CBRE Research, 2017; EMEA Occupier Survey Report 2017.
  • 17. - 100 200 300 400 500 600 700 800 900 UK Germany France Sweden Netherlands Spain Italy Norway Finland Denmark Belgium Poland Russia Austria Ireland EUROPEAN CRE INVESTMENT 2003-2016 CBRE CRE IN A COMPLEX WORLD17 Source: CBRE Research 2016.
  • 18. 0% 10% 20% 30% 40% 50% 60% 70% 80% Czech Republic Russia Norway Sweden Poland Ireland Italy Netherlands Spain France Germany UK London 0% 10% 20% 30% 40% 50% 60% 70% 80% Czech Republic Switzerland Portugal Russia Denmark Netherlands Italy Belgium Spain France Germany UK Total investment from North America, % of total KEY DESTINATIONS IN EUROPE TOP COUNTRIES 2013-2016 CBRE CRE IN A COMPLEX WORLD18 Source: CBRE Research 2016. London Total investment from Asia, % of total
  • 20. • London most connected city* • Hosts 40% of European HQ for world’s top companies** CBRE CRE IN A COMPLEX WORLD20 CRE IN A COMPLEX WORLD SOME PERSPECTIVE *Source: Global and World Cities Network **Source: Deloitte
  • 21. • 65,000 people EU-facing financial services • 3% of UK office stock (6 million sq. ft.) • About the level of space leased in Central London every 6 months CBRE CRE IN A COMPLEX WORLD21 CRE IN A COMPLEX WORLD SOME PERSPECTIVE Source: CBRE Research
  • 22. • Top 10 global investment banks 52,000 in London • Could see 27% of those jobs moved • Equal to 5 weeks of leasing in London CBRE CRE IN A COMPLEX WORLD22 CRE IN A COMPLEX WORLD SOME PERSPECTIVE Source: CBRE Research
  • 23. • In 2006 financial services accounted for 41% of Central London leasing (sq. ft.) • In 2016 only 23% • London has diversified • Tech and media (immigration key) CBRE CRE IN A COMPLEX WORLD23 CRE IN A COMPLEX WORLD SOME PERSPECTIVE Source: CBRE Research
  • 24. • London boasts a lot of advantages • Housing, schools, infrastructure and culture • Legal and regulatory environment • Alternatives aren’t clear • Impacts will be over the long term CBRE CRE IN A COMPLEX WORLD24 CRE IN A COMPLEX WORLD SOME PERSPECTIVE
  • 25. CBRE CRE IN A COMPLEX WORLD25 CRE IN A COMPLEX WORLD SOME PERSPECTIVE TRANSPARENCY FX ADVANTAGE SIZELIQUIDITY
  • 26. -6% -4% -2% 0% 2% 4% 6% Y-o-Y % Change Recession Nonfarm Emp. 1981 1982 1983 1984 1985 1986 1987 1988 1989 1990 1991 1992 1993 1994 1995 1996 1997 1998 1999 2000 2001 2002 2003 2004 2005 2006 2007 2008 2009 2010 2011 2012 2013 2014 2015 2017 2016 REAGAN SHOT FALKLANDS WAR US EMBASSY IN BEIRUT BOMBED CHERNOBYL DISASTER GLASTNOST IN USSR BERLIN WALL FALLS US INVADES KUWAIT GULF WAR STARTS FALL OF THE SOVIET UNION EUROPEAN UNION BEGINS BOSNIAN WAR ENDS EUROZONE CREATED 9/11 US INVASION OF IRAQ RUSSO-GEORGIAN WAR OBAMA ELECTED SYRIAN WAR JAPANESE TSUNAMI ISIS EMERGES CRIMEA ANNEXED PARIS ATTACKS BREXIT VOTE NAFTA SIGNED HURRICANE KATRINA BUSH I ELECTED CLINTON ELECTED BUSH II ELECTED TRUMP ELECTED PERSONAL COMPUTER INTRODUCED CRE IN A COMPLEX WORLD GEOPOLITICS MATTER BUT NOT LIKE YOU THINK CBRE CRE IN A COMPLEX WORLD26 Source: CBRE Research; U.S. BLS, Q4 2016.
  • 27. UNEMPLOYMENT THE CYCLE MATTERS CBRE CRE IN A COMPLEX WORLD27 Source: CBRE Research, Macrobond, IMF, WEO. G7 UNEMPLOYMENT RATE (%) 5.0 5.5 6.0 6.5 7.0 7.5 8.0 8.5 9.0 1980 1982 1984 1986 1988 1990 1992 1994 1996 1998 2000 2002 2004 2006 2008 2010 2012 2014 2016
  • 28. OUTLOOK EMPLOYMENT AND INTEREST RATES CBRE CRE IN A COMPLEX WORLD28 Source: CBRE Research, Macrobond.
  • 30. Figure 7: Purchasing activity relative to 2016, global and regional Source: CBRE 2017 Global Investor Intentions Survey. Global EMEA Americas Asia Pacific More than 20% lower Between 10% - 20% lower Between 10% - 20% higher More than 20% higher Up to 10% lower About the same Up to 10% higher % 50 45 40 35 30 25 20 15 10 5 0 PURCHASING ACTIVITY RELATIVE TO 2016 GLOBAL AND REGIONAL CBRE CRE IN A COMPLEX WORLD30 Source: CBRE 2017 Global Investor Intentions Survey.
  • 31. on ORTH C #1 SYDNEY #2 TOKYO #3 SHANGHAI #4 MELBOURNE #5 BRISBANE #6 HONG KONG #1 LONDON #2 BERLIN #3 MADRID #4 AMSTERDAM #5 PARIS #6 WARSAW EMEA ASIA PACIFIC TOP TARGET CITIES BY REGION CBRE CRE IN A COMPLEX WORLD31 Source: CBRE 2017 Global Investor Intentions Survey. Figure 12: Top target cities by region #1 LOS ANGELES #2 DALLAS/FORT WORTH #3 NEW YORK #4 WASHINGTON DC #5 ATLANTA #6 SAN FRANCISCO #7 SEATTLE #1 SYDNEY #2 TOKYO #3 SHANGHAI #4 MELBOURNE #5 BRISBANE #6 HONG KONG #1 LONDON #2 BERLIN #3 MADRID #4 AMSTERDAM #5 PARIS #6 WARSAW AMERICAS EMEA ASIA PACIFIC Source: CBRE 2017 Global Investor Intentions Survey. #1 SYDNEY #2 TOKYO #3 SHANGHAI #4 MELBOURNE ASIA PACIFIC Figure 12: Top target cities by region #1 LOS ANGELES #2 DALLAS/FORT WORTH #3 NEW YORK #4 WASHINGTON DC #5 ATLANTA #6 SAN FRANCISCO #7 SEATTLE #1 SYDNEY #2 TOKYO #3 SHANGHAI #4 MELBOURNE #5 BRISBANE #6 HONG KONG #1 LONDON #2 BERLIN #3 MADRID #4 AMSTERDAM #5 PARIS #6 WARSAW AMERICAS EMEA ASIA PACIFIC Source: CBRE 2017 Global Investor Intentions Survey. Figure 12: Top target cities by region #1 LOS ANGELES #2 DALLAS/FORT WORTH #3 NEW YORK #4 WASHINGTON DC #5 ATLANTA #6 SAN FRANCISCO #7 SEATTLE #1 SYDNEY #2 TOKYO #3 SHANGHAI #4 MELBOURNE #5 BRISBANE #6 HONG KONG #1 LONDON #2 BERLIN #3 MADRID #4 AMSTERDAM #5 PARIS #6 WARSAW AMERICAS EMEA ASIA PACIFIC n RTH #1 SYDNEY #2 TOKYO #3 SHANGHAI #4 MELBOURNE #5 BRISBANE #1 LONDON #2 BERLIN #3 MADRID #4 AMSTERDAM #5 PARIS EMEA ASIA PACIFIC Figure 12: Top target cities by region #1 LOS ANGELES #2 DALLAS/FORT WORTH #3 NEW YORK #4 WASHINGTON DC #5 ATLANTA #6 SAN FRANCISCO #7 SEATTLE #1 SYDNEY #2 TOKYO #3 SHANGHAI #4 MELBOURNE #5 BRISBANE #6 HONG KONG #1 LONDON #2 BERLIN #3 MADRID #4 AMSTERDAM #5 PARIS #6 WARSAW AMERICAS EMEA ASIA PACIFIC Source: CBRE 2017 Global Investor Intentions Survey. Figure 12: Top target cities by region #1 LOS ANGELES #2 DALLAS/FORT WORTH #3 NEW YORK #4 WASHINGTON DC #5 ATLANTA #6 SAN FRANCISCO #7 SEATTLE #1 SYDNEY #2 TOKYO #3 SHANGHAI #4 MELBOURNE #5 BRISBANE #6 HONG KONG #1 LONDON #2 BERLIN #3 MADRID #4 AMSTERDAM #5 PARIS #6 WARSAW AMERICAS EMEA ASIA PACIFIC Source: CBRE 2017 Global Investor Intentions Survey. Figure 12: Top target cities by region #1 LOS ANGELES #2 DALLAS/FORT WORTH #3 NEW YORK #4 WASHINGTON DC #5 ATLANTA #6 SAN FRANCISCO #1 SYDNEY #2 TOKYO #3 SHANGHAI #4 MELBOURNE #5 BRISBANE #6 HONG KONG #1 LONDON #2 BERLIN #3 MADRID #4 AMSTERDAM #5 PARIS #6 WARSAW AMERICAS EMEA ASIA PACIFIC #1 LOS ANGELES #2 DALLAS/FORT WORTH #3 NEW YORK #4 WASHINGTON DC #5 ATLANTA #6 SAN FRANCISCO #7 SEATTLE #1 SYDNEY #2 TOKYO #3 SHANGHAI #4 MELBOURNE #5 BRISBANE #6 HONG KONG #1 LONDON #2 BERLIN #3 MADRID #4 AMSTERDAM #5 PARIS #6 WARSAW AMERICAS EMEA ASIA PACIFIC Source: CBRE 2017 Global Investor Intentions Survey. Figure 12: Top target cities by region #1 LOS ANGELES #2 DALLAS/FORT WORTH #3 NEW YORK #4 WASHINGTON DC #5 ATLANTA #6 SAN FRANCISCO #7 SEATTLE #1 SYDNEY #2 TOKYO #3 SHANGHAI #4 MELBOURNE #5 BRISBANE #6 HONG KONG #1 LONDON #2 BERLIN #3 MADRID #4 AMSTERDAM #5 PARIS #6 WARSAW AMERICAS EMEA ASIA PACIFIC Source: CBRE 2017 Global Investor Intentions Survey. Figure 12: Top target cities by region #1 LOS ANGELES #2 DALLAS/FORT WORTH #3 NEW YORK #4 WASHINGTON DC #5 ATLANTA #6 SAN FRANCISCO #7 SEATTLE #1 SYDNEY #2 TOKYO #3 SHANGHAI #4 MELBOURNE #5 BRISBANE #6 HONG KONG #1 LONDON #2 BERLIN #3 MADRID #4 AMSTERDAM #5 PARIS #6 WARSAW AMERICAS EMEA ASIA PACIFIC Figure 12: Top target cities by region #1 LOS ANGELES #2 DALLAS/FORT WORTH #3 NEW YORK #4 WASHINGTON DC #5 ATLANTA #6 SAN FRANCISCO #7 SEATTLE #1 SYDNEY #2 TOKYO #3 SHANGHAI #4 MELBOURNE #5 BRISBANE #6 HONG KONG #1 LONDON #2 BERLIN #3 MADRID #4 AMSTERDAM #5 PARIS #6 WARSAW AMERICAS EMEA ASIA PACIFIC Source: CBRE 2017 Global Investor Intentions Survey. Figure 12: Top target cities by region #1 LOS ANGELES #2 DALLAS/FORT WORTH #3 NEW YORK #4 WASHINGTON DC #5 ATLANTA #6 SAN FRANCISCO #7 SEATTLE #1 SYDNEY #2 TOKYO #3 SHANGHAI #4 MELBOURNE #5 BRISBANE #6 HONG KONG #1 LONDON #2 BERLIN #3 MADRID #4 AMSTERDAM #5 PARIS #6 WARSAW AMERICAS EMEA ASIA PACIFIC Source: CBRE 2017 Global Investor Intentions Survey. Figure 12: Top target cities by region #1 LOS ANGELES #2 DALLAS/FORT WORTH #3 NEW YORK #4 WASHINGTON DC #5 ATLANTA #6 SAN FRANCISCO #7 SEATTLE #1 SYDNEY #2 TOKYO #3 SHANGHAI #4 MELBOURNE #5 BRISBANE #6 HONG KONG #1 LONDON #2 BERLIN #3 MADRID #4 AMSTERDAM #5 PARIS #6 WARSAW AMERICAS EMEA ASIA PACIFIC Source: CBRE 2017 Global Investor Intentions Survey. Figure 12: Top target cities by region #1 LOS ANGELES #2 DALLAS/FORT WORTH #3 NEW YORK #4 WASHINGTON DC #5 ATLANTA #6 SAN FRANCISCO #7 SEATTLE #1 SYDN #2 TOK #3 SHAN #4 MELB #5 BRISB #6 HON #1 LONDON #2 BERLIN #3 MADRID #4 AMSTERDAM #5 PARIS #6 WARSAW AMERICAS EMEA ASIA PAC Source: CBRE 2017 Global Investor Intentions Survey. #2 DALLAS/FORT WORTH #3 NEW YORK #4 WASHINGTON DC #5 ATLANTA #6 SAN FRANCISCO #7 SEATTLE #2 TOKYO #3 SHANG #4 MELBO #5 BRISBA #6 HONG #2 BERLIN #3 MADRID #4 AMSTERDAM #5 PARIS #6 WARSAW Source: CBRE 2017 Global Investor Intentions Survey. #3 NEW YORK #4 WASHINGTON DC #5 ATLANTA #6 SAN FRANCISCO #7 SEATTLE #3 MADR #4 AMST #5 PARIS #6 WARS Source: CBRE 2017 Global Investor Intentions Survey. #3 NEW YORK #4 WASHINGTON DC #5 ATLANTA #6 SAN FRANCISCO #7 SEATTLE #3 SHANGHAI #4 MELBOURNE #5 BRISBANE #6 HONG KONG #3 MADRID #4 AMSTERDAM #5 PARIS #6 WARSAW Source: CBRE 2017 Global Investor Intentions Survey. AMERICAS EMEA ASIA PACIFIC
  • 32. Source: CBRE 2017 Global Investor Intentions Survey. 79% DIRECT 26% DEVELOPMENT FUNDING 8% CORPORATE AQUISITIONS 7% OTHER EQUITY 7% OTHER DEBTS 49% PARTNERSHIP / JOINT VENTURE / PARTIAL INTERESTS 22% LISTED REAL ESTATE (INCLUDING LISTED REITS) PREFERED INVESTOR VEHICLES 2016 VERSUS 2017 CBRE CRE IN A COMPLEX WORLD32 Source: CBRE 2017 Global Investor Intentions Survey. Figure 15: Preferred investor vehicles Source: CBRE 2017 Global Investor Intentions Survey. 79% DIRECT 26% PROPERTY FUND 26% DEVELOPMENT FUNDING 16% PRIVATE DEBT 8% CORPORATE AQUISITIONS 7% OTHER EQUITY 7% OTHER DEBTS 5% CMBS 49% PARTNERSHIP / JOINT VENTURE / PARTIAL INTERESTS 22% LISTED REAL ESTATE (INCLUDING LISTED REITS) Figure 15: Preferred investor vehicles 79% DIRECT 26% PROPERTY FUND 26% DEVELOPMENT FUNDING 16% PRIVATE DEBT 8% CORPORATE AQUISITIONS 7% OTHER EQUITY 7% OTHER DEBTS 5% CMBS 49% PARTNERSHIP / JOINT VENTURE / PARTIAL INTERESTS 22% LISTED REAL ESTATE (INCLUDING LISTED REITS) 26% PROPERTY FUND 16% PRIVATE DEBT 7% OTHER DEBTS 5% CMBS Figure 15: Preferred investor vehicles Source: CBRE 2017 Global Investor Intentions Survey. 79% DIRECT 26% PROPERTY FUND 26% DEVELOPMENT FUNDING 16% PRIVATE DEBT 8% CORPORATE AQUISITIONS 7% OTHER EQUITY 7% OTHER DEBTS 5% CMBS 49% PARTNERSHIP / JOINT VENTURE / PARTIAL INTERESTS 22% LISTED REAL ESTATE (INCLUDING LISTED REITS) Figure 15: Preferred investor vehicles Source: CBRE 2017 Global Investor Intentions Survey. 79% DIRECT 26% PROPERTY FUND 26% DEVELOPMENT FUNDING 16% PRIVATE DEBT 8% CORPORATE AQUISITIONS 7% OTHER EQUITY 7% OTHER DEBTS 5% CMBS 49% PARTNERSHIP / JOINT VENTURE / PARTIAL INTERESTS 22% LISTED REAL ESTATE (INCLUDING LISTED REITS) Figure 15: Preferred investor vehicles Source: CBRE 2017 Global Investor Intentions Survey. 79% DIRECT 26% PROPERTY FUND 26% DEVELOPMENT FUNDING 16% PRIVATE DEBT 8% CORPORATE AQUISITIONS 7% OTHER EQUITY 7% OTHER DEBTS 5% CMBS 49% PARTNERSHIP / JOINT VENTURE / PARTIAL INTERESTS 22% LISTED REAL ESTATE (INCLUDING LISTED REITS) Source: CBRE 2017 Global Investor Intentions Survey. 79% DIRECT 26% DEVELOPMENT FUNDING 8% CORPORATE AQUISITIONS 7% OTHER EQUITY 7% OTHER DEBTS 49% PARTNERSHIP / JOINT VENTURE / PARTIAL INTERESTS 22% LISTED REAL ESTATE (INCLUDING LISTED REITS)
  • 33. Source: CBRE 2017 Global Investor Intentions Survey. Figure 16: Investors main motivation for investing in real estate 2017 Yield relative to other asset classes Higher income return than other assets classes Expectation of better capital value growth than asset classes Other Hedge against inflation Asset class diversification Steady income stream from rents % 0 5 10 15 20 25 30 35 30 20 15 Geographic diversification 7 2 0 0 20 Yield relative to cost of debt (positive leverage advantage) 6 INVESTOR MOTIVATION WHY INVEST IN REAL ESTATE? CBRE CRE IN A COMPLEX WORLD33 Source: CBRE 2017 Global Investor Intentions Survey.
  • 34. Source: CBRE 2017 Global Investor Intentions Survey. Figure 17: Investor main obstacles to purchase 2017 Asset pricing Availability of assets Competition from other investors Low market transparency Other Currency risk Tax Deflation % 0 6010 3020 40 50 48 25 16 3 2 2 1 1 1 0 Availability and/ or cost of debt Lack of investment partners INVESTOR CHALLENGES MAIN OBSTACLES TO PURCHASE CBRE CRE IN A COMPLEX WORLD34 Source: CBRE 2017 Global Investor Intentions Survey.
  • 35. Figure 18: Investor main concerns 2017 A global economic shock undermining occupier demand Faster than expected, a bubble waiting to burst Overbuilding leading to excess supply Property is overpriced, a bubble waiting to burst A local economic shock undermiming occupier demand Local politcal instability Some other property market related shock Higher than expected owners Other Distressed sales by existing owners Deflation % 0 5 10 15 20 25 Global political instability (conflict and or terrorism) A change of government policy that makes property less attractive 22 6 2 1 1 1 6 4 21 10 10 15 0 Source: CBRE 2017 Global Investor Intentions Survey. INVESTOR CHALLENGES MAIN CONCERNS CBRE CRE IN A COMPLEX WORLD35 Source: CBRE 2017 Global Investor Intentions Survey.
  • 37. • Europe currently well-positioned cyclically • Late cycle • Some room to run • Politics increasingly important, but not how you think • Watch interest rates and FX CBRE CRE IN A COMPLEX WORLD37 CONCLUSION
  • 38. THE WORLD AT AN INFLECTION POINT CBRE CRE IN A COMPLEX WORLD38
  • 39. THANK YOU DARIN MELLOTT Director, Research and Analysis CBRE