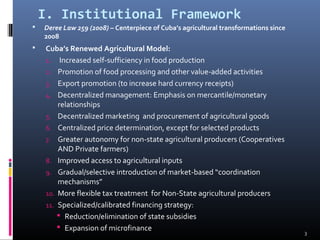
1) The document outlines Cuba's agricultural reforms since 2008 that aimed to increase food self-sufficiency and exports through decentralized management and greater autonomy for non-state farmers.
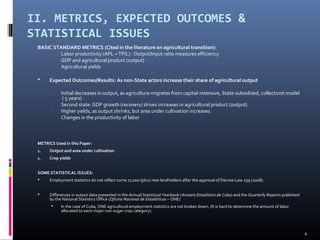
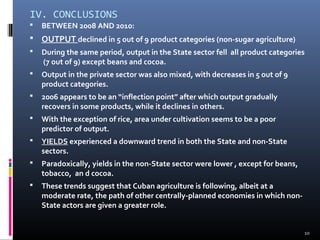
2) Preliminary findings show that between 2008-2010, agricultural output declined in most crop categories in both state and non-state sectors, and yields experienced downward trends across sectors.
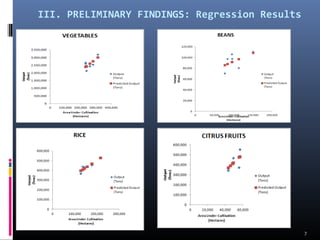
3) Regression analysis found area under cultivation was a significant predictor of output for rice only, suggesting it is a poor predictor for most crops.


![Asystent.osoby.niepelnosprawnej 346[02] o1.05_u](https://cdn.slidesharecdn.com/ss_thumbnails/asystent-160816110141-thumbnail.jpg?width=640&height=640&fit=bounds)


