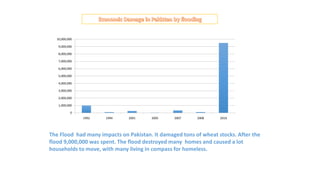
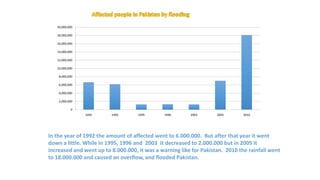
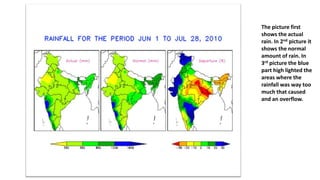
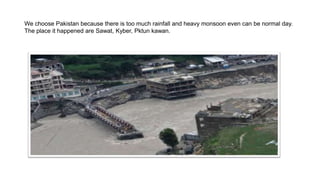
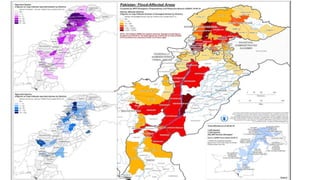
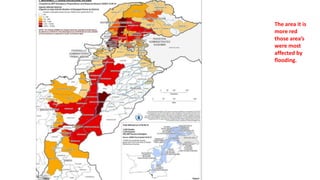
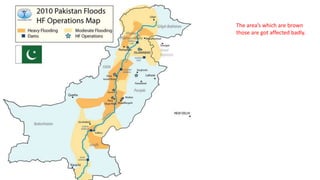
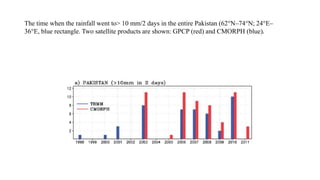
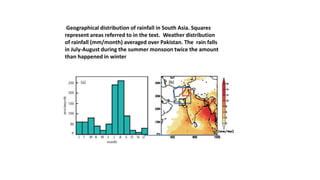
FLOODING

by Mariam Ikram
10,000,000

   9,000,000

   8,000,000

   7,000,000

   6,000,000

   5,000,000

   4,000,000

   3,000,000

   2,000,000

   1,000,000

          0
               1992   1994    2001     2005     2007     2008     2010


The Flood had many impacts on Pakistan. It damaged tons of wheat stocks. After the
flood 9,000,000 was spent. The flood destroyed many homes and caused a lot
households to move, with many living in compass for homeless.
20,000,000

   18,000,000

   16,000,000

   14,000,000

   12,000,000

   10,000,000

    8,000,000

    6,000,000

    4,000,000

    2,000,000

           0
                1992     1992       1995       1996      2003       2005       2010


In the year of 1992 the amount of affected went to 6.000.000. But after that year it went
down a little. While in 1995, 1996 and 2003 it decreased to 2.000.000 but in 2005 it
increased and went up to 8.000.000, it was a warning like for Pakistan. 2010 the rainfall went
to 18.000.000 and caused an overflow, and flooded Pakistan.
The picture first
shows the actual
rain. In 2nd picture it
shows the normal
amount of rain. In
3rd picture the blue
part high lighted the
areas where the
rainfall was way too
much that caused
and an overflow.
We choose Pakistan because there is too much rainfall and heavy monsoon even can be normal day.
The place it happened are Sawat, Kyber, Pktun kawan.
The area it is
more red
those area’s
were most
affected by
flooding.
The area’s which are brown
those are got affected badly.
The time when the rainfall went to> 10 mm/2 days in the entire Pakistan (62°N–74°N; 24°E–
36°E, blue rectangle. Two satellite products are shown: GPCP (red) and CMORPH (blue).
Geographical distribution of rainfall in South Asia. Squares
represent areas referred to in the text. Weather distribution
of rainfall (mm/month) averaged over Pakistan. The rain falls
in July-August during the summer monsoon twice the amount
than happened in winter

Mariam

  • 1.
  • 2.
    10,000,000 9,000,000 8,000,000 7,000,000 6,000,000 5,000,000 4,000,000 3,000,000 2,000,000 1,000,000 0 1992 1994 2001 2005 2007 2008 2010 The Flood had many impacts on Pakistan. It damaged tons of wheat stocks. After the flood 9,000,000 was spent. The flood destroyed many homes and caused a lot households to move, with many living in compass for homeless.
  • 3.
    20,000,000 18,000,000 16,000,000 14,000,000 12,000,000 10,000,000 8,000,000 6,000,000 4,000,000 2,000,000 0 1992 1992 1995 1996 2003 2005 2010 In the year of 1992 the amount of affected went to 6.000.000. But after that year it went down a little. While in 1995, 1996 and 2003 it decreased to 2.000.000 but in 2005 it increased and went up to 8.000.000, it was a warning like for Pakistan. 2010 the rainfall went to 18.000.000 and caused an overflow, and flooded Pakistan.
  • 4.
    The picture first showsthe actual rain. In 2nd picture it shows the normal amount of rain. In 3rd picture the blue part high lighted the areas where the rainfall was way too much that caused and an overflow.
  • 5.
    We choose Pakistanbecause there is too much rainfall and heavy monsoon even can be normal day. The place it happened are Sawat, Kyber, Pktun kawan.
  • 7.
    The area itis more red those area’s were most affected by flooding.
  • 8.
    The area’s whichare brown those are got affected badly.
  • 9.
    The time whenthe rainfall went to> 10 mm/2 days in the entire Pakistan (62°N–74°N; 24°E– 36°E, blue rectangle. Two satellite products are shown: GPCP (red) and CMORPH (blue).
  • 10.
    Geographical distribution ofrainfall in South Asia. Squares represent areas referred to in the text. Weather distribution of rainfall (mm/month) averaged over Pakistan. The rain falls in July-August during the summer monsoon twice the amount than happened in winter

Editor's Notes

  • #8 The area it is red it was the most affected areas by flooding.