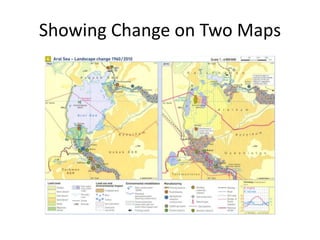
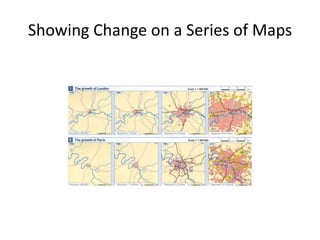
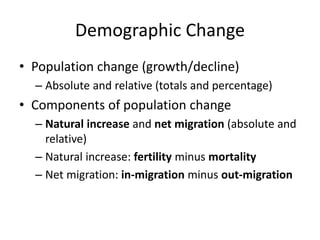
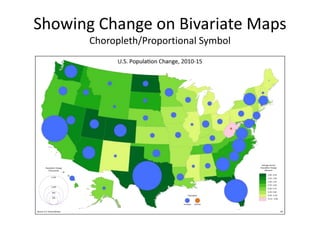
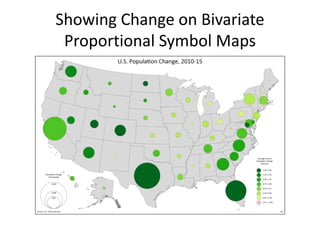
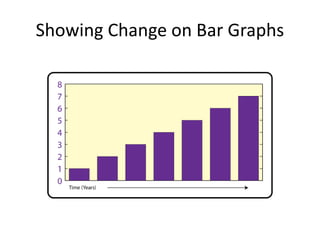
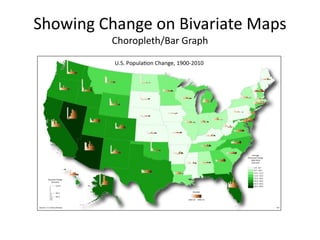
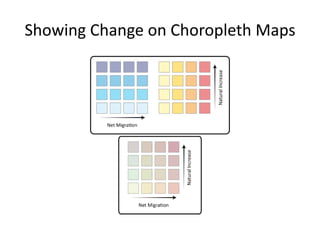
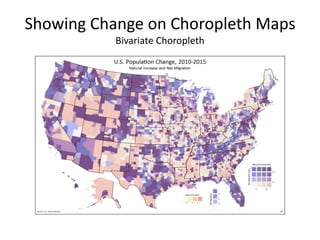
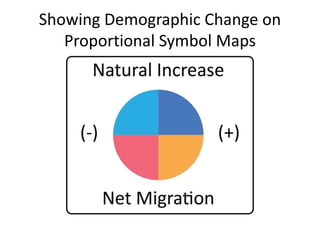
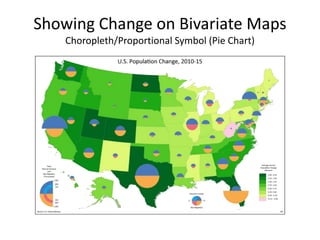
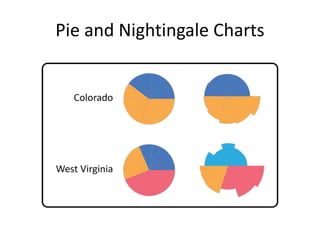
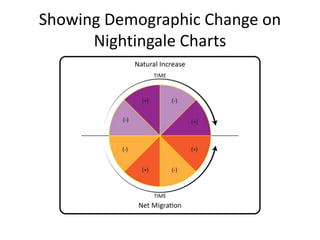
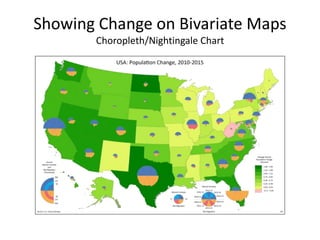
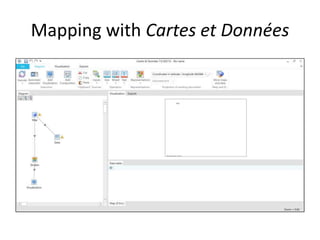
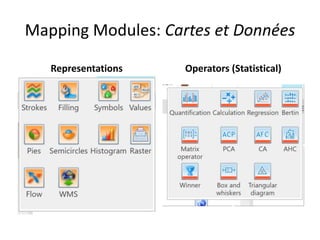
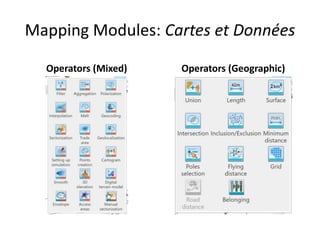
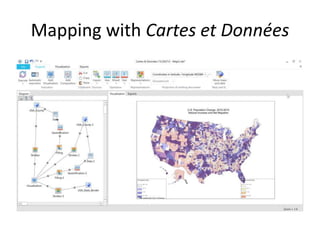
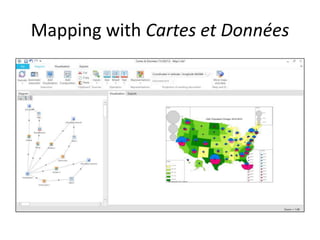
This document discusses various methods for mapping demographic change over time using Cartes et Données. It describes showing change on two maps side by side, on a series of maps, and using thematic maps, choropleth maps, bivariate maps, bar graphs, proportional symbol maps, and Nightingale charts to represent population change, components of change, and different variables. It also discusses using Cartes et Données mapping modules and various statistical, mixed, and geographic operators to map demographic change.