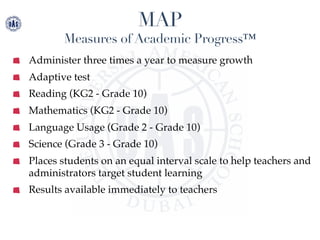
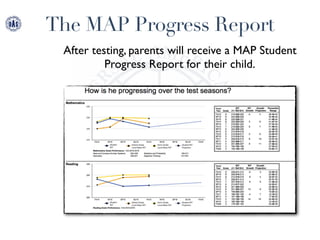
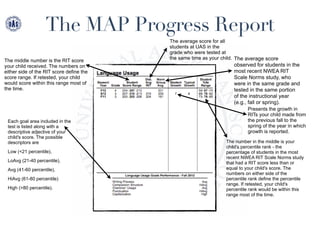
Universal American School
Dubai
MAP Presentation
September 2016
Presenter: Amanda DeCardy
MAP
Measures of Academic Progress™
Administer three times a year to measure growth
Adaptive test
Reading (KG2 - Grade 10)
Mathematics (KG2 - Grade 10)
Language Usage (Grade 2 - Grade 10)
Science (Grade 3 - Grade 10)
Places students on an equal interval scale to help teachers and
administrators target student learning
Results available immediately to teachers
IOWA
Most students are in the 50th percentile
Average
The RIT Score
Measures of Academic Progress™
Results are given in a Rasch UnIT (RIT) Score
which relates directly to the curriculum scale in
each subject area.
RIT scores range from about 100 - 300.
Third graders typically start at the 180 - 200 level
Students typically progress to the 220 - 260 scale
in high school
UAS Dubai RIT Scores Against
Normative Data
As a school we compare ourselves overall to US schools,
international schools and schools in our geographical region.
The MAP Progress Report
After testing, parents will receive a MAP Student
Progress Report for their child.
The MAP Progress Report
The middle number is the RIT score
your child received. The numbers on
either side of the RIT score define the
score range. If retested, your child
would score within this range most of
the time.
The average score for all
students at UAS in the
grade who were tested at
the same time as your child. The average score
observed for students in the
most recent NWEA RIT
Scale Norms study, who
were in the same grade and
tested in the same portion
of the instructional year
(e.g., fall or spring).
Presents the growth in
RITs your child made from
the previous fall to the
spring of the year in which
growth is reported.
The number in the middle is your
child's percentile rank - the
percentage of students in the most
recent NWEA RIT Scale Norms study
that had a RIT score less than or
equal to your child's score. The
numbers on either side of the
percentile rank define the percentile
range. If retested, your child's
percentile rank would be within this
range most of the time.
Each goal area included in the
test is listed along with a
descriptive adjective of your
child's score. The possible
descriptors are
Low (<21 percentile),
LoAvg (21-40 percentile),
Avg (41-60 percentile),
HiAvg (61-80 percentile)
High (>80 percentile).
The MAP Progress Report
Negative Growth in a Snapshot...
Source: http://www.nwea.org/support/article/554
Students took too little time
25 seconds on a question is not enough time...
Students were not engaged during the test...
Effort fluctuates
When we retest...
10 RIT points or greater
UAS MAP Parent Resource
http://sites.uasdubai.ae/uasdubaies/map-­‐resource-­‐page/	


MAP Parent Presentation - Universal American School

  • 1.
    Universal American School Dubai MAPPresentation September 2016 Presenter: Amanda DeCardy
  • 2.
    MAP Measures of AcademicProgress™ Administer three times a year to measure growth Adaptive test Reading (KG2 - Grade 10) Mathematics (KG2 - Grade 10) Language Usage (Grade 2 - Grade 10) Science (Grade 3 - Grade 10) Places students on an equal interval scale to help teachers and administrators target student learning Results available immediately to teachers
  • 3.
    IOWA Most students arein the 50th percentile Average
  • 4.
    The RIT Score Measuresof Academic Progress™ Results are given in a Rasch UnIT (RIT) Score which relates directly to the curriculum scale in each subject area. RIT scores range from about 100 - 300. Third graders typically start at the 180 - 200 level Students typically progress to the 220 - 260 scale in high school
  • 5.
    UAS Dubai RITScores Against Normative Data As a school we compare ourselves overall to US schools, international schools and schools in our geographical region.
  • 6.
    The MAP ProgressReport After testing, parents will receive a MAP Student Progress Report for their child.
  • 7.
    The MAP ProgressReport The middle number is the RIT score your child received. The numbers on either side of the RIT score define the score range. If retested, your child would score within this range most of the time. The average score for all students at UAS in the grade who were tested at the same time as your child. The average score observed for students in the most recent NWEA RIT Scale Norms study, who were in the same grade and tested in the same portion of the instructional year (e.g., fall or spring). Presents the growth in RITs your child made from the previous fall to the spring of the year in which growth is reported. The number in the middle is your child's percentile rank - the percentage of students in the most recent NWEA RIT Scale Norms study that had a RIT score less than or equal to your child's score. The numbers on either side of the percentile rank define the percentile range. If retested, your child's percentile rank would be within this range most of the time. Each goal area included in the test is listed along with a descriptive adjective of your child's score. The possible descriptors are Low (<21 percentile), LoAvg (21-40 percentile), Avg (41-60 percentile), HiAvg (61-80 percentile) High (>80 percentile).
  • 8.
    The MAP ProgressReport Negative Growth in a Snapshot... Source: http://www.nwea.org/support/article/554 Students took too little time 25 seconds on a question is not enough time... Students were not engaged during the test... Effort fluctuates When we retest... 10 RIT points or greater
  • 9.
    UAS MAP ParentResource http://sites.uasdubai.ae/uasdubaies/map-­‐resource-­‐page/