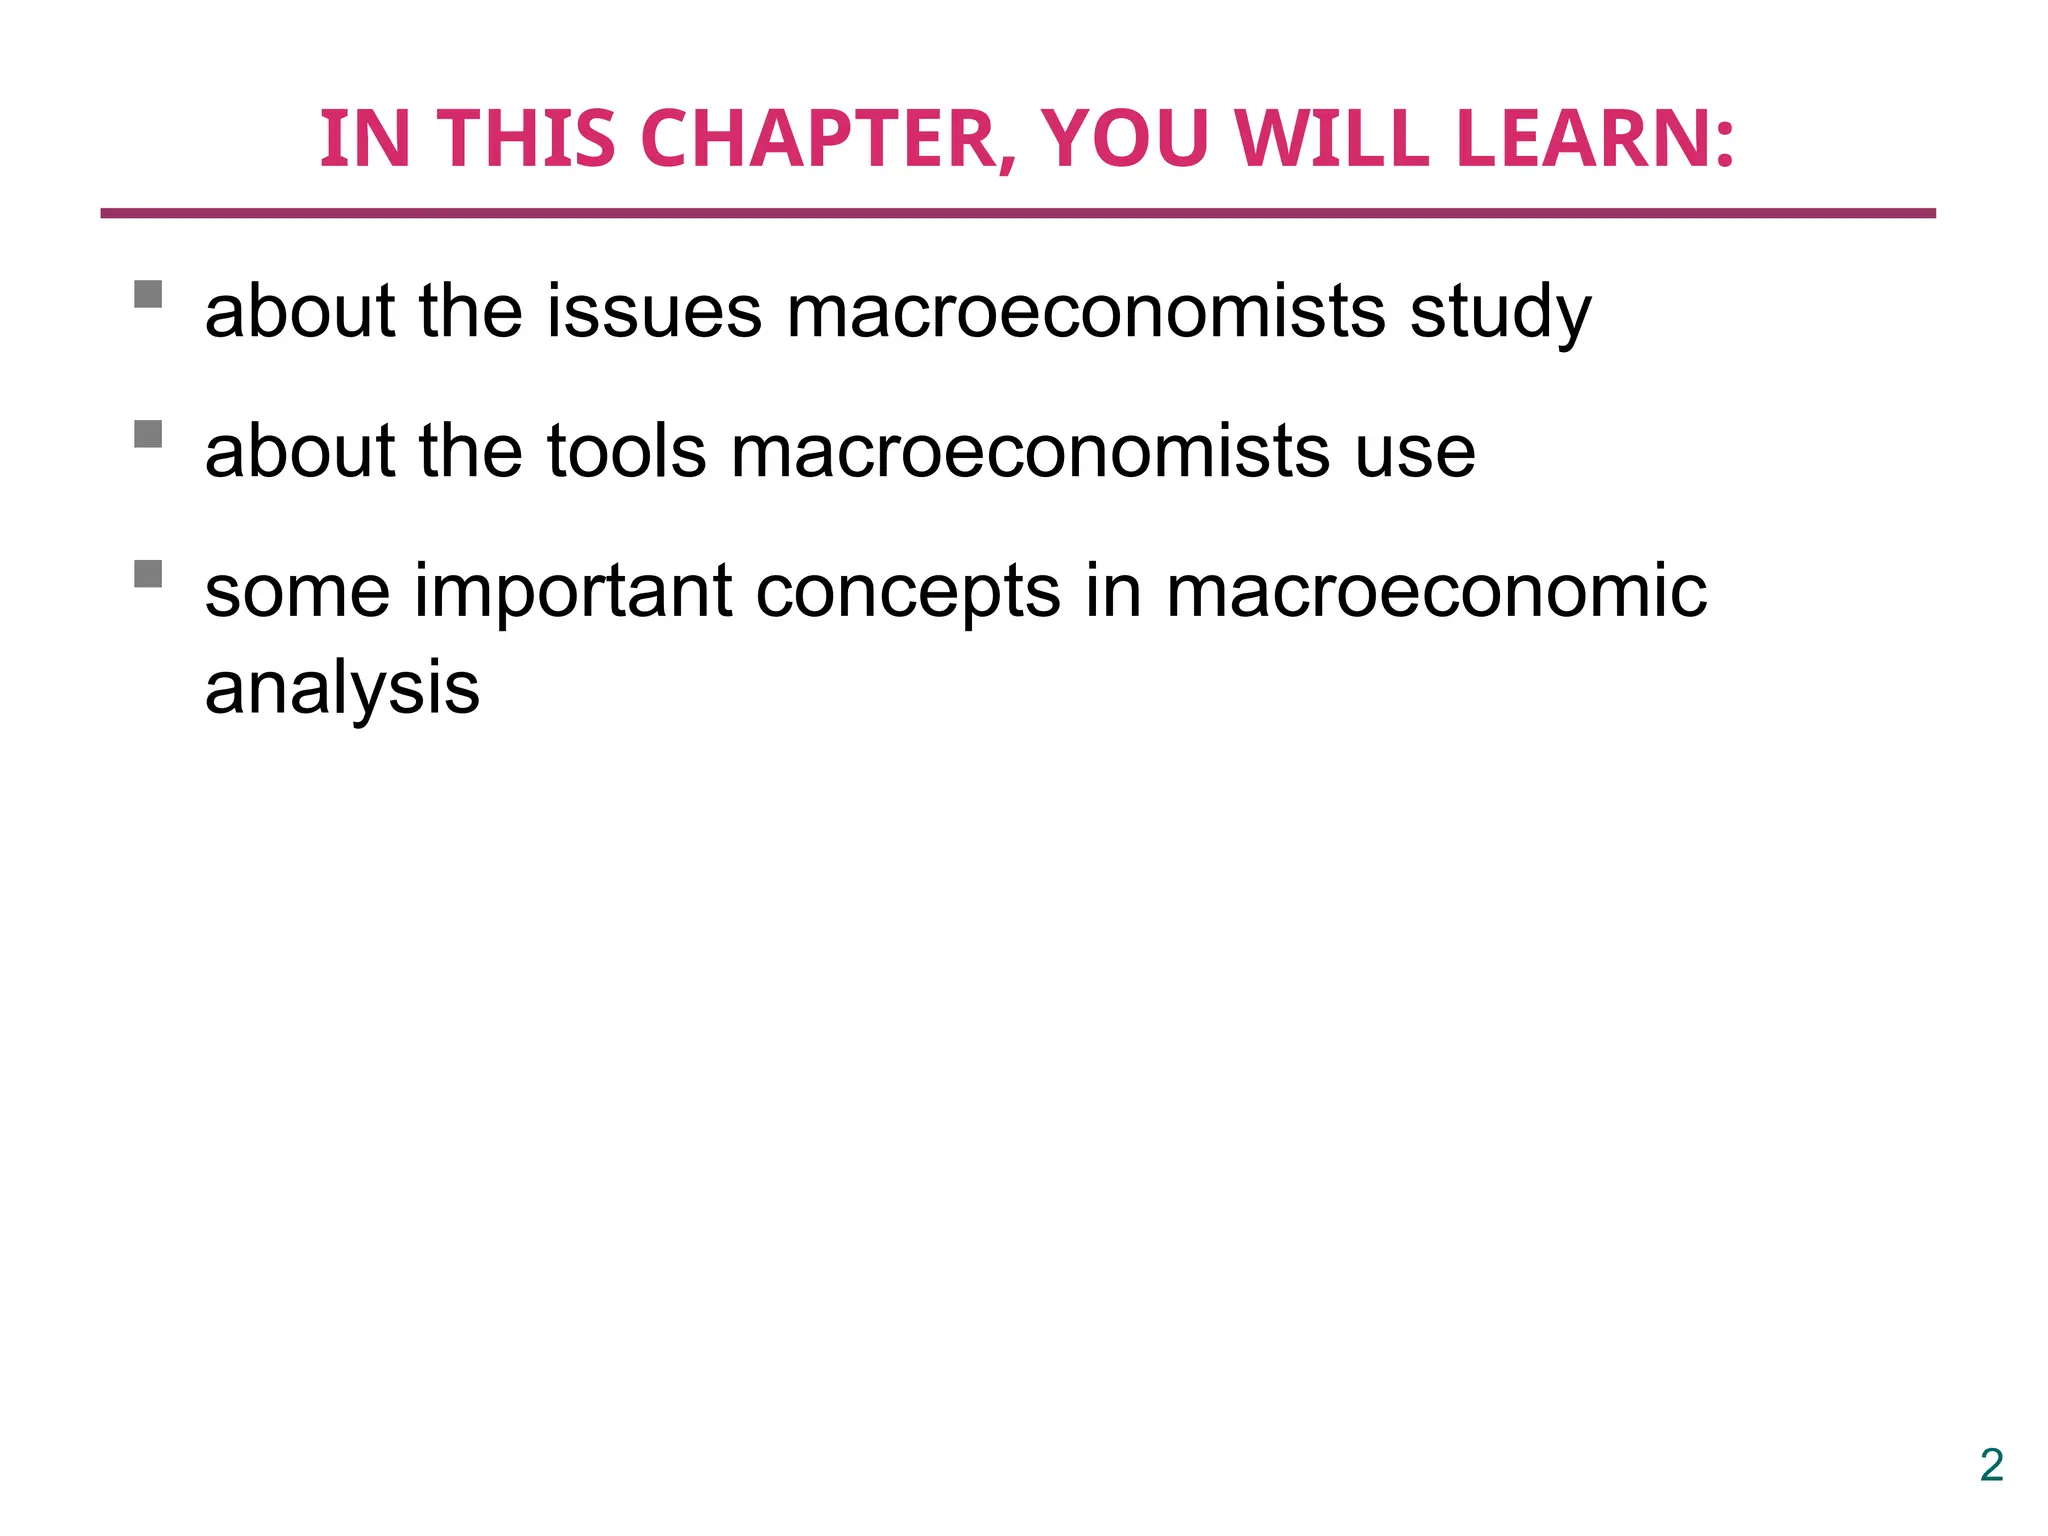
IN THIS CHAPTER,YOU WILL LEARN:
about the issues macroeconomists study
about the tools macroeconomists use
some important concepts in macroeconomic
analysis
2
3.
3
CHAPTER 1 TheScience of Macroeconomics
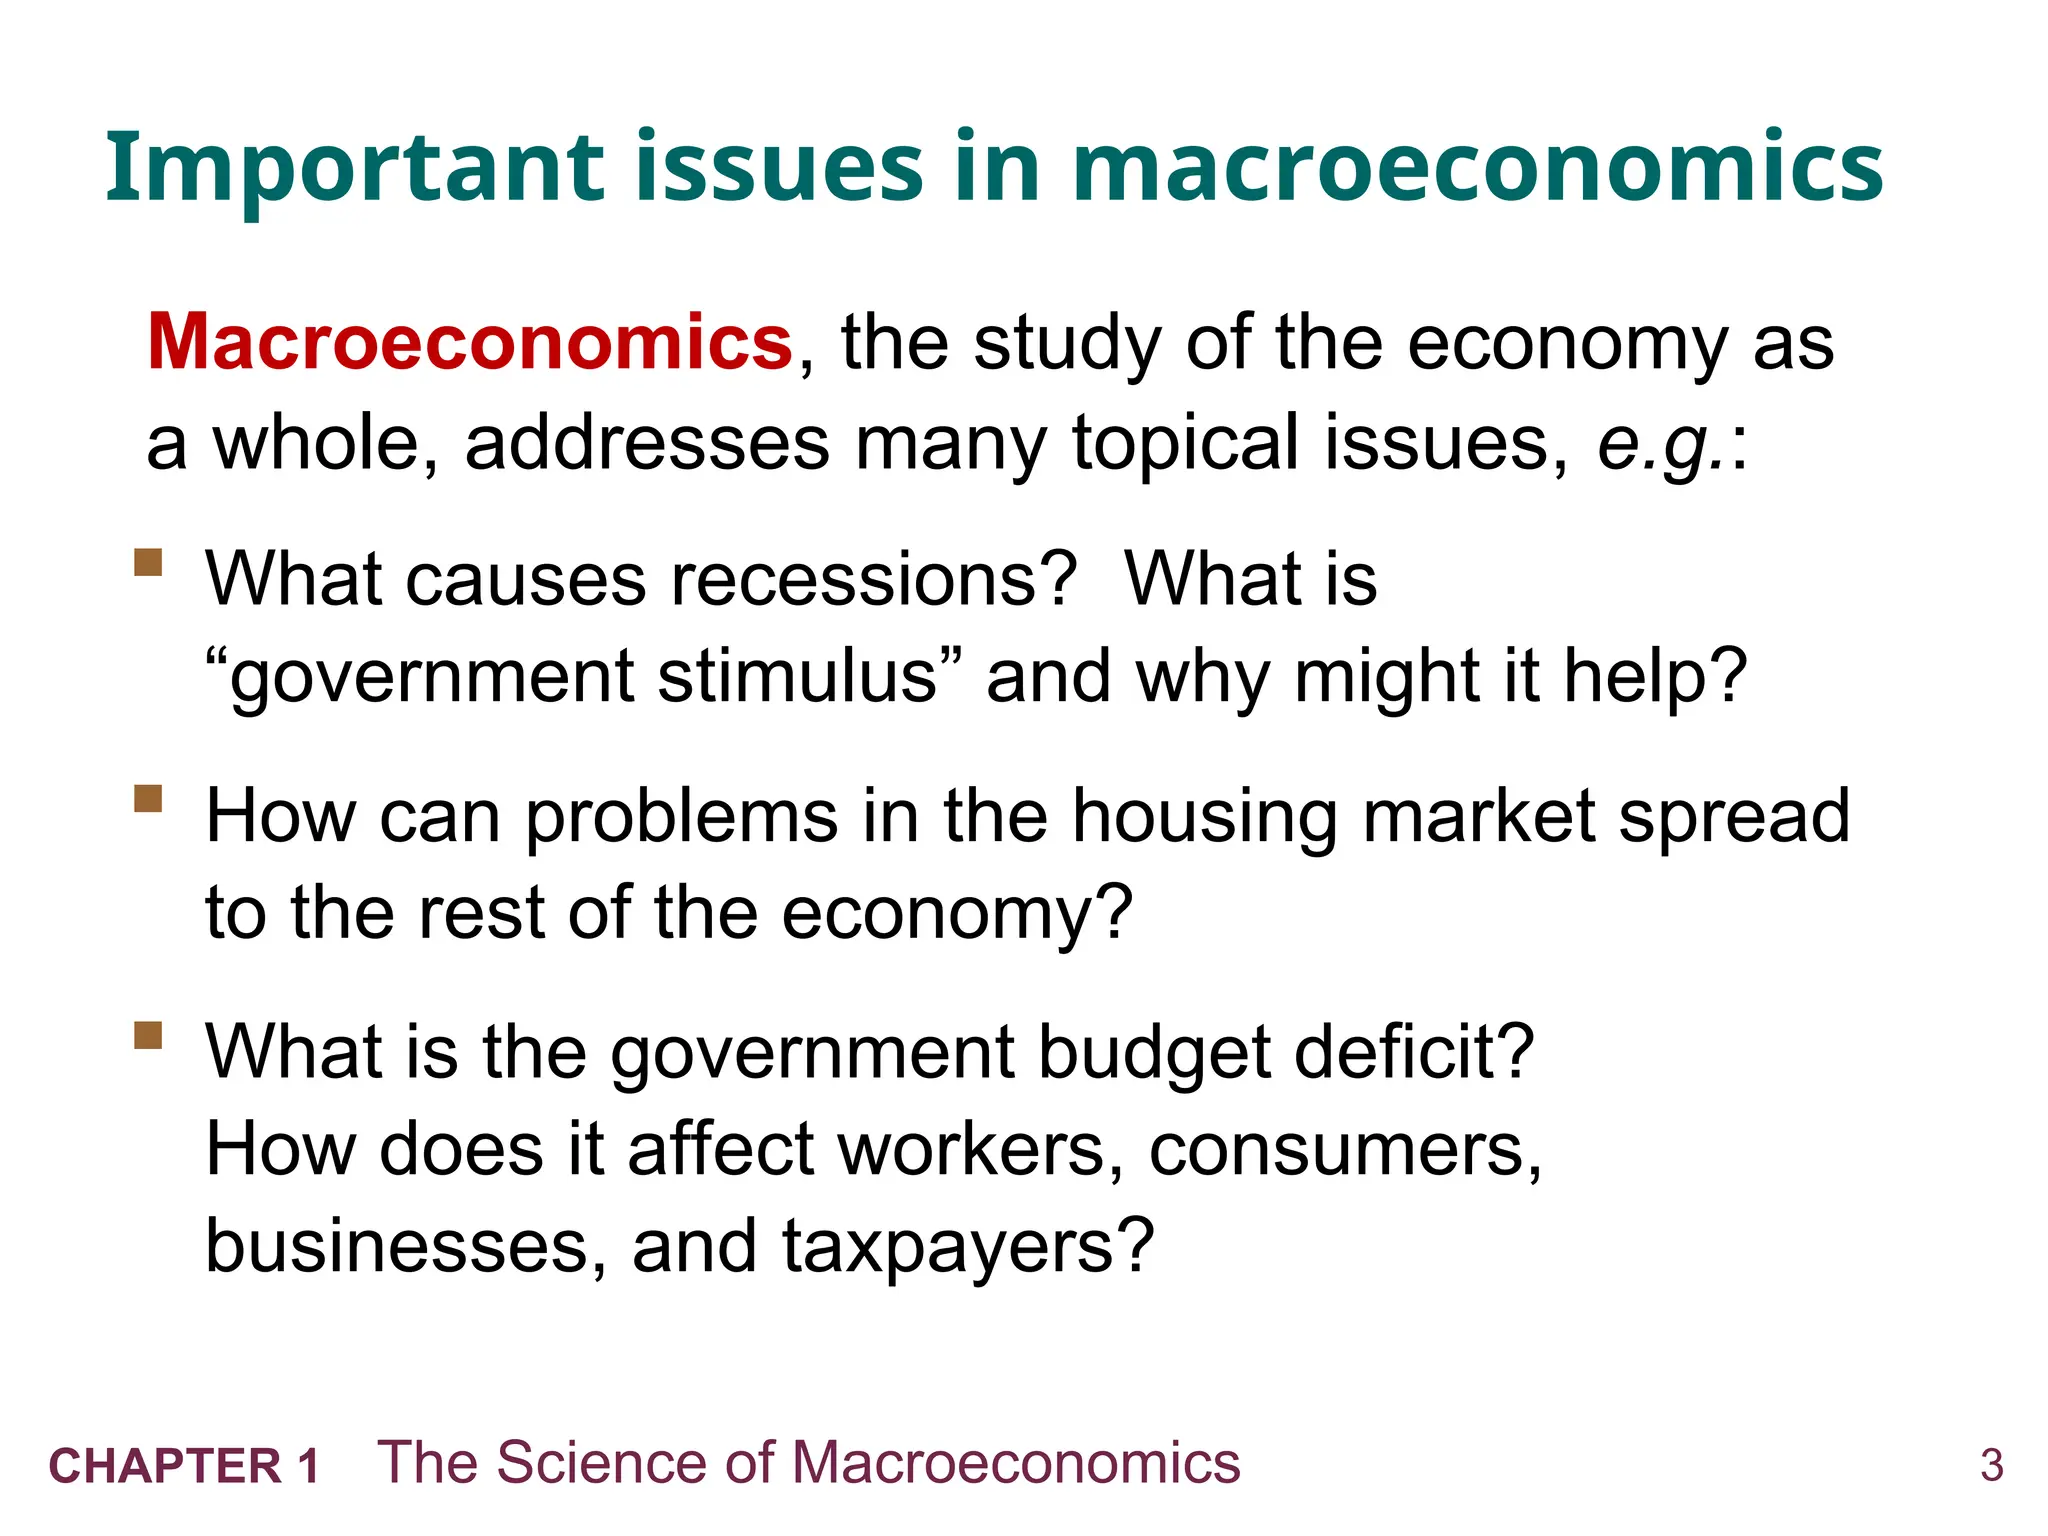
Important issues in macroeconomics
What causes recessions? What is
“government stimulus” and why might it help?
How can problems in the housing market spread
to the rest of the economy?
What is the government budget deficit?
How does it affect workers, consumers,
businesses, and taxpayers?
Macroeconomics, the study of the economy as
a whole, addresses many topical issues, e.g.:
4.
4
CHAPTER 1 TheScience of Macroeconomics
Important issues in macroeconomics
Why does the cost of living keep rising?
Why are so many countries poor? What policies
might help them grow out of poverty?
What is the trade deficit? How does it affect the
country’s well-being?
Macroeconomics, the study of the economy as
a whole, addresses many topical issues, e.g.:
13
CHAPTER 1 TheScience of Macroeconomics
Economic models
…are simplified versions of a more complex reality
irrelevant details are stripped away
…are used to
show relationships between variables
explain the economy’s behavior
devise policies to improve economic
performance
14.
14
CHAPTER 1 TheScience of Macroeconomics
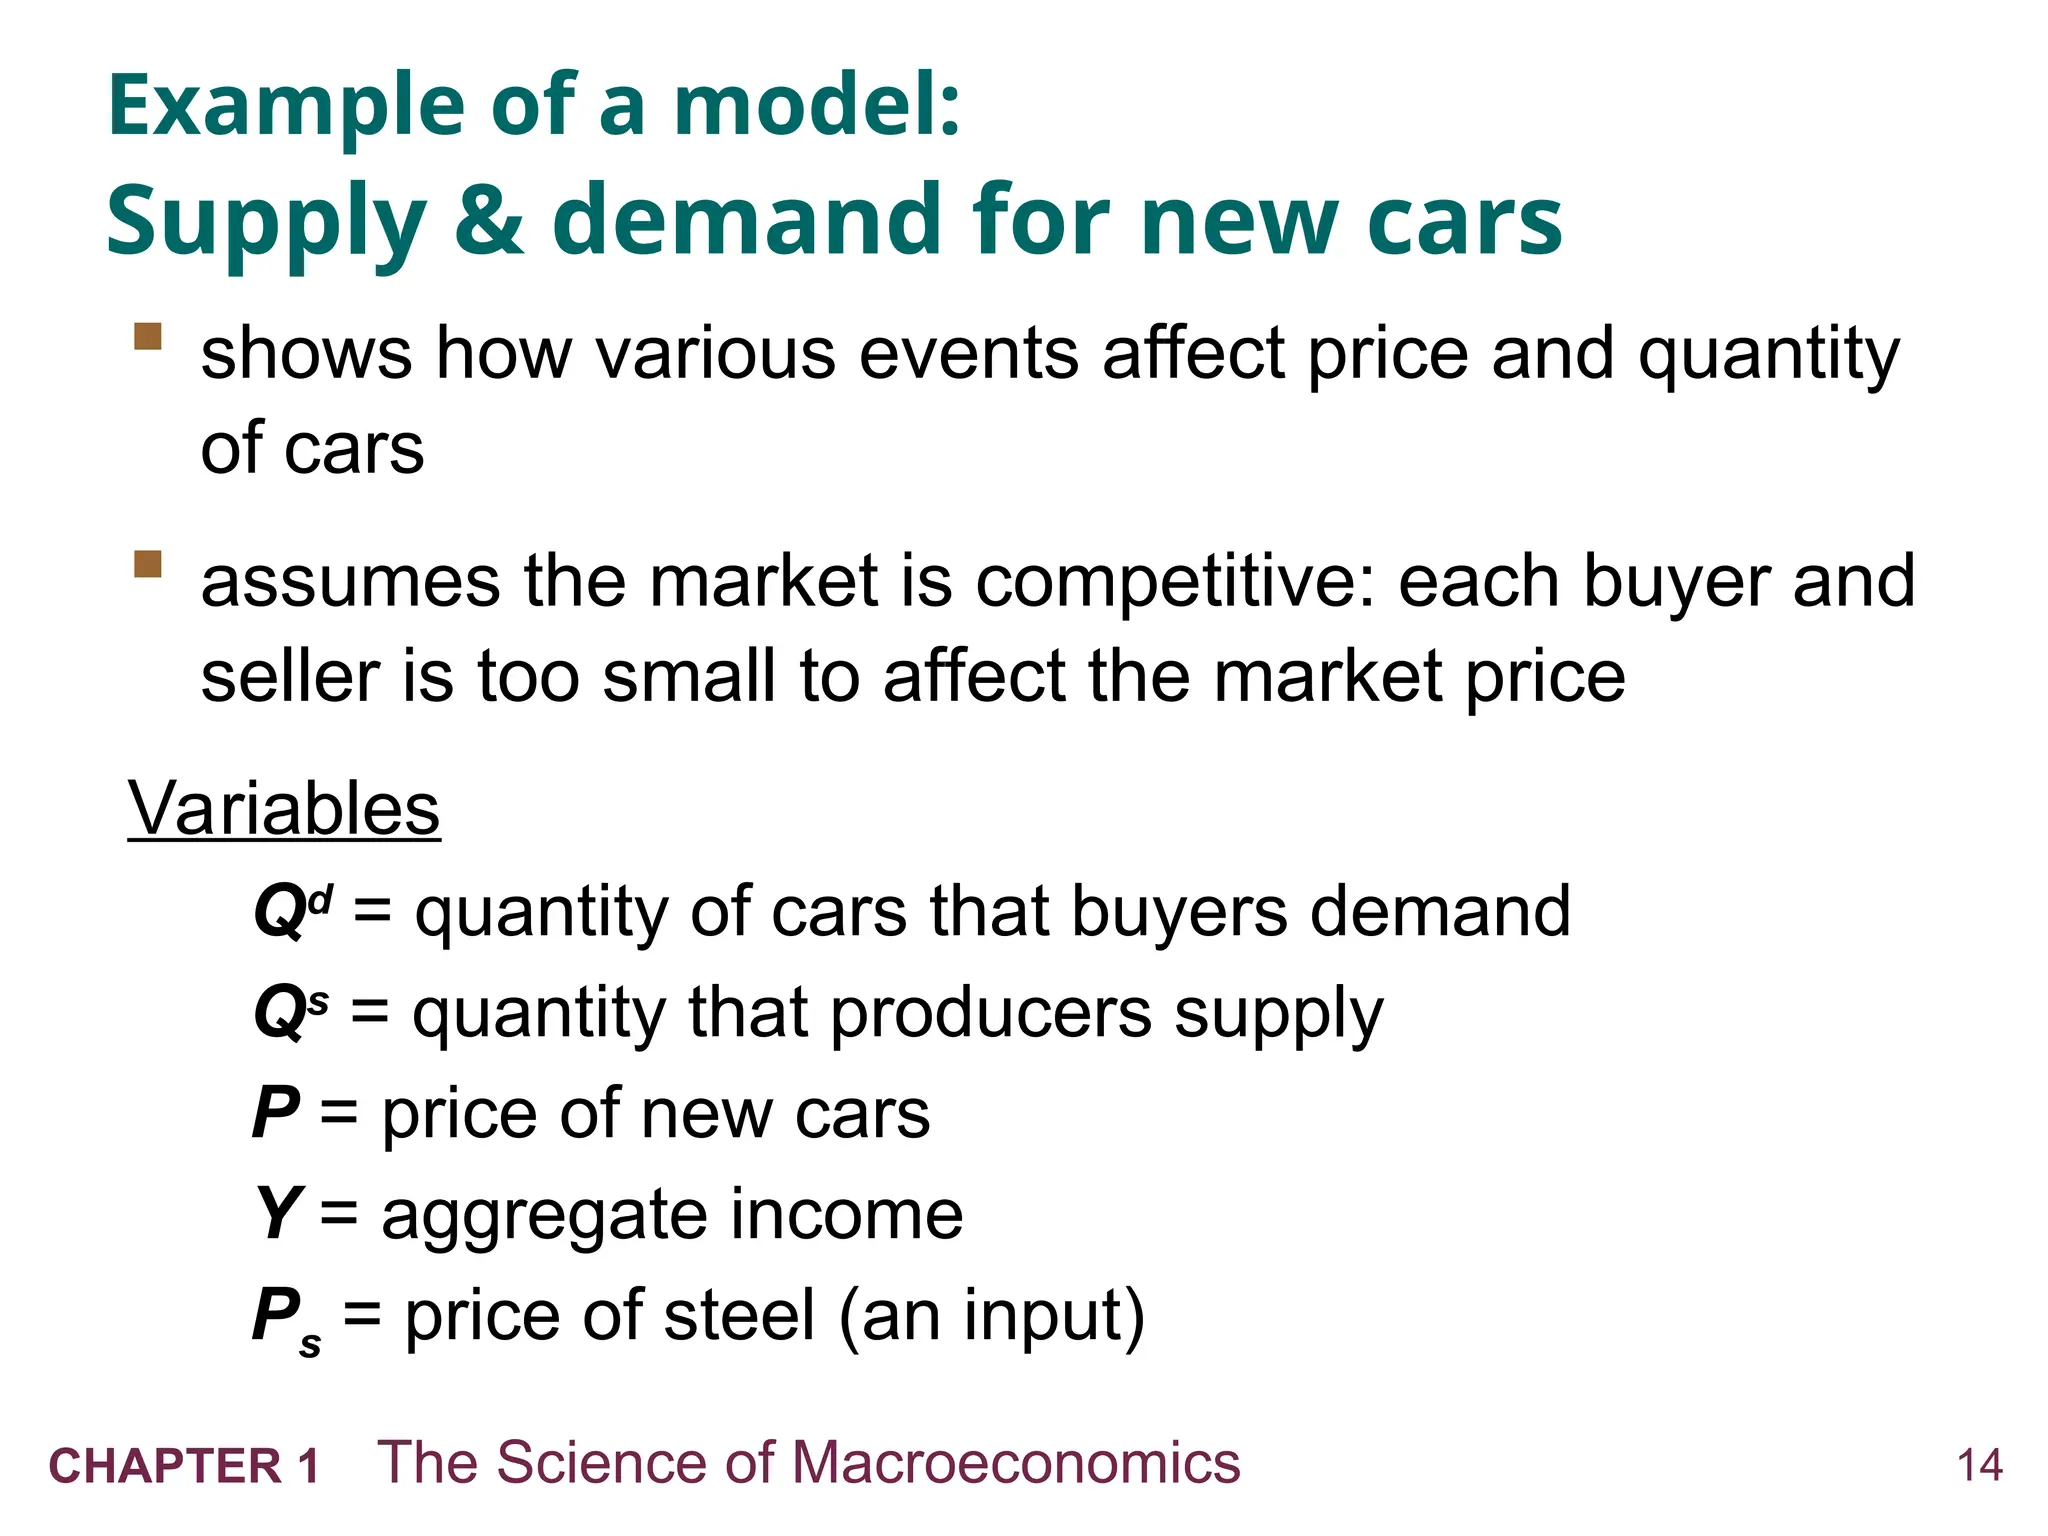
Example of a model:
Supply & demand for new cars
shows how various events affect price and quantity
of cars
assumes the market is competitive: each buyer and
seller is too small to affect the market price
Variables
Qd
= quantity of cars that buyers demand
Qs
= quantity that producers supply
P = price of new cars
Y = aggregate income
Ps = price of steel (an input)
15.
15
CHAPTER 1 TheScience of Macroeconomics
The demand for cars
demand equation: Qd
= D(P,Y )
shows that the quantity of cars consumers
demand is related to the price of cars and
aggregate income
16.
16
CHAPTER 1 TheScience of Macroeconomics
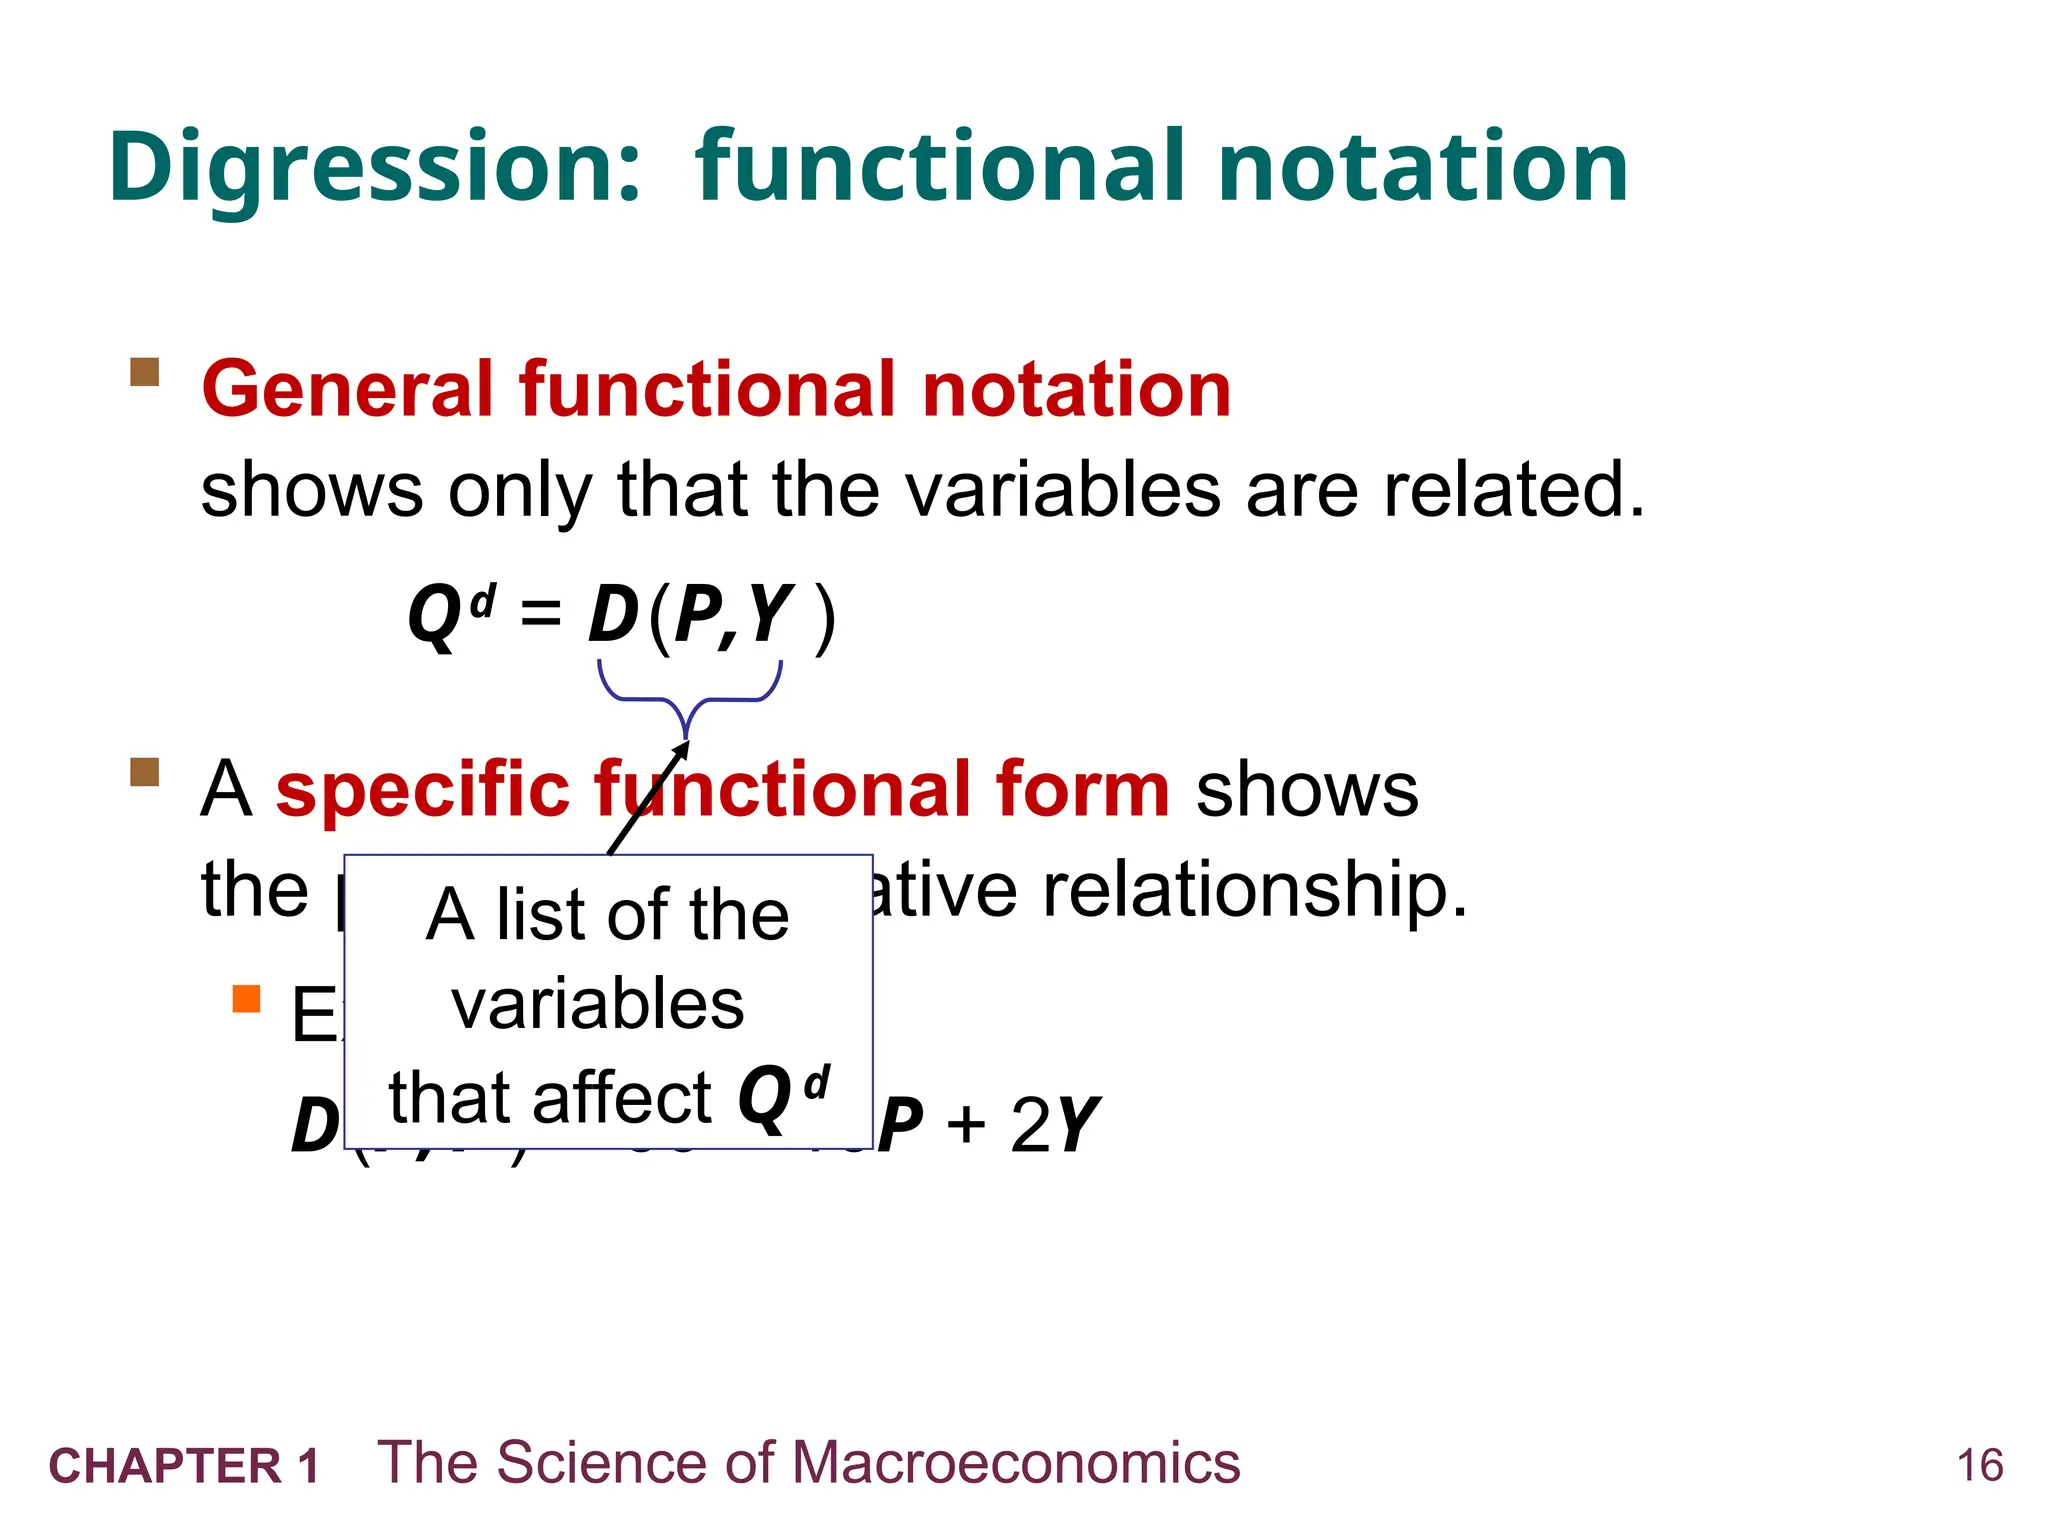
Digression: functional notation
General functional notation
shows only that the variables are related.
Qd
= D(P,Y )
A specific functional form shows
the precise quantitative relationship.
Example:
D(P,Y ) = 60 – 10P + 2Y
A list of the
variables
that affect Qd
17.
17
CHAPTER 1 TheScience of Macroeconomics
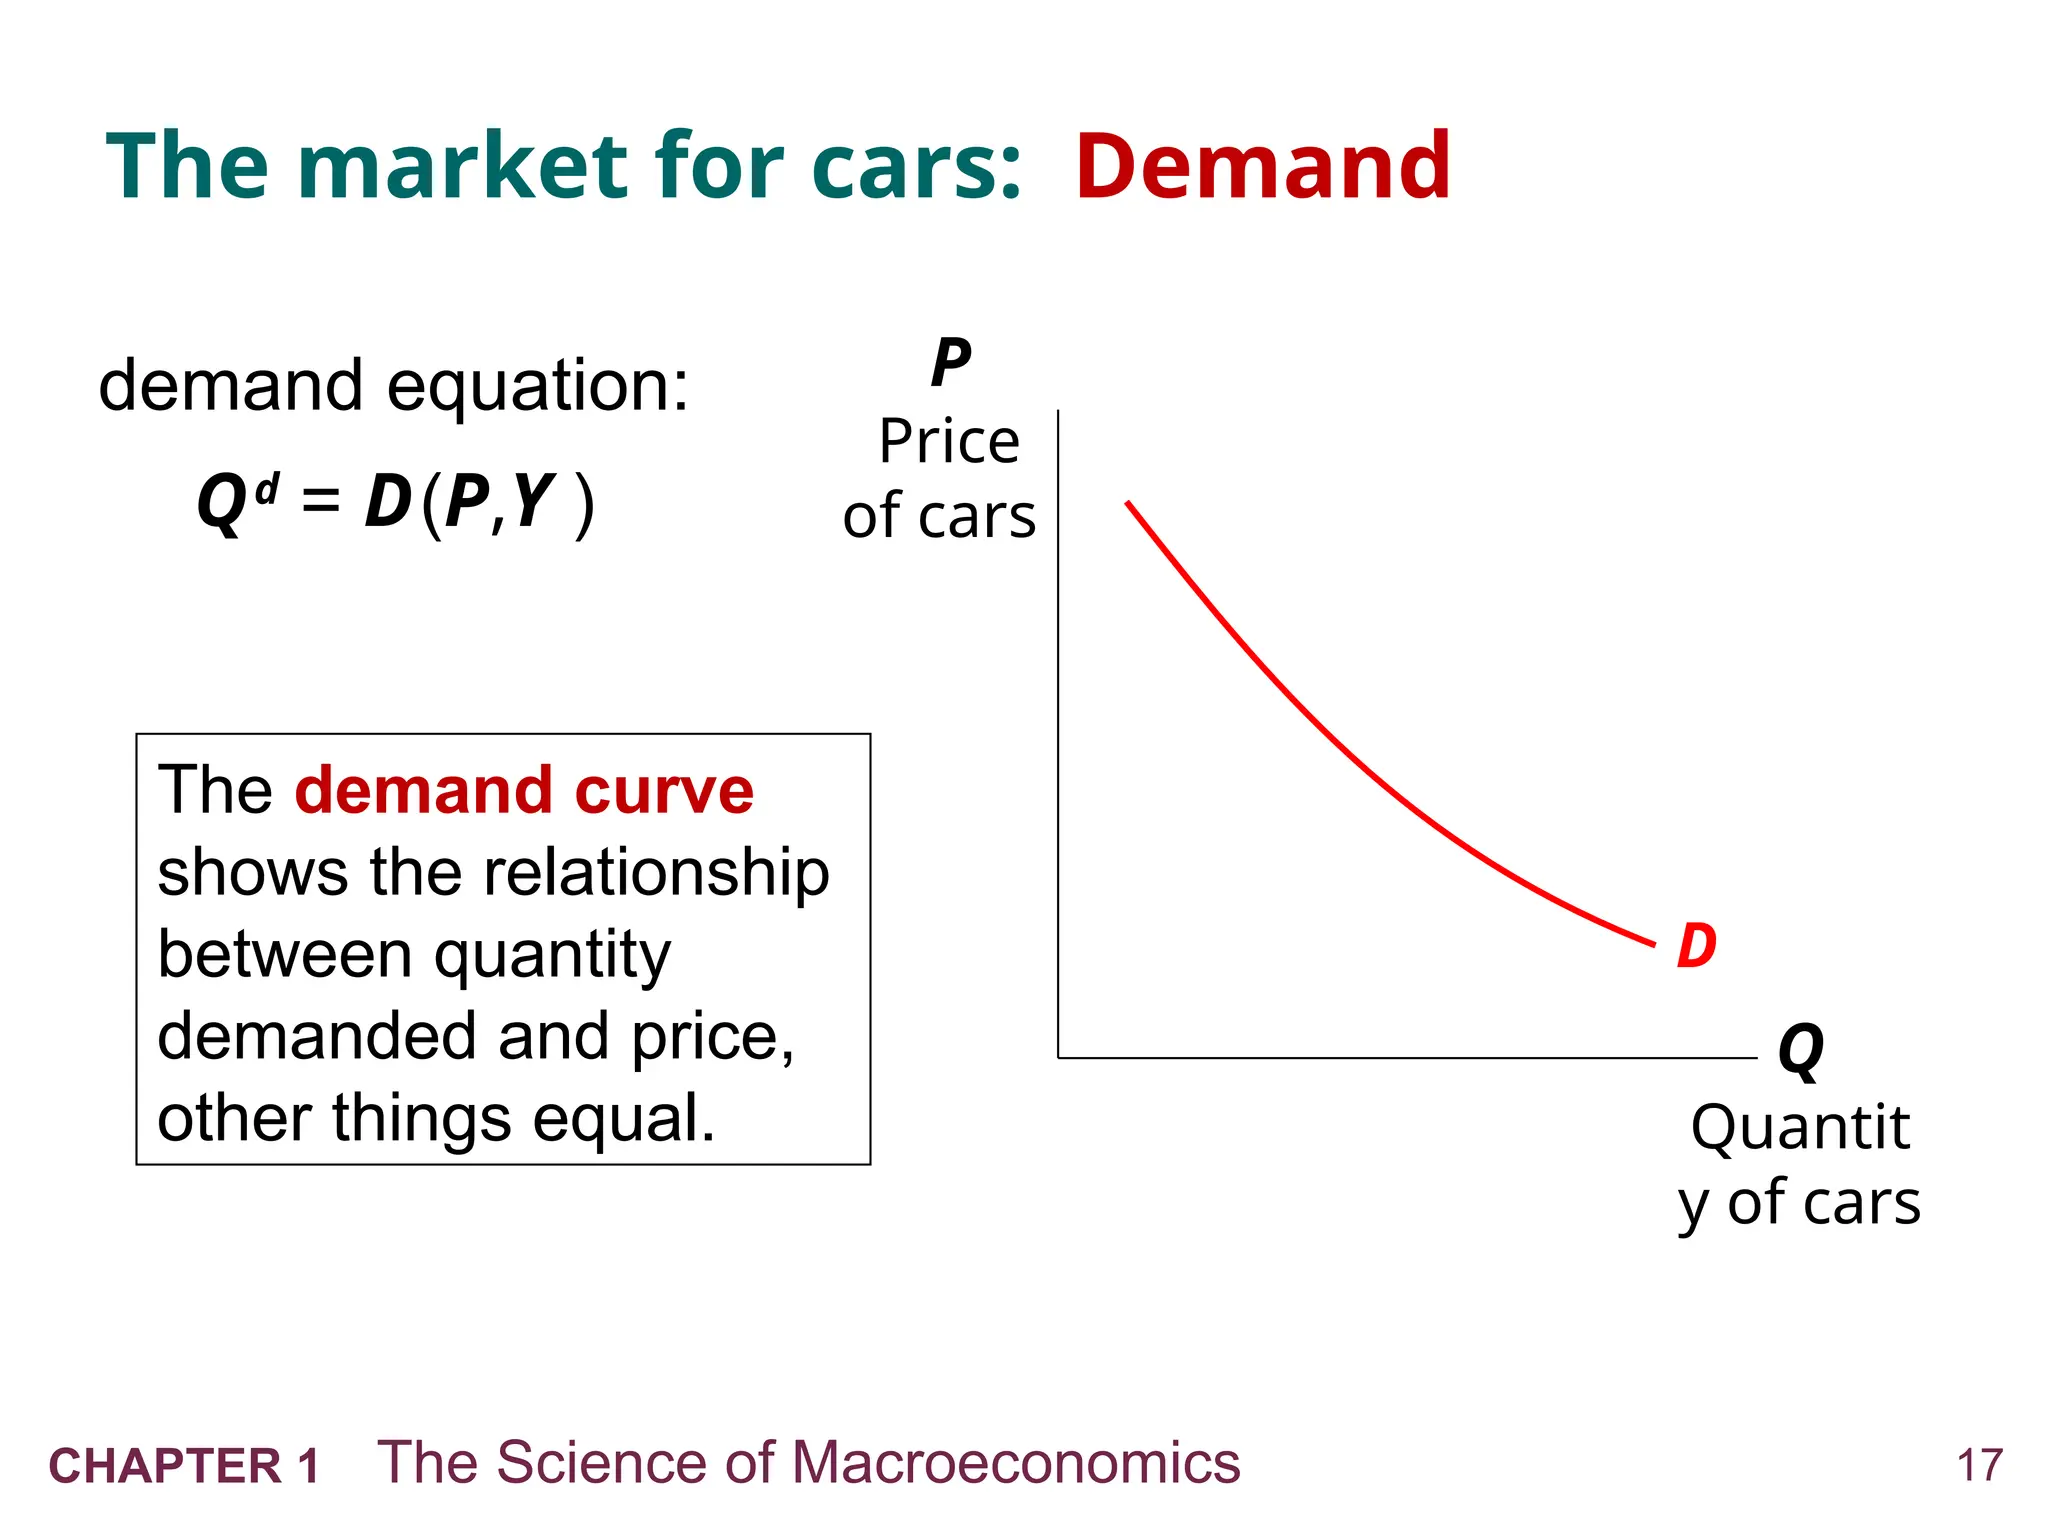
The market for cars: Demand
Q
Quantit
y of cars
P
Price
of cars
D
The demand curve
shows the relationship
between quantity
demanded and price,
other things equal.
demand equation:
Qd
= D(P,Y )
18.
18
CHAPTER 1 TheScience of Macroeconomics
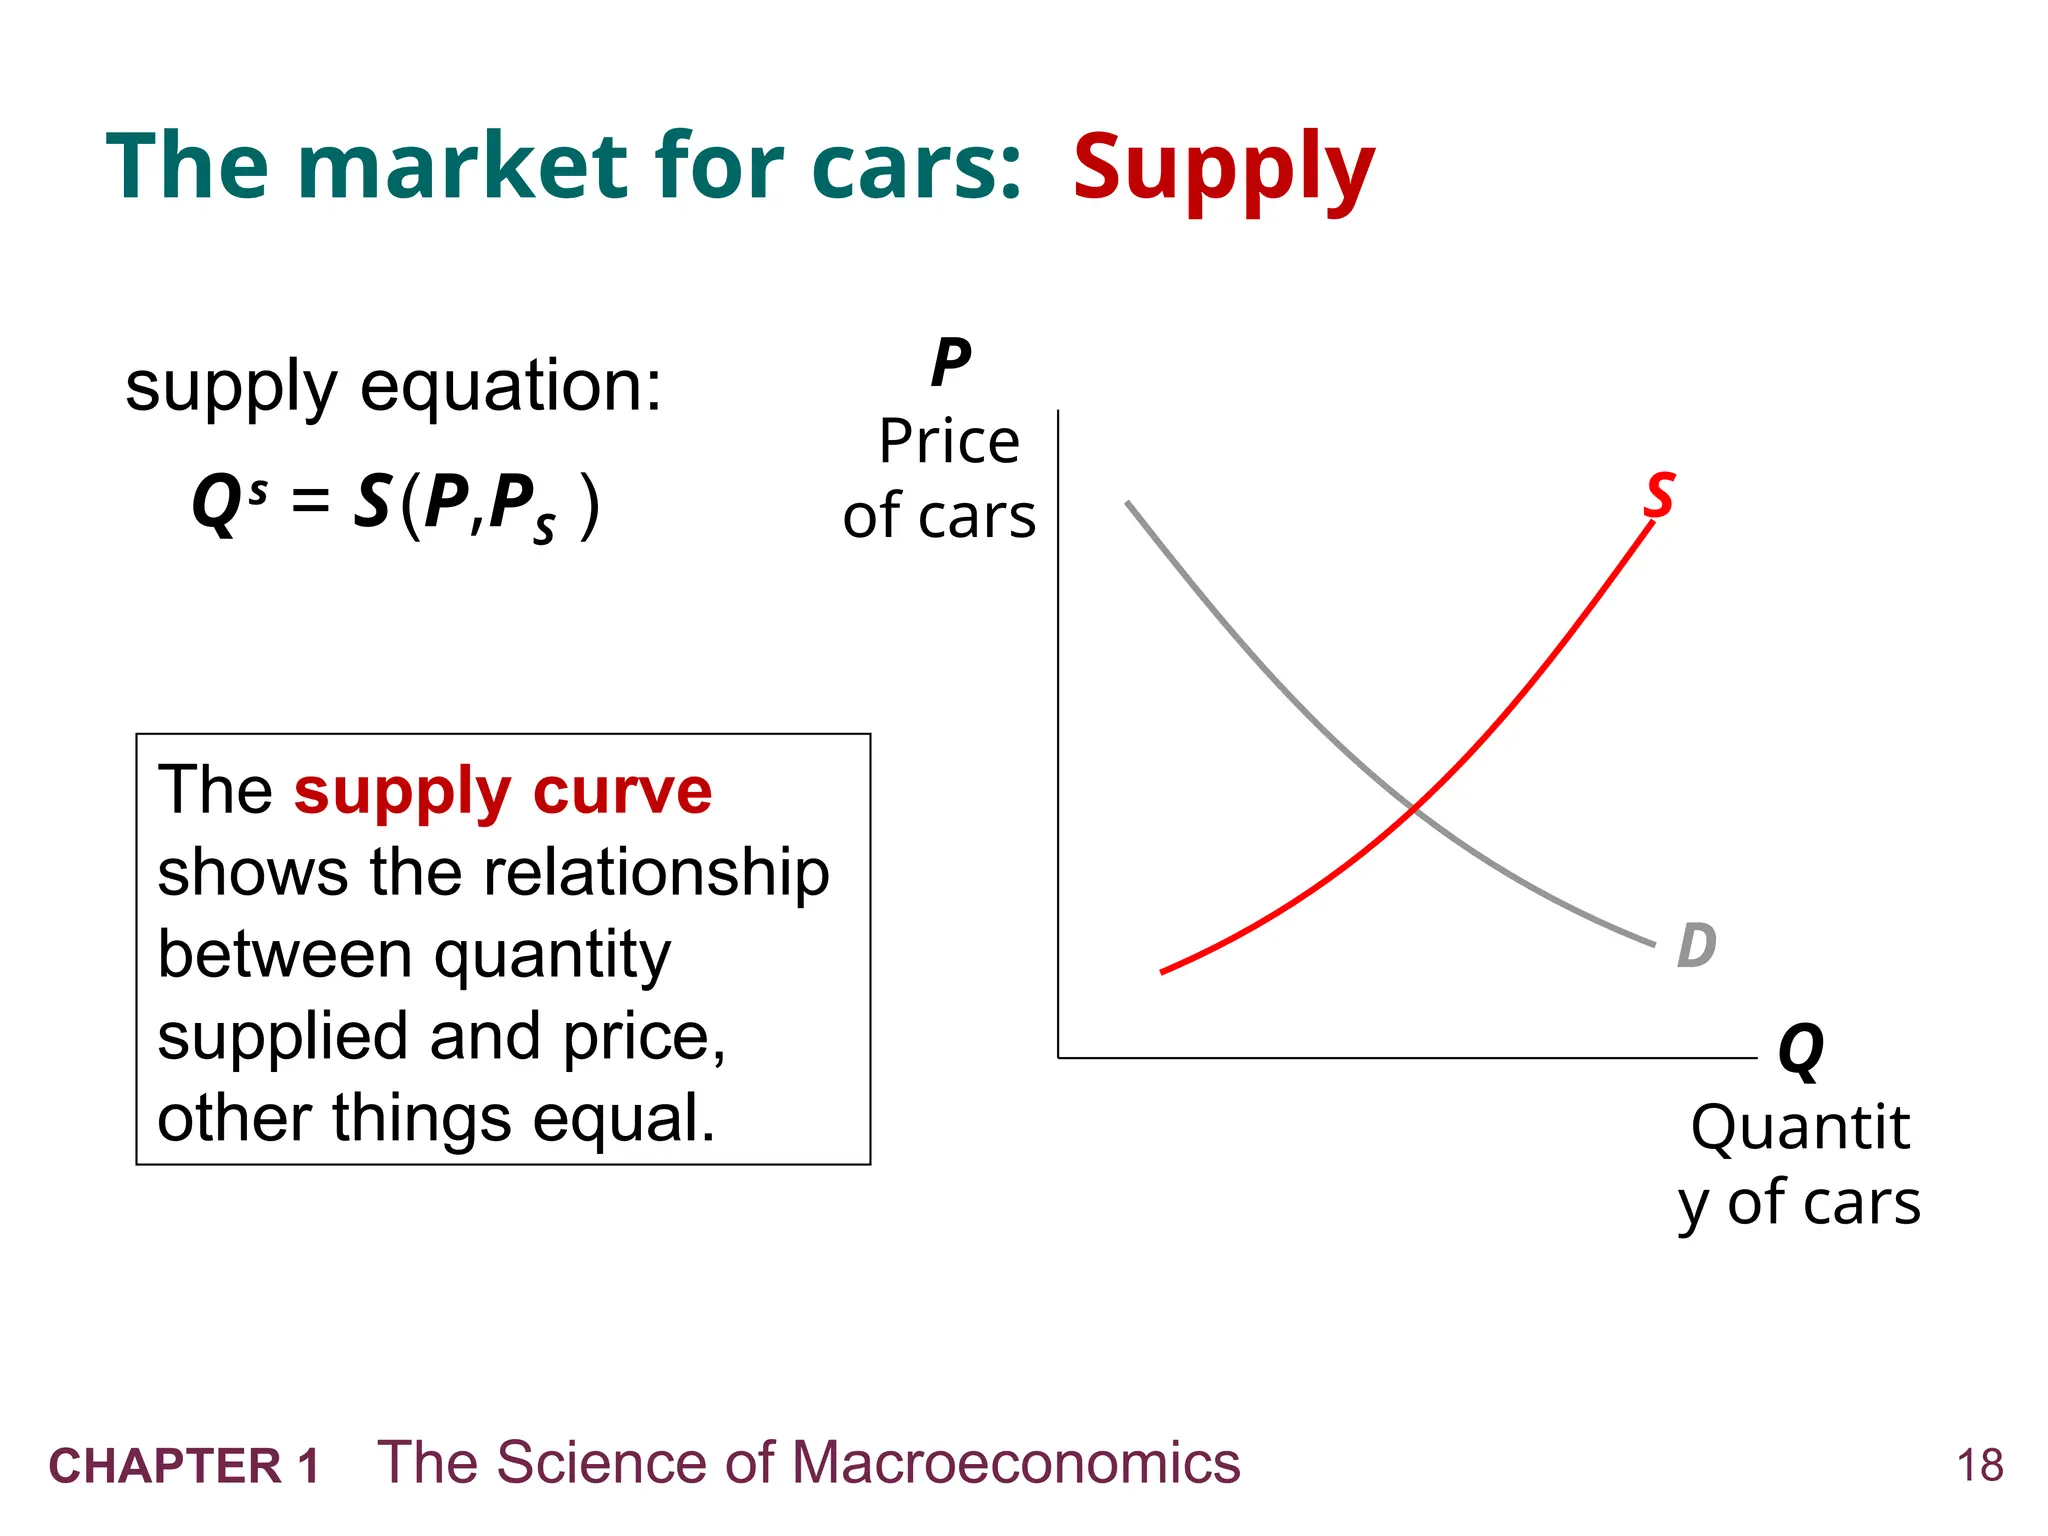
The market for cars: Supply
Q
Quantit
y of cars
P
Price
of cars
D
S
The supply curve
shows the relationship
between quantity
supplied and price,
other things equal.
supply equation:
Qs
= S(P,PS )
19.
19
CHAPTER 1 TheScience of Macroeconomics
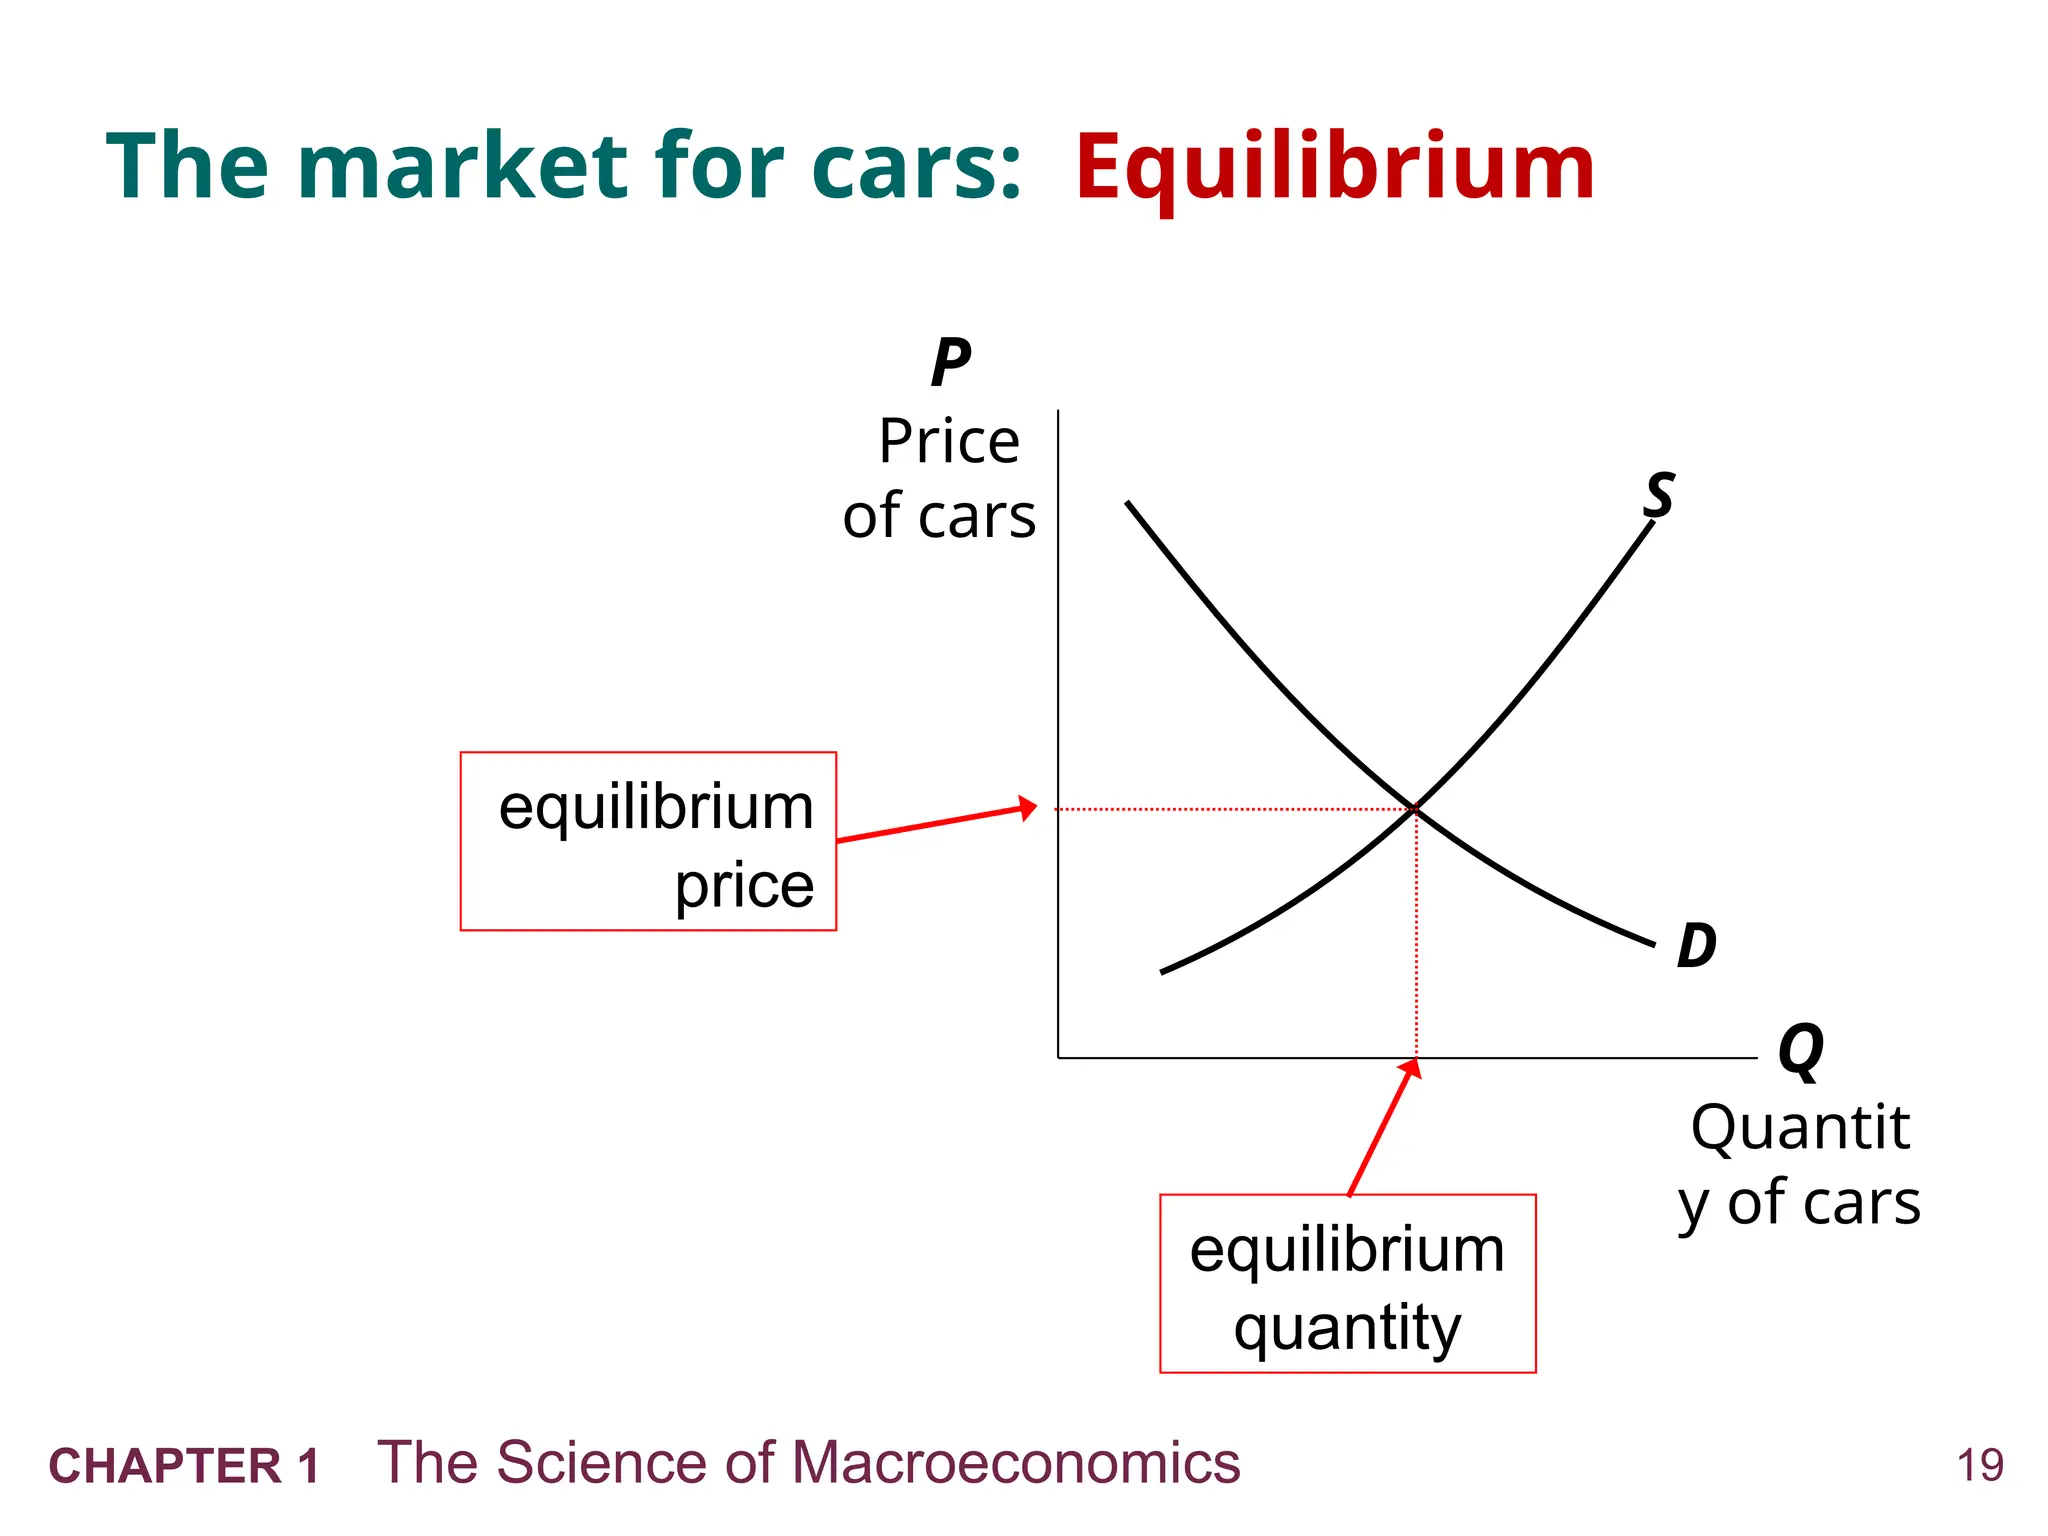
The market for cars: Equilibrium
Q
Quantit
y of cars
P
Price
of cars S
D
equilibrium
price
equilibrium
quantity
20.
20
CHAPTER 1 TheScience of Macroeconomics
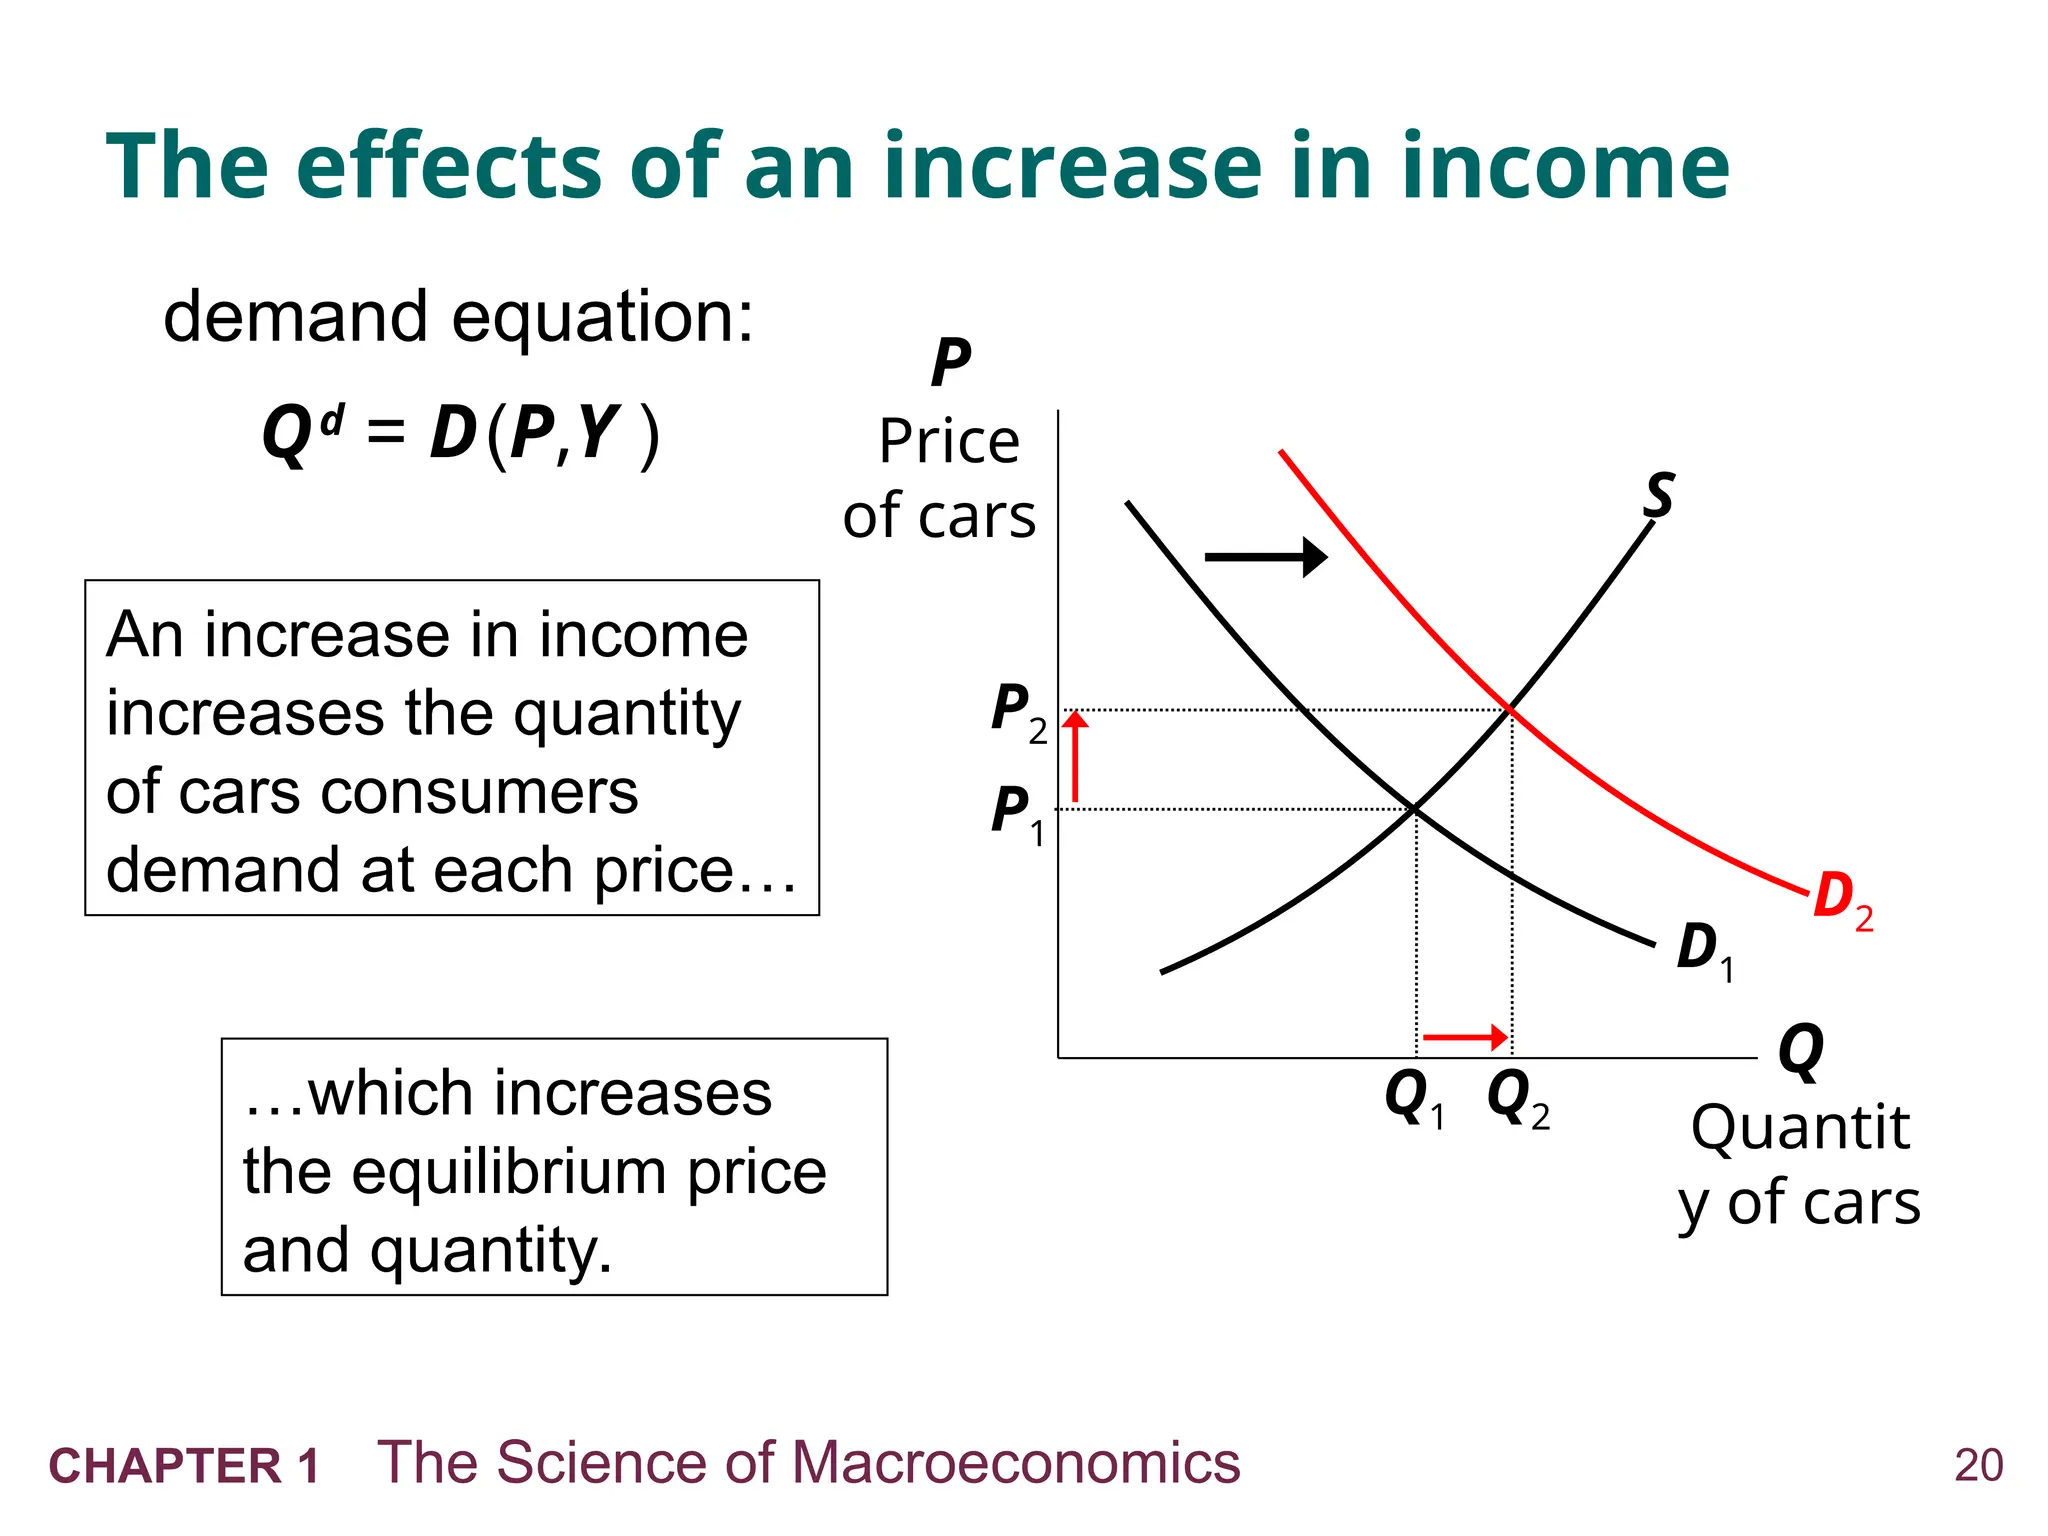
The effects of an increase in income
Q
Quantit
y of cars
P
Price
of cars S
D1
Q1
P1
An increase in income
increases the quantity
of cars consumers
demand at each price…
…which increases
the equilibrium price
and quantity.
P2
Q2
D2
demand equation:
Qd
= D(P,Y )
21.
21
CHAPTER 1 TheScience of Macroeconomics
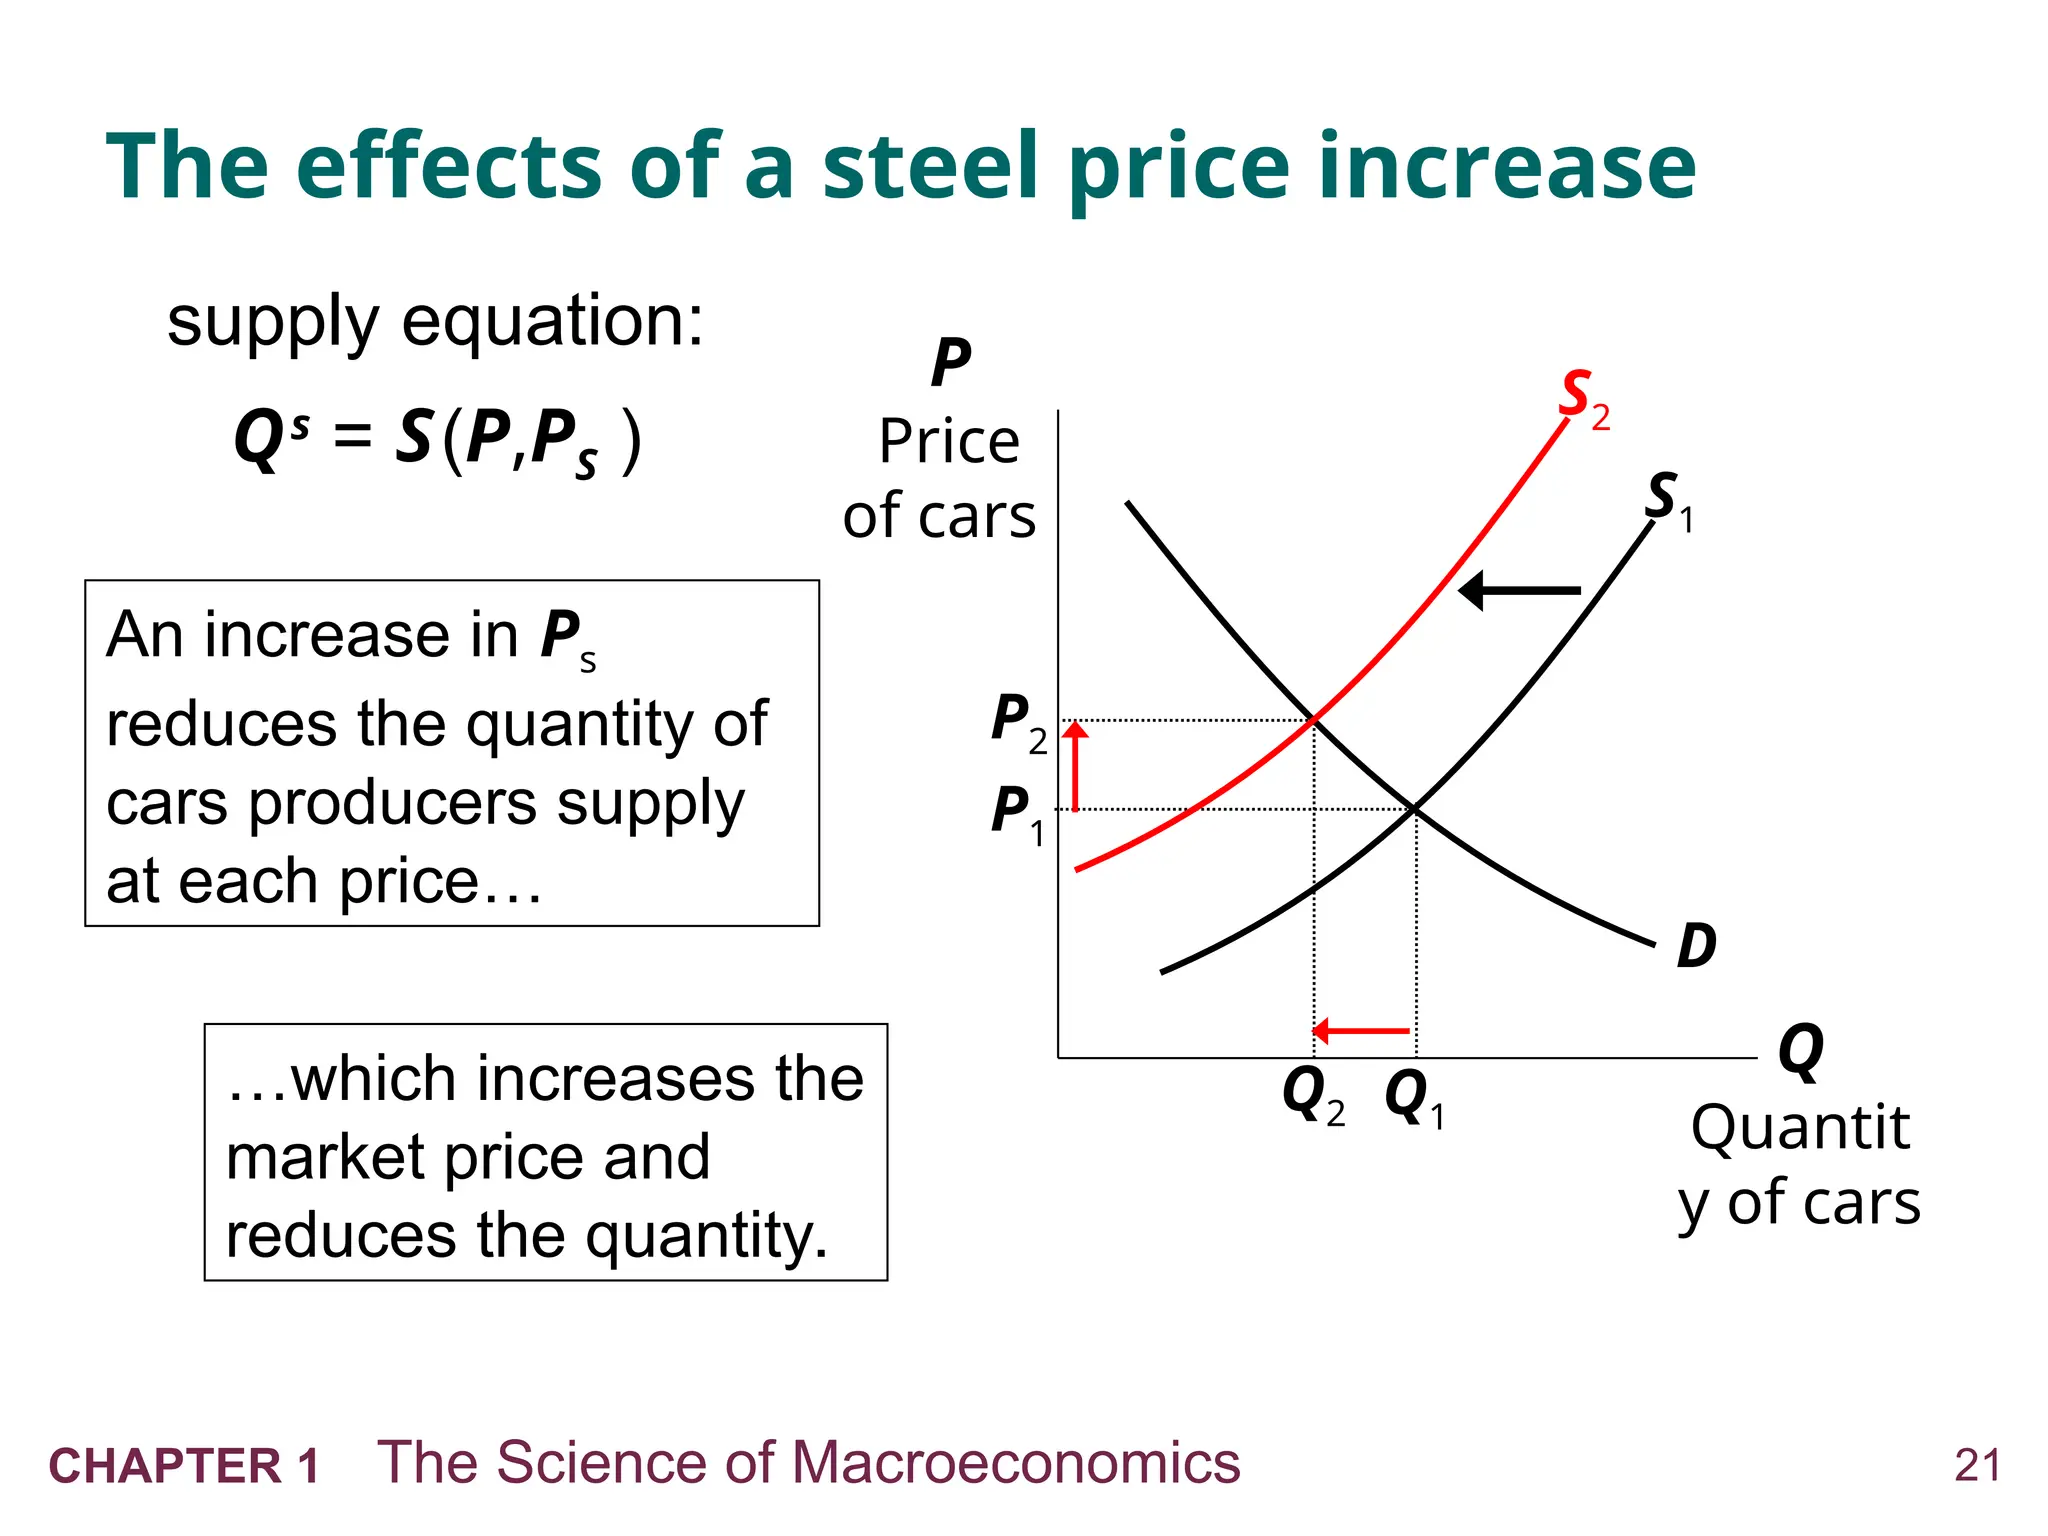
The effects of a steel price increase
Q
Quantit
y of cars
P
Price
of cars S1
D
Q1
P1
An increase in Ps
reduces the quantity of
cars producers supply
at each price…
…which increases the
market price and
reduces the quantity.
P2
Q2
S2
supply equation:
Qs
= S(P,PS )
22.
22
CHAPTER 1 TheScience of Macroeconomics
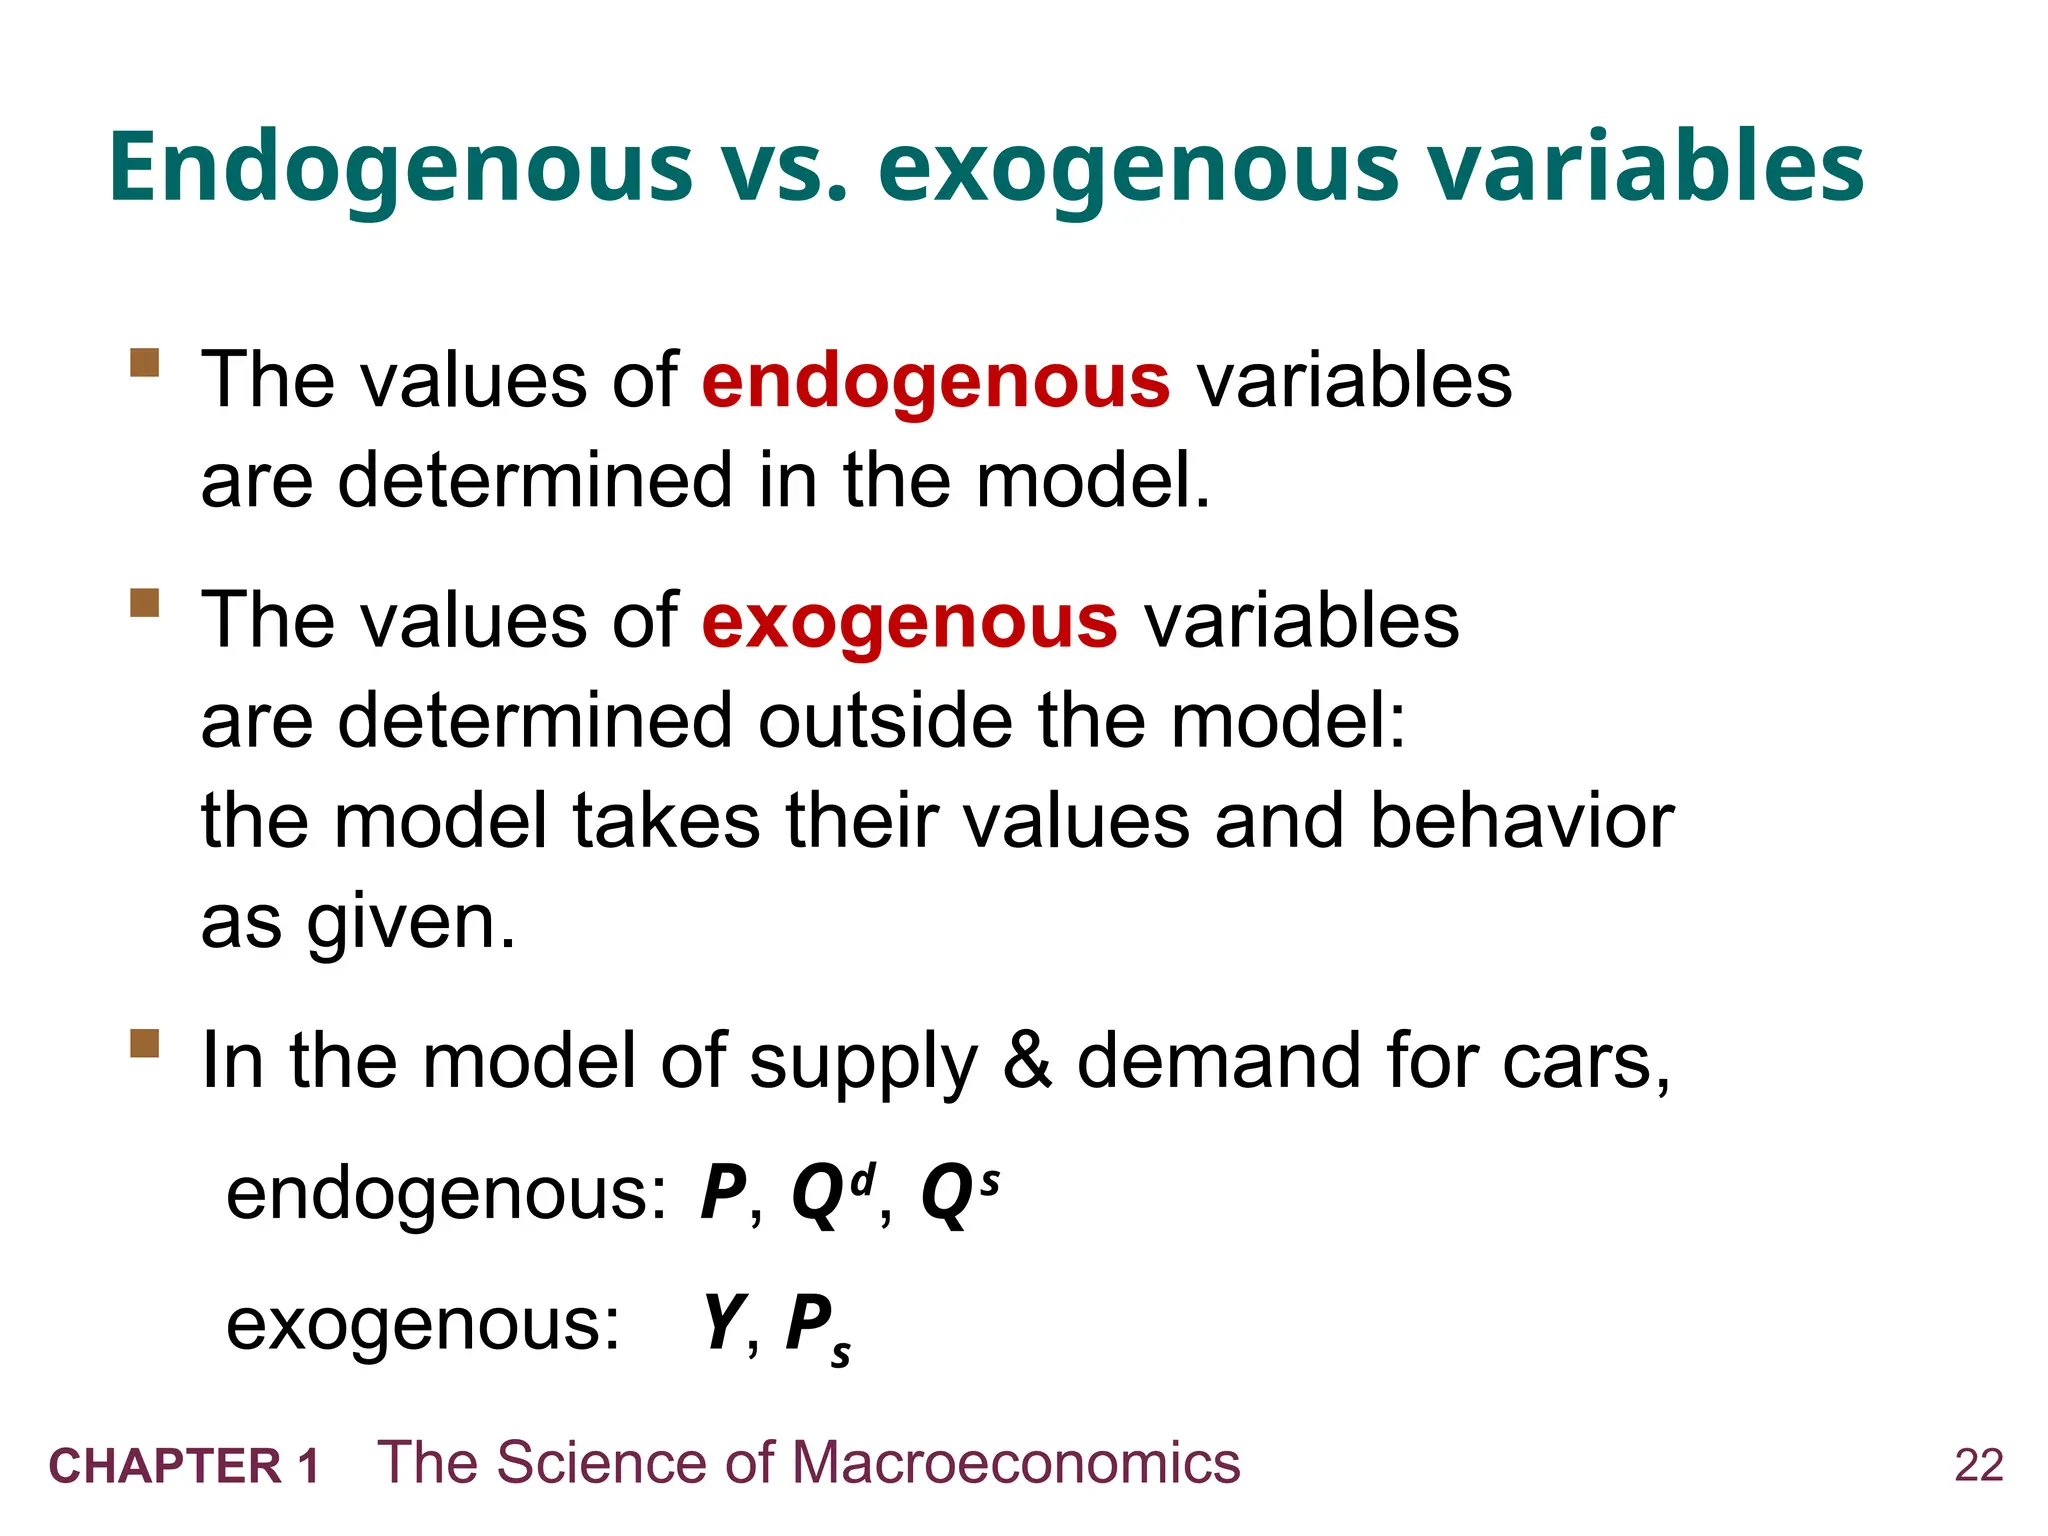
Endogenous vs. exogenous variables
The values of endogenous variables
are determined in the model.
The values of exogenous variables
are determined outside the model:
the model takes their values and behavior
as given.
In the model of supply & demand for cars,
endogenous: P, Qd
, Qs
exogenous: Y, Ps
23.
NOW YOU TRY
Supplyand Demand
Supply and Demand
1. Write down demand and supply equations for
smartphones; include two exogenous variables
in each equation.
2. Draw a supply-demand graph for smartphones.
3. Use your graph to show how a change in one
of your exogenous variables affects the
model’s endogenous variables.
23
24.
24
CHAPTER 1 TheScience of Macroeconomics
The use of multiple models
No one model can address all the issues we
care about.
E.g., our supply-demand model of the car
market…
can tell us how a fall in aggregate income
affects price & quantity of cars.
cannot tell us why aggregate income falls.
25.
25
CHAPTER 1 TheScience of Macroeconomics
The use of multiple models
So we will learn different models for studying
different issues (e.g., unemployment, inflation,
long-run growth).
For each new model, you should keep track of
its assumptions
which variables are endogenous,
which are exogenous
the questions it can help us understand,
those it cannot
26.
26
CHAPTER 1 TheScience of Macroeconomics
Prices: flexible vs. sticky
Market clearing: An assumption that prices are
flexible, adjust to equate supply and demand.
In the short run, many prices are sticky –
adjust sluggishly in response to changes in
supply or demand. For example:
many labor contracts fix the nominal wage
for a year or longer
many magazine publishers change prices
only once every 3 to 4 years
27.
27
CHAPTER 1 TheScience of Macroeconomics
Prices: flexible vs. sticky
The economy’s behavior depends partly on
whether prices are sticky or flexible:
If prices sticky (short run),
demand may not equal supply, which explains:
unemployment (excess supply of labor)
why firms cannot always sell all the goods
they produce
If prices flexible (long run), markets clear and
economy behaves very differently
28.
28
CHAPTER 1 TheScience of Macroeconomics
Outline of this book:
Introductory material (Chaps. 1, 2)
Classical Theory (Chaps. 3–7)
How the economy works in the long run, when
prices are flexible
Growth Theory (Chaps. 8, 9)
The standard of living and its growth rate over the
very long run
Business Cycle Theory (Chaps. 10–14)
How the economy works in the short run, when
prices are sticky
29.
29
CHAPTER 1 TheScience of Macroeconomics
Outline of this book:
Macroeconomic theory (Chaps. 15–17)
Macroeconomic dynamics, models of consumer
behavior, theories of firms’ investment decisions
Macroeconomic policy (Chaps. 18–20)
Stabilization policy, government debt and
deficits, financial crises
30.
CHAPTER SUMMARY
Macroeconomicsis the study of the economy as a
whole, including
growth in incomes
changes in the overall level of prices
the unemployment rate
Macroeconomists attempt to explain the economy
and to devise policies to improve its performance.
30
31.
CHAPTER SUMMARY
Economistsuse different models to examine
different issues.
Models with flexible prices describe the economy
in the long run; models with sticky prices describe
the economy in the short run.
Macroeconomic events and performance arise
from many microeconomic transactions, so
macroeconomics uses many of the tools of
microeconomics.
31
Editor's Notes
#1 TO THE INSTRUCTOR:
Many slides contain “notes” in this area of your screen. They are visible only to you and will not display during your classroom presentations. I use these notes to provide additional information you may find helpful.
Depending on the slide, this information may include data sources and teaching suggestions.
Many slides contain data. These notes usually provide the source—often the exact URL—in case you wish to visit the source and update the data to the latest available before teaching.
I will update these slides approximately once per year until the next edition of the textbook is published. The updated slides will be available at the companion website for the textbook under “instructor resources.” You may need instructor-level access; your Worth sales rep can provide you with a username and password.
If you find a typo or have a suggestion or comment, I would be grateful to hear from you. Please email me at:
rcronovich@carthage.edu
#3 This slide and the next contain a list of some topical issues that macro can help students understand. Feel free to substitute others as new issues emerge.
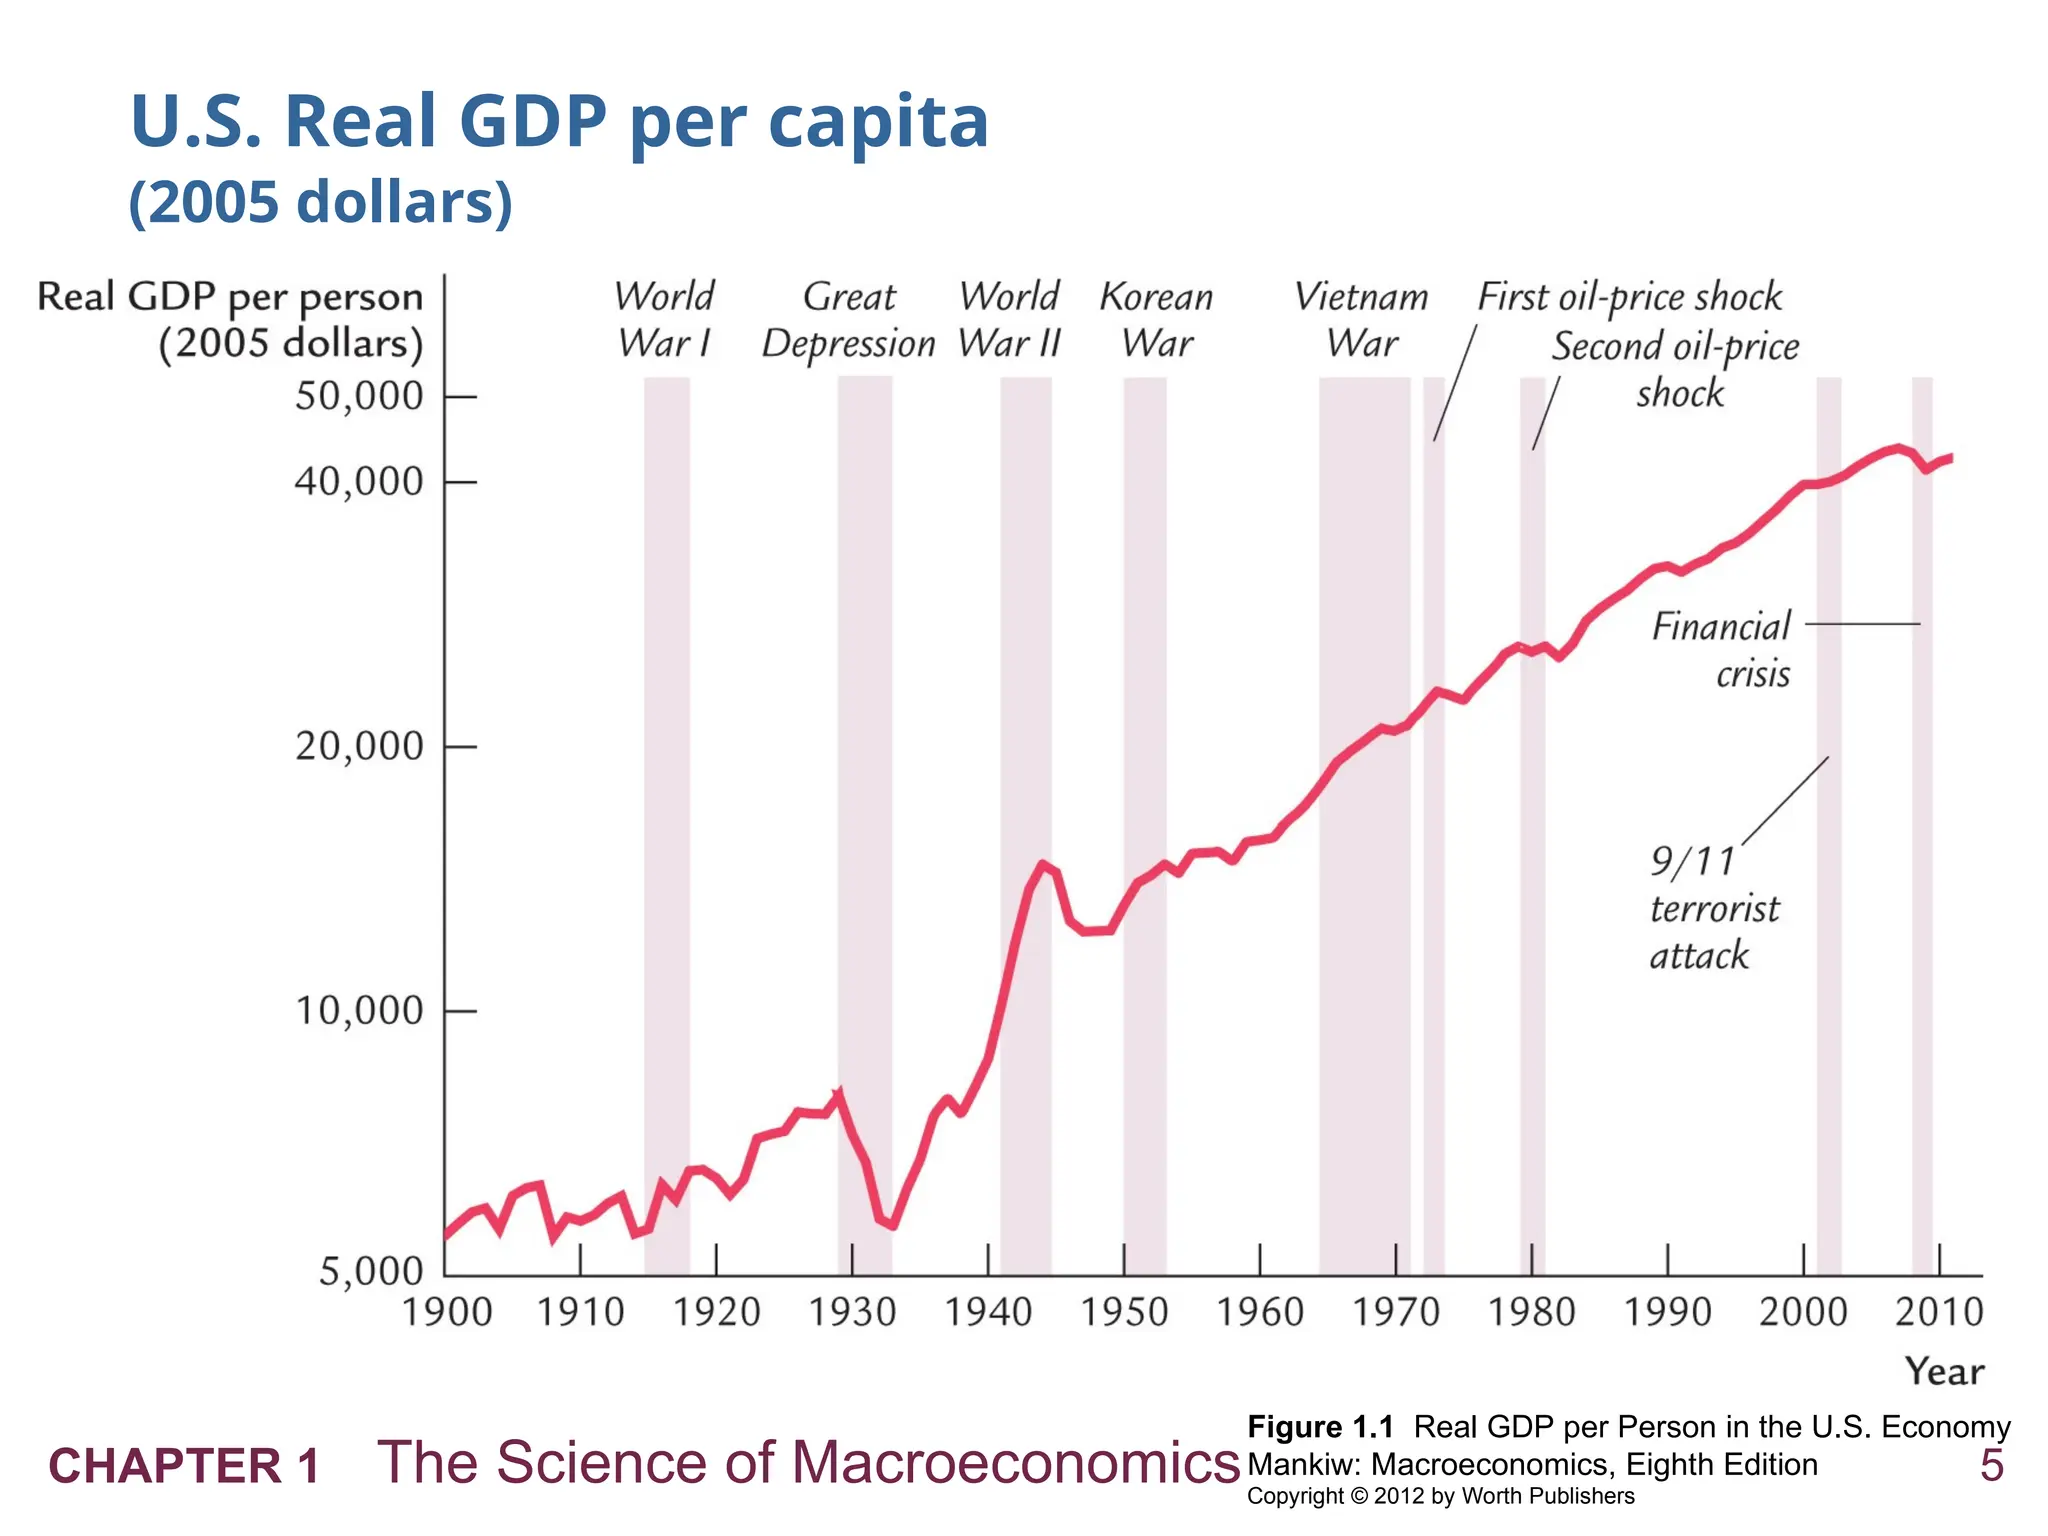
#5 Figure 1.1 Real GDP per Person in the U.S. Economy
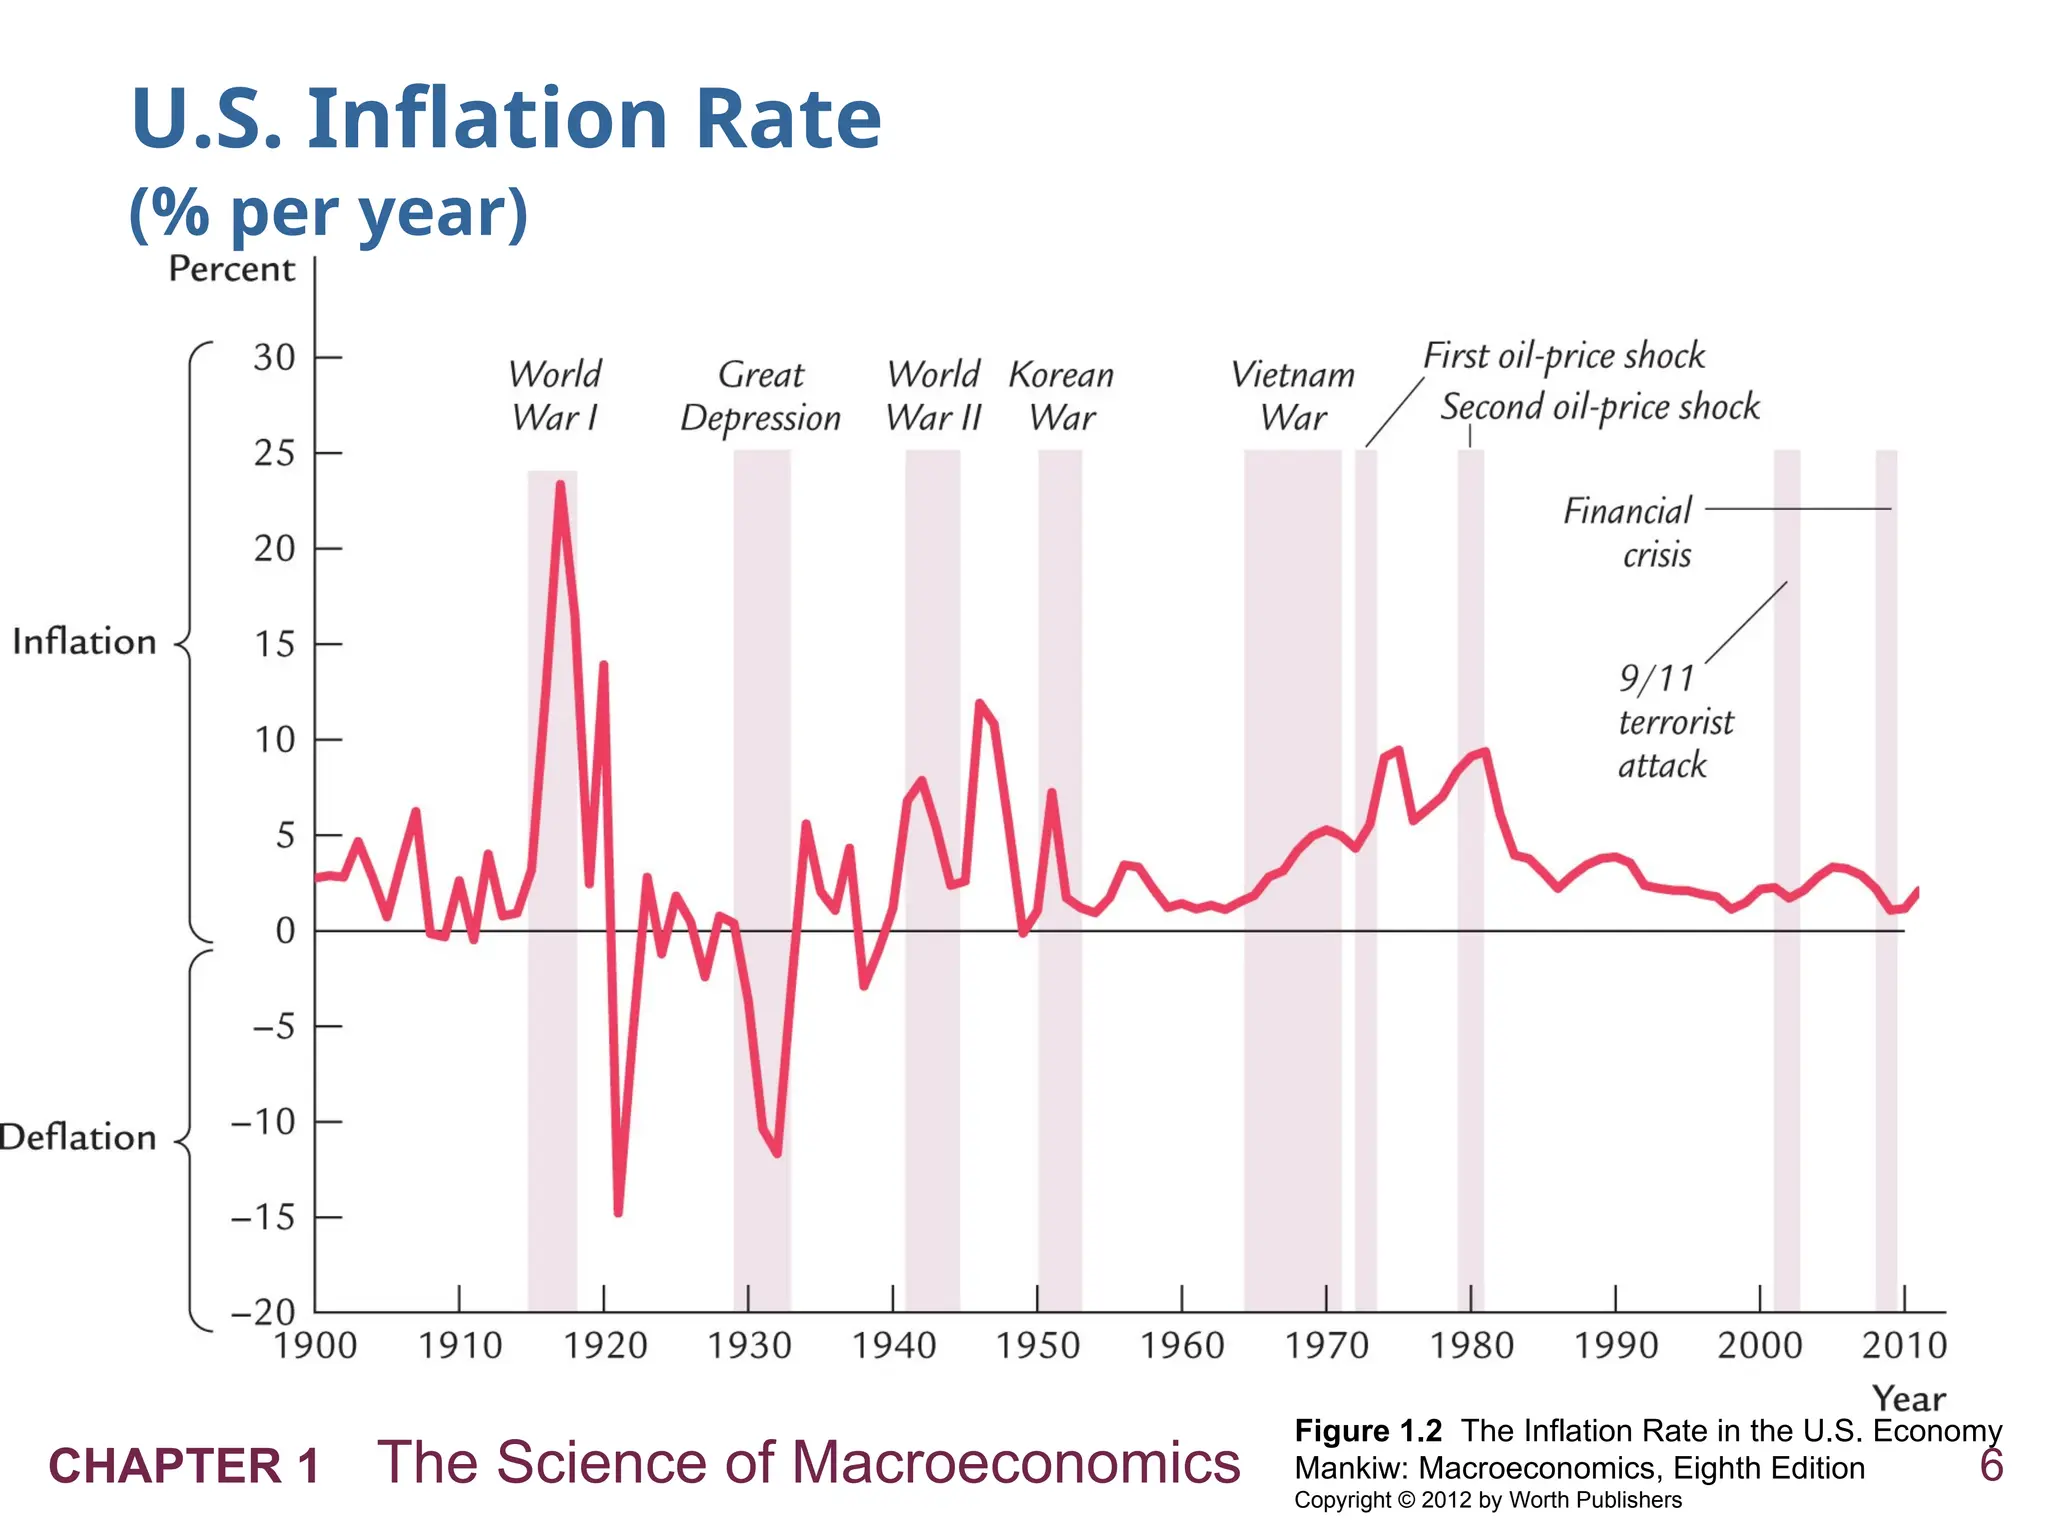
#6 Figure 1.2 The Inflation Rate in the U.S. Economy
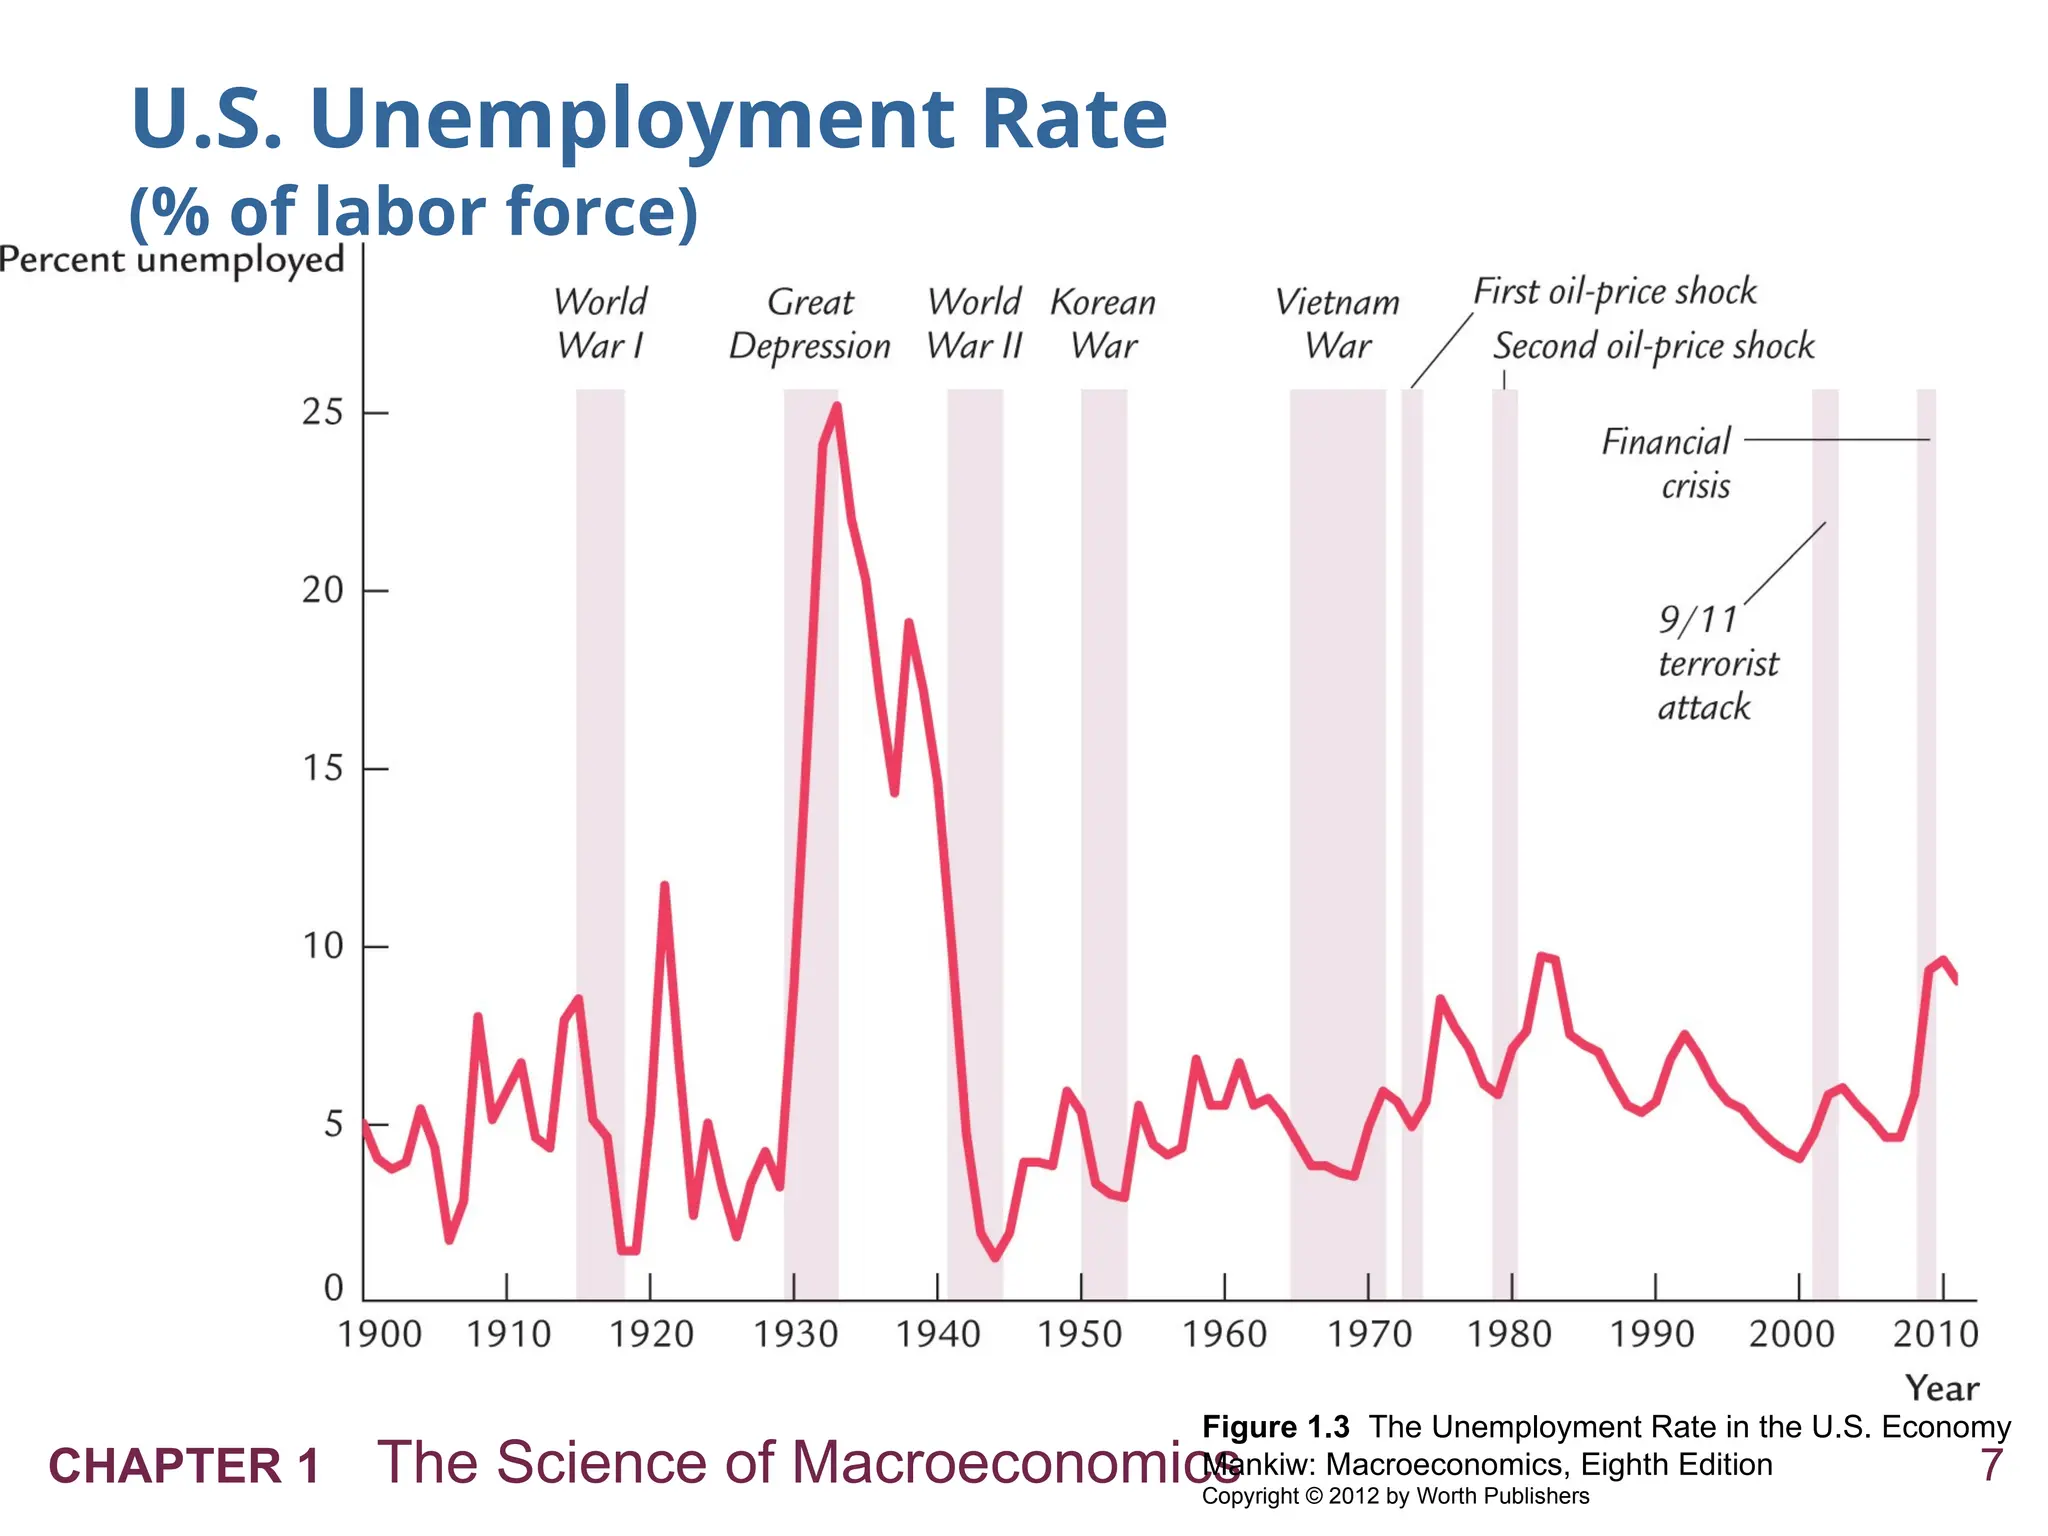
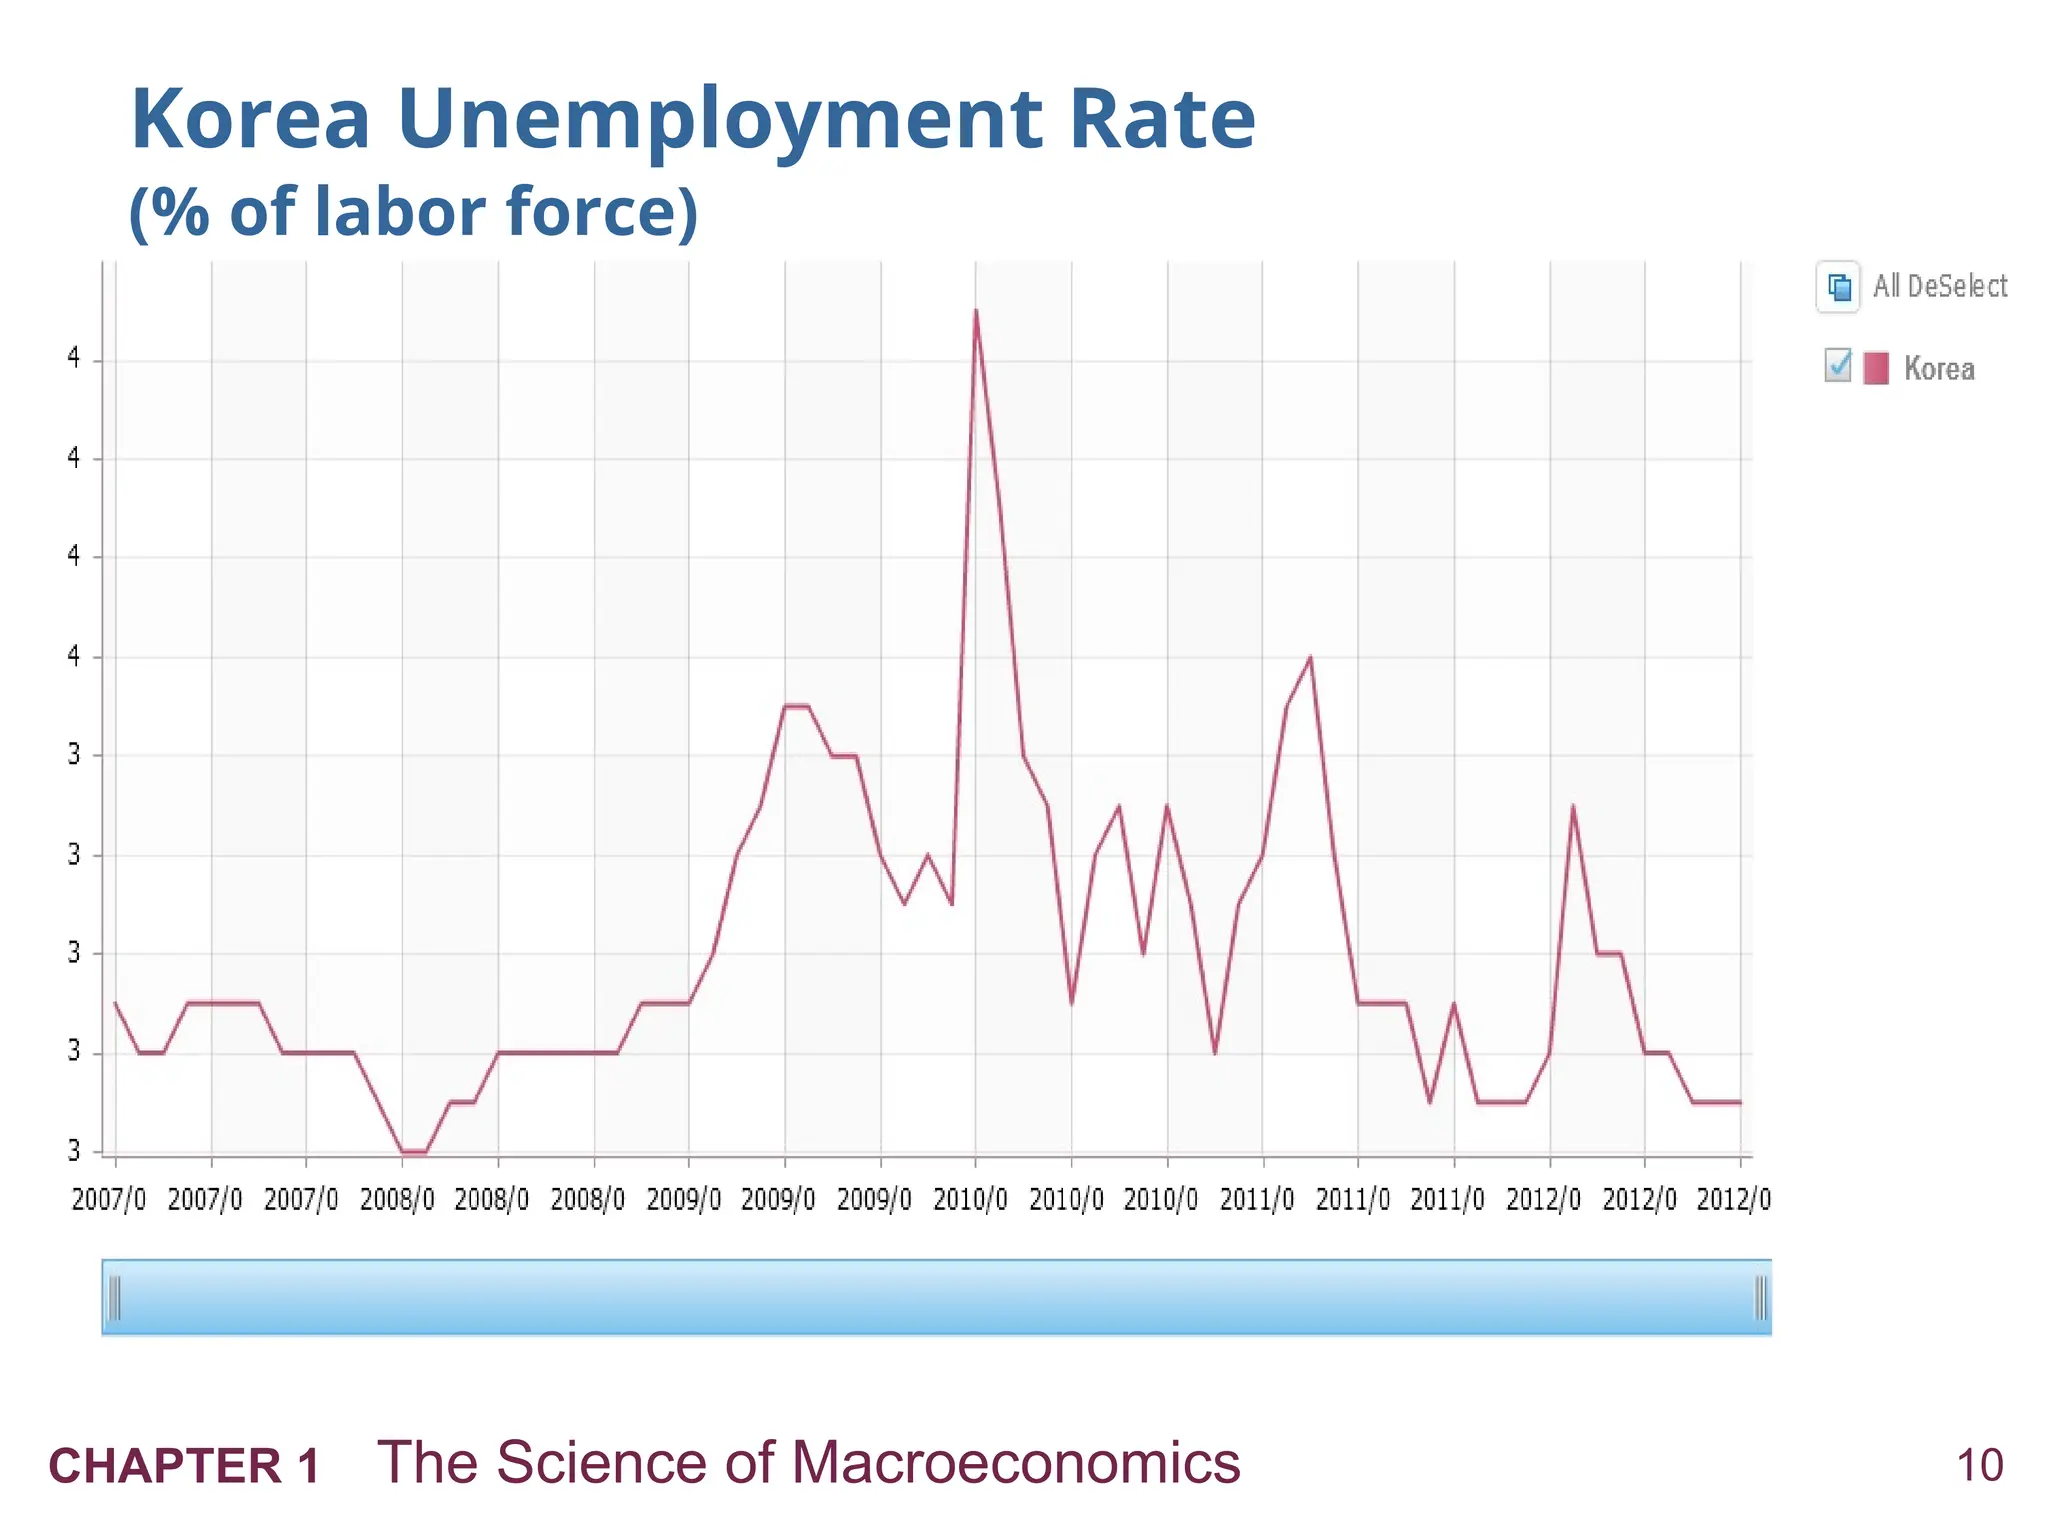
#7 Figure 1.3 The Unemployment Rate in the U.S. Economy
#8 Figure 1.1 Real GDP per Person in the U.S. Economy
#9 Figure 1.2 The Inflation Rate in the U.S. Economy
#10 Figure 1.3 The Unemployment Rate in the U.S. Economy
#14 Students know the auto market is not competitive. However, if all we want to know is how an increase in the price of steel or a fall in consumer income affects the price and quantity of autos, then it’s fine to use this model.
In general, making unrealistic assumptions is okay, even desirable, if they simplify the analysis without affecting the validity of the results.
#16 We often aren’t concerned with the exact quantitative relationship between variables, so we will often use the general functional notation.
#23 The PowerPoint slides for most chapters in this book contain one or more “Now You Try” slides. These slides contain questions or problems that serve to break up a lecture, give students an opportunity to apply what you’re teaching them, and give you a sense of whether they are “getting it.”
In the supply-demand model for smartphones,
Endogenous variables: price of smartphones, quantity of smartphones
Exogenous variables:
consumer income
price of data and voice service (a complement)
price of landline phones & landline phone service (a substitute)
technology
#28 The portion of the book described on this slide comprises the core material. It is organized around time horizons: the long run (flexible prices), the very long run (growth in capital, the population, and technology itself), and the short run (sticky prices and economic fluctuations).
The next slide continues the outline.
#29 Are you covering Chapter 2 next? The PowerPoint presentation for Chapter 2 includes some in-class exercises to reinforce concepts as they are presented. These exercises also help break up the lecture into smaller pieces. If you’d like to try them, please ask your students to bring calculators to the next class meeting.