![Bankruptcy Analysis for Credit Risk using Manifold
Learning
B Ribeiro1
, A Vieira2
, J Duarte2
, C Silva1,3
, J Carvalho das Neves4
,
Q Liu5
, and A H Sung5
1
CISUC, Department of Informatics Engineering,University of Coimbra, Portugal
2
Physics Department, Polytechnic Institute of Porto, Portugal
3
ESTG- Polytechnic Institute of Leiria, Portugal
4
ISEG - School of Economics, Technical University of Lisbon, Portugal
5
Computer Science Department, University of New Mexico Tech, USA
bribeiro@dei.uc.pt,asv@isep.pt,jcneves@iseg.utl.pt,sung@cs.nmt.edu
1 Introduction
In this work we apply manifold learning to a real data set of distressed and healthy com-
panies for proper geometric tunning of similarity data points and visualization. While
Isomap [1] algorithm is often used in unsupervised learning, our approach combines
this algorithm with information of class labels for bankruptcy prediction. We compare
prediction results with classifiers such as Support Vector Machines (SVM), Relevance
Vector Machines (RVM) and the simple k-Nearest Neighbor (KNN) in the same data
set, showing comparable accuracy. Furthermore, the proposed approach is shown to
have excellent visualization capabilities, as a result of the incorporation of prior knowl-
edge of a variable (indicating bankruptcy risk) into a dissimilarity matrix.
2 Methods
Supervised nonlinear dimensionality reduction can be used as a preprocessing step be-
fore classification. The rationale here is to map the high-dimensional data space into
a lower dimensional space where classification methods do not suffer from the curse
of dimensionality. As the explicit mapping is not found by the algorithm some learn-
ing methodology must be used. Our approach uses the training labels in the data set to
provide a better construction of features. We apply the dissimilarity measure (1) [2]
D(xi, xj) =
((a − 1)/a)
1/2
if ci = cj
a1/2
− d0 if ci = cj
(1)
where a = 1/e−d2
ij /σ
with dij set to one of the distance measures described above, σ
is a smoothing parameter, do is a constant (0 ≤ d0 ≤ 1) and ci, cj are the class labels.
3 Results
Testing was carried out with a sample of Diane database of financial statements of
French companies. The dataset includes information about 30 financial ratios, of about
60 000 industrial French companies, for the years of 2002 to 2006, with at least 10
employees. Figure 1 shows the visible separation of patterns (from healthy to bankrupt
firms) with prior knowledge of the bankruptcy risk variable incorporated into the dis-
similarity matrix. In the picture on the right, trustiworthiness measures are also shown.](https://image.slidesharecdn.com/manifoldlearningpaper178-130506040648-phpapp01/85/Manifold-learning-for-bankruptcy-prediction-1-320.jpg)
![Bankruptcy Analysis for Credit Risk using Manifold
Learning
B Ribeiro1
, A Vieira2
, J Duarte2
, C Silva1,3
, J Carvalho das Neves4
,
Q Liu5
, and A H Sung5
1
CISUC, Department of Informatics Engineering,University of Coimbra, Portugal
2
Physics Department, Polytechnic Institute of Porto, Portugal
3
ESTG- Polytechnic Institute of Leiria, Portugal
4
ISEG - School of Economics, Technical University of Lisbon, Portugal
5
Computer Science Department, University of New Mexico Tech, USA
bribeiro@dei.uc.pt,asv@isep.pt,jcneves@iseg.utl.pt,sung@cs.nmt.edu
1 Introduction
In this work we apply manifold learning to a real data set of distressed and healthy com-
panies for proper geometric tunning of similarity data points and visualization. While
Isomap [1] algorithm is often used in unsupervised learning, our approach combines
this algorithm with information of class labels for bankruptcy prediction. We compare
prediction results with classifiers such as Support Vector Machines (SVM), Relevance
Vector Machines (RVM) and the simple k-Nearest Neighbor (KNN) in the same data
set, showing comparable accuracy. Furthermore, the proposed approach is shown to
have excellent visualization capabilities, as a result of the incorporation of prior knowl-
edge of a variable (indicating bankruptcy risk) into a dissimilarity matrix.
2 Methods
Supervised nonlinear dimensionality reduction can be used as a preprocessing step be-
fore classification. The rationale here is to map the high-dimensional data space into
a lower dimensional space where classification methods do not suffer from the curse
of dimensionality. As the explicit mapping is not found by the algorithm some learn-
ing methodology must be used. Our approach uses the training labels in the data set to
provide a better construction of features. We apply the dissimilarity measure (1) [2]
D(xi, xj) =
((a − 1)/a)
1/2
if ci = cj
a1/2
− d0 if ci = cj
(1)
where a = 1/e−d2
ij /σ
with dij set to one of the distance measures described above, σ
is a smoothing parameter, do is a constant (0 ≤ d0 ≤ 1) and ci, cj are the class labels.
3 Results
Testing was carried out with a sample of Diane database of financial statements of
French companies. The dataset includes information about 30 financial ratios, of about
60 000 industrial French companies, for the years of 2002 to 2006, with at least 10
employees. Figure 1 shows the visible separation of patterns (from healthy to bankrupt
firms) with prior knowledge of the bankruptcy risk variable incorporated into the dis-
similarity matrix. In the picture on the right, trustiworthiness measures are also shown.](https://image.slidesharecdn.com/manifoldlearningpaper178-130506040648-phpapp01/75/Manifold-learning-for-bankruptcy-prediction-1-2048.jpg)
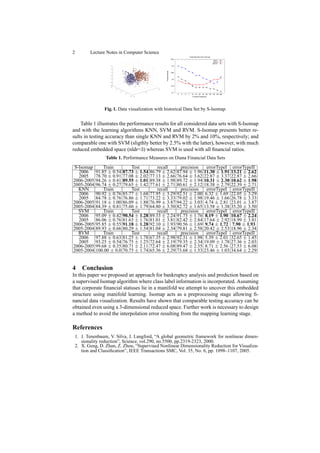

This document presents a method for bankruptcy prediction and analysis using manifold learning. Specifically, it applies the Isomap algorithm with class label information incorporated into the dissimilarity matrix (S-Isomap) on a real dataset of French companies. S-Isomap is shown to have comparable testing accuracy to other classifiers like SVM and better than KNN and RVM, while providing excellent lower-dimensional visualization with only 3 dimensions. The S-Isomap approach achieves separability of patterns from healthy to bankrupt firms in the embedded space. This preprocessing technique using manifold learning is a promising approach for bankruptcy prediction and analysis on high-dimensional financial data.