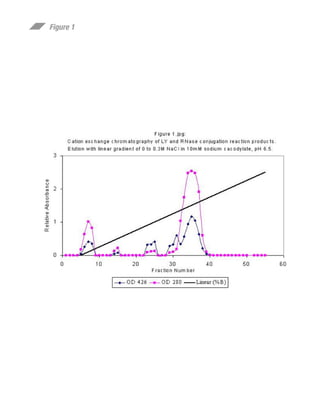
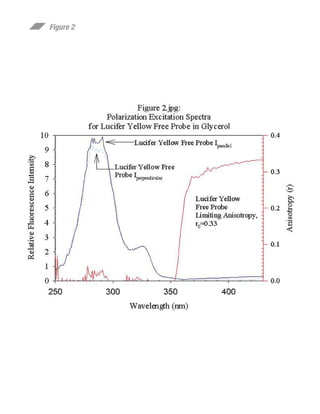
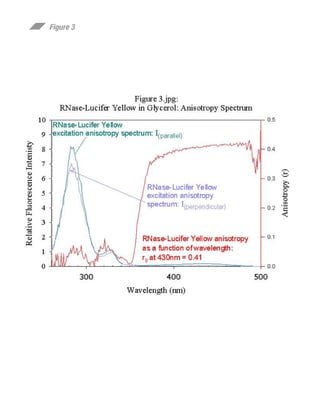
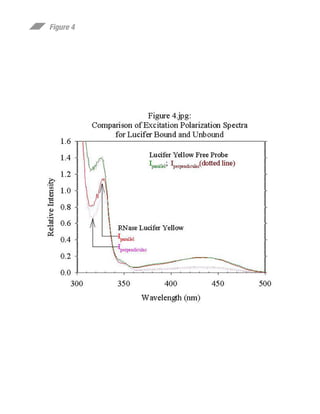
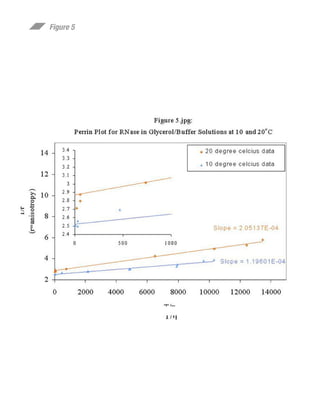
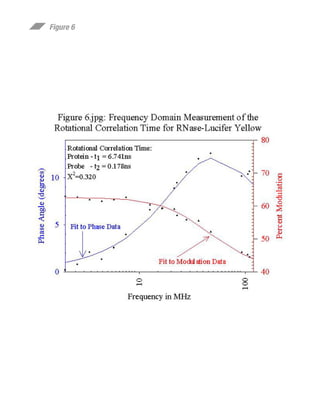
1. Preparation and Fluorescence Anisotropy Study of a Ribonuclease-Lucifer Yellow
Conjugate
Malone, Christine1; Sumida, John2; Pusey, Marc3.
1. USRA, 4950 Corporate Drive, Suite 100, Huntsville, AL 35806
256-544-2709, christine.malone@msfc.nasa.gov
2. USRA, 4950 Corporate Drive, Suite 100, Huntsville, AL 35806
256-544-0669, john.sumida@msfc.nasa.gov
3. NASA/Marshall Space Flight Center, Biophysics SD48, Huntsville, AL 35812
256-544-7823, marc.pusey@msfc.nasa.gov
Abstract
We have prepared a chemical derivative of ribonuclease A (RNase) with lucifer yellow
(LY). The rotational dynamics of the LY-RNase conjugate were characterized by steady
state and time resolved fluorescence techniques. Steady state anisotropy measurements
were performed at varying viscosities at 10oC and 20oC, and the rotational correlation
time of both RNase and the covalently linked LY probe were determined by time
resolved frequency domain measurement. Our data suggest that the fluorophore is rigidly
bound at 10oC.
Introduction
Fluorescent spectroscopy is proving to be a powerful tool to study the protein crystal
nucleation and growth process. While most proteins are intrinsically fluorescent, working
at crystallization concentrations necessitate the use of covalently prepared derivatives
added as tracers. This approach requires that these derivatives do not markedly affect the
crystal packing. We have previously prepared a number of fluorescent conjugates of
chicken egg white lysozyme, and now have initiated the synthesis of fluorescent
derivatives of RNase. Previous work, which we have been able to duplicate, has shown
that the probe iodoacetamide-5-(2-aminoethyl)aminonapthalene-1-sulfonic acid,
(IEDANS), can be bound to one of the active site histidine residues, where it is
apparently bound with no independent motion.(1,2) We have now succeeded in using the
reactivity of the active site histidines to incorporate the fluorescent probe lucifer yellow,
(LY) into RNase A. Such a derivative can be used for fluorescence anisotropy and
energy transfer studies of protein crystal nucleation. We have used this probe to
characterize the rotational dynamics of RNase A.
Purpose
It has been suggested that protein crystallization proceeds through the ordered self
assembly of monomeric protein units.(3,4,5) In order to characterize this process,
fluorescence studies of various protein systems have been initiated. At present the
2. research strategy is two-fold. Firstly, steady state and time resolved methods are being
used to observe and quantitate resonance energy transfer between spectrally matched
protein-fluorophore conjugates. This work yields solution based structural information
about self-assembled precrystallographic assemblies. Secondly, both steady state and
time resolved fluorescence techniques are being used to observe and quantitate the
rotational dynamics of the protein and assemblies in solution. These measurements yield
information regarding the dimensions of the self-assembled species in solution.
In this paper, the covalent binding of an exogenous fluorophore, lucifer yellow, to RNase
at the HIS 12 residue is presented. Additionally using the fluorescence of the
fluorophore, the rotational dynamics of the protein-fluorophore system is characterized in
order to determine: (1) the degree of rigidity of the bound LY; (2), the rotational
correlation time of RNase; (3), the rotational diffusion coefficient of RNase; (4), the
molecular volume of the protein-fluorophore system.
Materials and Methods
RNase A, (bovine pancreas Type 1-A, Sigma) was purified by ion-exchange
chromatography.(6) Conjugates of LY (iodacetamide, dipotassium salt, Molecular
Probes), were prepared based on the method of Jullien and Garel.(7) The reaction mixture
contained 7.5×10⁻⁴ M RNase and 0.001M LY in 200mM sodium cacodylate, pH=5.5.
The reaction proceeded for 48 hours at room temperature, with continuous stirring, and
was protected from light. Gel filtration was used to remove unbound fluorophore. LY
derivative was purified from nonderivatized protein by cation exchange, (CM-
Macroprep, BioRad), chromatography, (Figure 1.jpg). Protein was eluted with a salt
gradient from 0 to 0.3M NaCl in 10mM sodium cacodylate buffer, pH=6.5. Major peak
fractions with the highest degree of labeling were collected. Labeled protein yield was
determined to be approximately 82%.
For the steady state anisotropy measurements, solutions of glycerol and buffer, (0.05M
Tris buffer with a pH = 7.5), were prepared in order to vary the viscosity. Temperature
was also varied by using circulated water from a water bath set to –20oC in conjunction
with a stream of cold air also precooled by the water bath.
Using both circulated water and cooled air, an effective temperature of 10oC +/- 2oC was
achieved inside the sample compartment. The temperature inside the sample
compartment was monitored using a Digisense Thermistor with a thermocouple.
Viscosities at 10oC were corrected from their room temperature values using both a four
parameter correlation, (8), and a two parameter correlation for glycerol-water solutions of
fixed composition, (9). Since the latter correction provided a more continuous range of
corrected viscosity values for the data collected, the two parameter correlation was used
in the final analysis.
The fluorescence anisotropy was determined using the ISS K2 frequency domain
fluorimeter. The anisotropy was measured as a function of wavelength by collecting
plane polarized excitation spectra. This was done by setting the relative positions of the
3. Equation 1
I(λ )VV - I(λ )VH G
r=
I(λ )VV + 2GI(λ )VH
excitation polarizer and emission polarizers at 90o and 90o; 90o and 0o; 0o and 0o; and 0o
and 90o, respectively. These positions were designated HH, HV, VV, and VH; H refers to
the horizontal position and V to the vertical position of the polarizer. Excitation spectra
were collected for each orientation and the anisotropy was determined using equation 1,
where I(λ)VV and I(λ)VH, are the intensity excitation spectra collected with the excitation
and emission polarziers set to 0o and 0o, and to 0o and 90o respectively. G is a correction
factor which corrects for polarization dependent sensitivity of the detector and emission
optics. For these measurements this factor should be close to unity since there was no
monochromator in the emission channel, only a 515nm long pass filter. The G factor was
determined by measuring the horizontally polarized excitation when the emission
polarizers were set to the horizontal and vertical positions, equation 2
Equation 2
I(λ )HV
G=
I(λ )HH
Results
Shown in Figure 2.jpg are the excitation spectra collected at all four polarizer orientations
along with the resulting anisotropy spectrum for the LY free probe measured in 100%
glycerol. In the long wavelength regions the anisotropy reaches a maximum of 0.33
Equation 3
2
3 cosβ −1
r = ro
2
which is equivalent to the limiting anisotropy for this compound. Using equation 3,
where β is the angle between the excitation and emission transition dipole moments, the
angle β was determined to be 16.78o for the unbound fluorophore.
The anisotropy spectrum for LY bound to RNase at HIS 12, RNase-LY, is shown in the
Figure 3.jpg. As in the previous figure the excitation spectra for each polarizer orientation
are shown along with the resulting wavelength dependent anisotropy. In this case, the
anisotropy approaches a maximum of 0.4 in the long wavelength region, indicating that
for the bound probe, the excitation and emission dipoles are colinear. This may reflect
4. either the slower rotation of the bound RNase-LY system, or a change in the absorption
and emission properties of the fluorophore upon binding, or a combination of both.
Figure 3.jpg indicates that upon covalent attachment to RNase, the LY polarization
spectrum at 325nm undergoes a 5nm redshift, and decomposes into two distinct
polarization spectra representing two distinct transition moments. Furthermore, the
decrease in the peak amplitude at 325nm is a reflection of the quenched emission
observed for the bound LY versus the unbound form of the fluorophore. The spectra in
the 360nm to 500nm range are unchanged.
The spectral shifts observed in the 325nm region are most likely due to the interaction of
the fluorophore with the protein which absorbs in this region. The increase in the
anisotropy from 0.33, for the unbound fluorophore, to 0.40, for the bound fluorophore, is
indicative of the differential effect that binding has on the two transition moments
observed. Since the anisotropy is at a maximum value for the bound fluorophore, the
absorption and emission dipoles must be colinear. Consequently, excitation and emission
presumably occur from the same electronic state.(10) In contrast for the free fluorophore
absorption and emission are characterized by the fractional contributions of two different
electronic states. The spectra in the 360nm to the 500nm region are unchanged because
RNase does not display any absorption in this region.
The rotational dynamics of the RNase-LY system were characterized by both steady state
and time resolved methods. For a series of glycerol water mixtures, the anisotropy of the
bound fluorophore was measured by observing the emission through a 515nm long pass
filter at 10oC and 20oC. The results of these steady state measurements are plotted in
Figure 4.jpg.
Equation 4
1 1 τ
= +
r r0 θ ⋅ r0
Using the perrin relationship, equation 4, the anisotropy displays a linear relationship to
the rotational correlation time, θ, (see Figure 5.jpg); τ is the lifetime, and r0 is the limiting
anisotropy. Since the correlation time is related to the hydrodynamic volume, equation 4
can be rewritten as equation 5.
Equation 5
1 1 τ ⋅R ⋅T
= +
r r0 η ⋅ Vh
5. where the correlation time, θ, = η⋅Vh/R⋅T; η is the viscosity. This data then yields a
value for the hydrodynamic volume at 10oC equal to 1.8×10⁴ Å3/molecule, and at 20oC,
the hydrodynamic volume is determined to be 1.2×10⁴ Å3/molecule.
Figure 4.jpg not only provides information regarding the hydrodynamic volume of the
protein, but also provides information regarding the rotational dynamics of the
fluorophore bound to the protein as well as the rotational dynamics of the protein as a
whole.
The graph shows data collected at two temperatures, 10oC and 20oC. At high viscosity,
the 10oC data sets converges to a value of 1/r = 2.5 which corresponds to r0 = 0.4; the
20oC data set converges to a value of 1/r = 2.7, (see inset in Figure 5.jpg). As the
viscosity is decreased, the anisotropies measured at 10oC extend linearly away from the
y-intercept, however in contrast, the 20oC data shows an increase before displaying
linearity, such that the y-intercept is offset to a value of 2.9 which corresponds to an
apparent r0 = 0.34, reminiscent of the value obtained for the free fluorophore in glycerol.
This offset in the 20oC data reflects relative mobility of the bound fluorophore that is not
observed for the same protein-fluorophore combination at 10oC. This data indicates that
at 10oC the bound fluorophore is held rigidly in place.
To further quantitate these rotational motions, frequency domain measurements were
performed to extract the rotational correlation times of RNase and the segmental motion
of LY. The results are illustrated in Figure 6.jpg.
The steady state measurements suggest that the room temperature anisotropy in viscous
solution is dominated by the rotational motions characteristic of the free unbound
fluorophore, r0-apparent = 0.34. Recall that for the unbound fluorophore r0-free probe = 0.33.
The time-resolved measurements performed in the frequency domain support this initial
observation. The shift to larger phase angles observed at higher modulation frequencies is
indicative of rapid rotational motions of the bound LY. The anisotropy decay was fit
using equation 6.
Equation 6
t
−
θj
r ( t ) = r0 ∑ e
j
Two exponentials were found to be sufficient to fit the decay with a chi-squared value,
χ2=0.320. From this, two correlation times were resolved, θ1=6.7ns and θ2=0.1ns. The
shorter 100ps time constant is assigned to the segmental motion of the bound
fluorophore, LY. The longer 6.7ns time constant is assigned to the rotational motion of
RNase, and yields a rotational diffusion coefficient of 2.49×10⁷ s-1. Using equation 3 and
5, the rotational correlation time further yields a measure of the protein volume of
6. 2.7×10⁴ Å3/molecule. Since the time resolved measurement is not as sensitive to trivial
factors such as scattered light and concentration effects, which affect the linearity of the
steady state measurements, the volume derived from the time resolved measurements is
thought to be a more accurate measure of the hydrodynamic volume at room temperature.
Conclusion
The purpose of this work was to characterize the rotational dynamics of RNase through
the fluorescence anisotropic decay of the attached exogenous fluorophore, LY. The
results presented above indicate that the RNase-LY system exhibits segmental motion of
the fluorophore at 20oC which is distinguishable from the 6.7ns correlation time
measured for the protein. Furthermore, the steady state anisotropy measurements
indicate that these segmental motions are no longer apparent at 10oC. This data also
suggests that the hydrodynamic volume decreases by a factor of 1.5 at the higher
temperature. Whether this is a result of an actual change in the hydration of the protein,
or merely a consequence of the segmental mobility of the fluorophore at this temperature
will require further work. The results from this study along with the structural
information gleaned from resonance energy transfer, will be used to further understand
the self assembly mechanisms involved in the crystallization process.
7. List of Figures
Figure 1: Cation exchange chromatography of LY and RNase-A conjugation reaction
products. Elution with linear gradient of 0 to 0.3M NaCl in 10mM sodium
cacodylate buffer, pH=6.5.
Figure 2: Polarization excitation spectra and anisotropy spectrum, (yellow), of the
unbound fluorophore, LY in glycerol.
Figure 3: Polarization excitation spectra and anisotropy spectrum, (yellow), of the bound
LY-RNase conjugate.
Figure 4: Comparison of polarization excitation spectra unbound LY, (blue), and the
bound LY-RNase conjugate, (yellow).
Figure 5: Perrin plot for RNase in aqueous solutions of glycerol at 10oC and 20oC.
Figure 6: Frequency domain fluorescence data showing the variation in phase angle and
modulated emission as a function of the frequency of the modulated excitation
light. The sample is the RNase-LY in 0.05M Tris at pH=7.5 and 7%NaCl.
8. References
1. Jullien, Magali; Crosio, Marie-Pierre, Journal of Crystal Growth, Vol. 110, 182-
187, 1992.
2. Magali, Jullien; Crosio, Marie-Pierre, Journal of Crystal Growth, Vol. 122, 66-
70, 1992.
3. Li, Huyayu; Perozzo, Mary A.; Konnert, John H.; Nadarajah, Arunan; Pusey
Marc L., Acta Cryst., Vol. D55, 1023-1035, 1999.
4. Forsythe, Elizabeth; Nadarajah, Arunan; Pusey, Marc L., Acta. Cryst., Vol.
D55, 1005-1011, 1999.
5. Li, Huyayu; Nadarajah, Arunan; Pusey, Marc. L., Acta. Cryst., Vol. D55, 1036-
1045, 1999.
6. Garel, J.R. European Journal of Biochemistry, Vol. 70, 179-189, 1976.
7. Jullien, M., Biochemistry, Vol. 20, 7021-7026, 1981.
8. Chen, Yen-Ming; Pearlstein, Arne J. Ind. Eng.Chem. Res., Vol. 26, 1670-1672,
1987.
9. Litovitz, Theodore A. Journal of Chemical Physics, Vol .20, No. 7, 1088-1089,
1952.
10. Lakowicz, Joseph R. Principles of Fluorescence Spectroscopy, 2nd edition,
Kluwer Academic/Plenum Publishers, New York: 1999.
11. Weber, G. Biochem. J., Vol. 51, 155-167, 1952.