Download to read offline
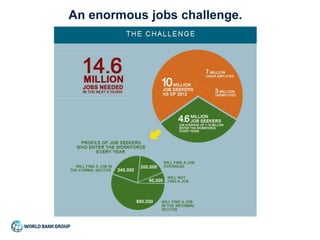
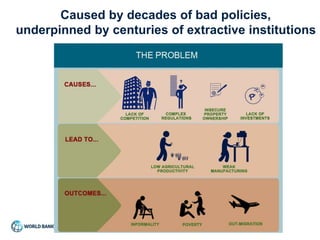
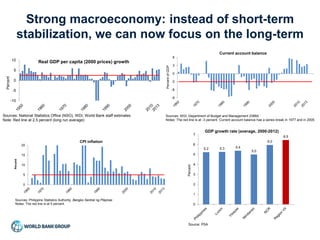
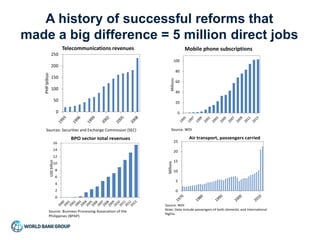
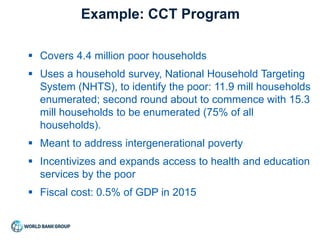
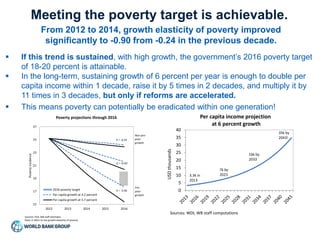
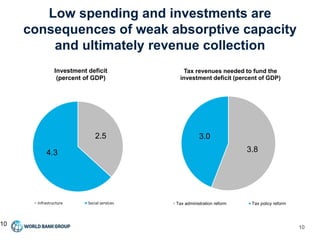


1) The document discusses the enormous jobs challenge in the Philippines caused by decades of bad policies and extractive institutions. However, strong economic reforms over the past decades have helped create over 5 million direct jobs. 2) Growth is becoming more inclusive in the Philippines, translating to stronger job creation and faster poverty reduction. Sustained growth could potentially eradicate poverty within a generation if reforms are accelerated. 3) Meeting the government's 2016 poverty target of 18-20% is achievable if high growth continues. Sustained 6% growth per year could increase per capita income over 11 times in 3 decades. However, this requires raising tax revenues through tax policy and administration reforms to fund necessary investments.


