Download to read offline

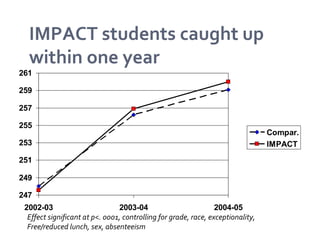
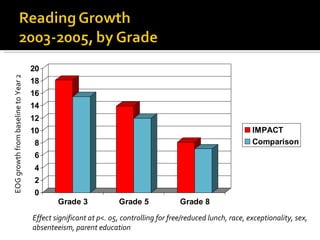
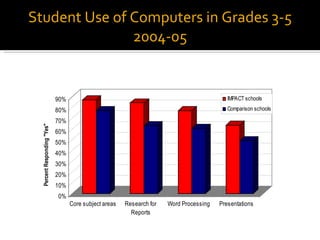
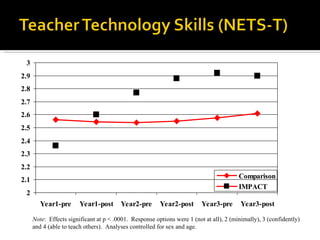
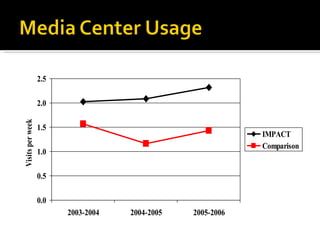
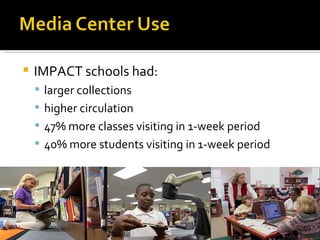
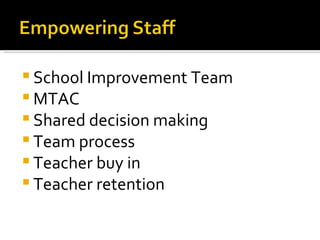
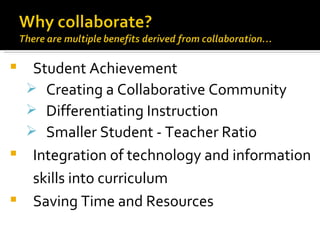
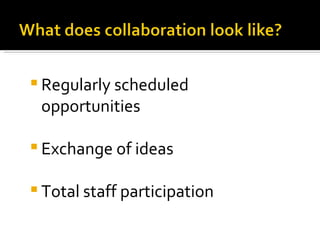
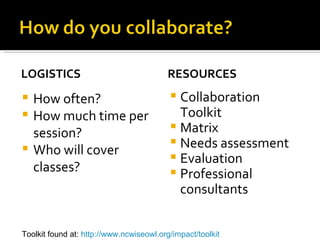
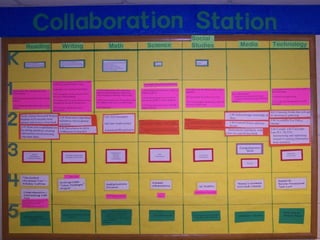
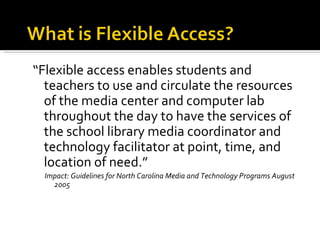
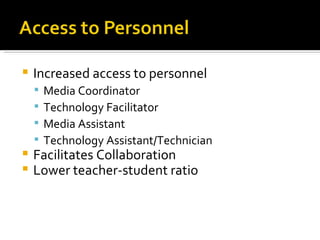
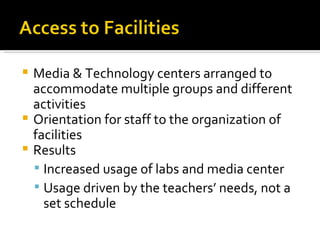


The document outlines best practices for using media and technology in schools based on a program called IMPACT. It finds that IMPACT schools saw significant growth in student test scores and computer use. IMPACT schools also had larger media collections, higher circulation, and more classes visiting their media centers compared to non-IMPACT schools. The document recommends that schools prioritize collaboration between teachers and media/technology staff, provide flexible access to resources, and regularly schedule professional development opportunities to integrate technology into teaching.


