The document discusses the growing problem of electronic waste (e-waste) in Nigeria. E-waste is increasing rapidly due to the short lifecycles of electronics and dumping by developed countries. Nigeria generates large quantities of e-waste but lacks proper management systems, resulting in health and environmental issues. Common recycling practices like open burning release toxic chemicals. The study aims to assess e-waste management in Ikeja Computer Village, Nigeria to understand available waste, disposal methods, stakeholders, and improvements needed.

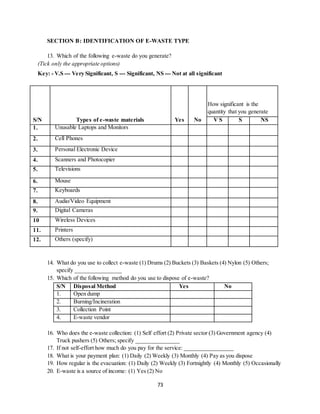
![22
because the recipient countries often do not recycle and dispose the waste in an environmentally
sound manner, which is not compatible with the standards set in the country of export.
2.1.3 Methods of e-waste Disposal
In 1990s, governments of the EU, Japan and some of the US states set up E-waste 'recycling'
systems, whereas, a large member of countries did not have the capacity to deal with the sheer
quantity of E-waste they have generated or with its hazardous nature. Therefore, they began
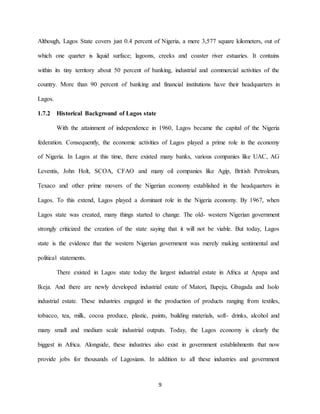
exporting the issue to developing countries, where laws to protect workers and the environment
are inadequate or is not enforced. It is also cheaper to 'recycle' waste in developing countries; the
cost of glass-to-glass recycling of computer monitors in the U.S. is ten times more than in China.
Demand in Asia for electronic waste began to grow, when they found out that they could
extract valuable substances, such as, copper, iron, silicon, nickel and gold during the recycling
process in scrapyards. A cell phone, for instance, contains 19 percent copper and eight percent
iron. Almost two million tonnes of E-waste were landfilled in 2005, that is, while toxic materials
comprise only a small amount of this volume, which does not take much lead or mercury to
contaminate the soil of an area or water supply. One should keep this in mind, when deciding
what to do with those old electronic devices.
(i) Landfill
According to the US EPA [14], more than 4.6 million tonnes of E-waste ended up in the U.S.
landfills in 2000. Toxic chemicals in electronic products can leach into the land over time or are
released into the atmosphere, impacting nearby communities and the environment. Regulations
have been declared to prevent electronic waste being dumped in landfills due to its hazardous
content in many European countries. However, the practice still continues in numerous countries.](https://image.slidesharecdn.com/516c54a2-e383-4257-9cf6-23b322b7616b-160426233925/85/Main-project-22-320.jpg)
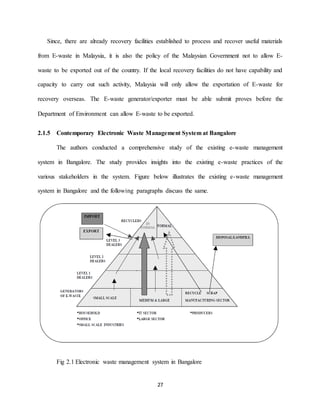
![32
Africa, there is both formal and informal mobile phone E-waste recycling taking place (BAN,
2005; Nnorom and Osibanjo, 2008).
L.-G. Scheidt, et al. (1995) reported that “CARE “VISION 2000” (Comprehensive
Approach for the Recycling of Electronics) at Europe is to increase the value of recycling by
driving down costs, reducing the amount of e-waste and hazardous material and thus the impact
on the environment. Ultimately, the objective of CARE “VISION 2000” is to transform
recycling into an industrial system.”
Rickard Svensson, et al. (2005) reported that “Most of the Waste Electrical and
Electronic Equipment (WEEE) in Sweden are collected at manned recycling centers, which play
a key role for the downstream handling in order to ensure high collection rates of WEEE and a
proper initial sorting. The Swedish concept for collection of WEEE is based on manual work
which is quite risky for the employees”.
2.2.1 E-waste and new concepts of creating value
A significant proportion of studies on e-waste management have focused on themes of
negative health effects and toxicology as well as on themes of environmental justice (Lepawsky
and Billah, 2011). In West Africa, this is reflected in the works of Fuhriman (2008), Nnorom and
Osibanjo (2009) and Robinson (2009) to name a few. Additional studies like that of Williams
(2004, [cited by Lepawsky and Billah, 2011] address the energy flows in production of
electronics and in the disposal process. However, Lepawsky and Billah (2011) highlight the need
to also address e-waste recycling from a perspective that does not automatically assume
electronics to be valueless after they stop functioning. The very fact that informal waste
recycling occurs in developing countries is proof of this.](https://image.slidesharecdn.com/516c54a2-e383-4257-9cf6-23b322b7616b-160426233925/85/Main-project-32-320.jpg)