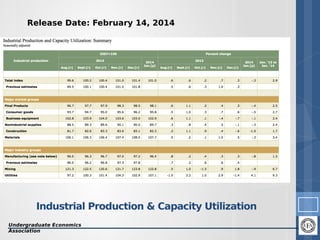
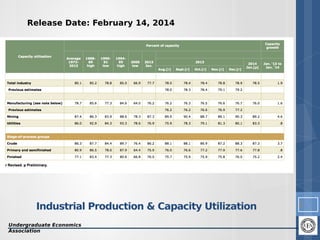
Download to read offline
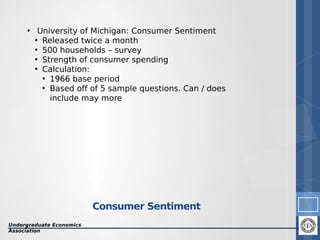

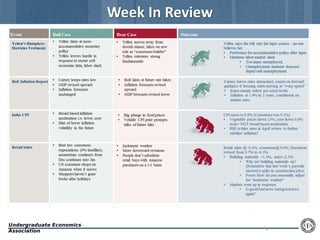
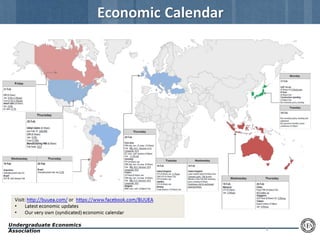
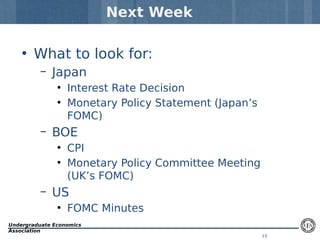

This document provides an overview and analysis of industrial production, capacity utilization, and consumer sentiment for week 3. It discusses the key indicators for industrial production and capacity utilization, including their classification and historical averages. The document also reviews consumer sentiment data from the University of Michigan survey and release dates. Finally, it previews important economic reports and central bank meetings to watch in the following week from Japan, the UK, and the US.