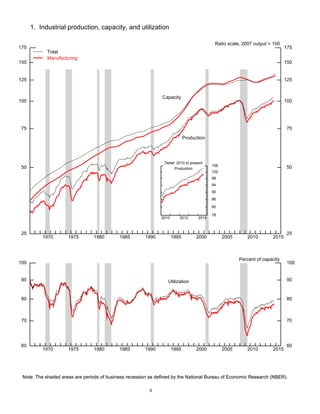
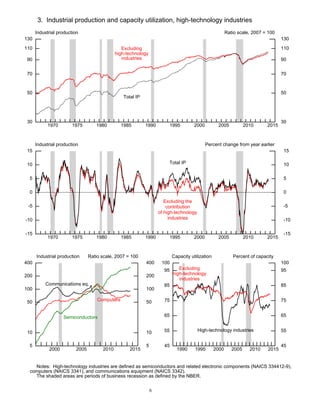
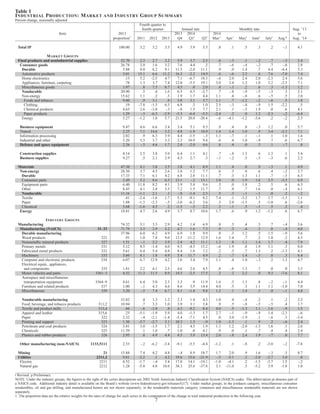
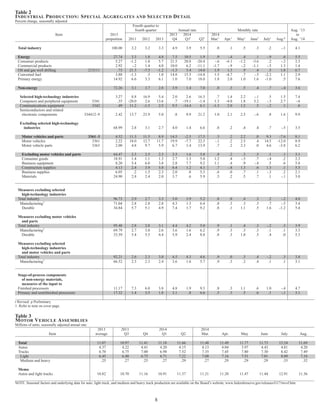
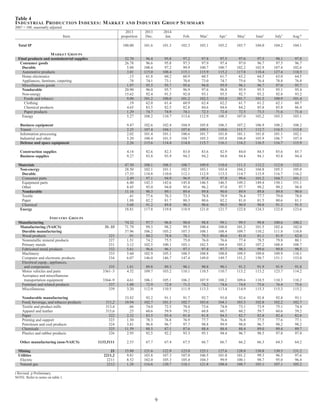
1) Industrial production edged down 0.1% in August, the first decline since January, driven by a 7.6% drop in motor vehicle production. Excluding motor vehicles, factory output rose 0.1%.
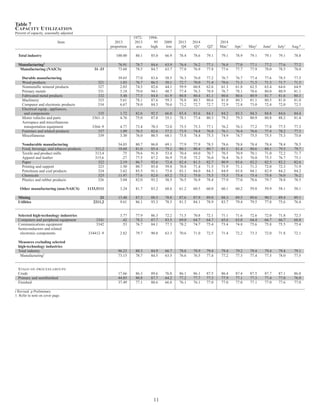
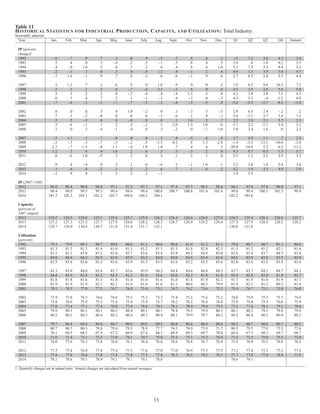
2) Capacity utilization for total industry decreased 0.3 percentage points to 78.8%, 1.0 percentage point above a year ago but 1.3 points below its long-run average.
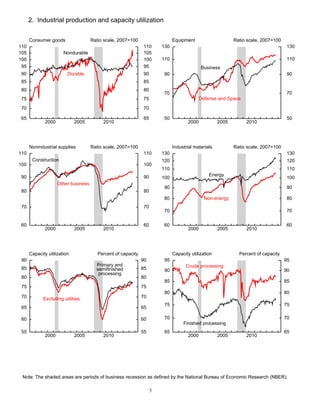
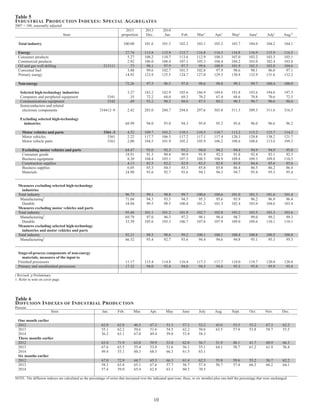
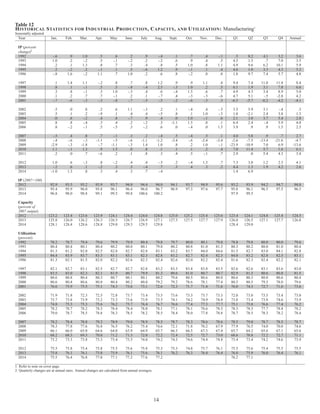
3) Manufacturing production fell 0.4% in August, with durable goods down 0.9% due to lower motor vehicle output, while nondurables rose 0.2%. Capacity utilization for manufacturing dropped 0.4 points to 77.2%.