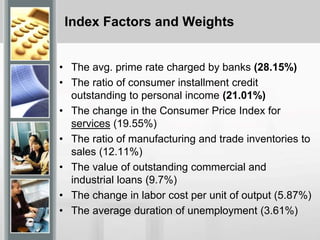
![CPI for Services
Historical Trend (1980-2013)
The index for all items less food and
energy increased 0.1 percent in
March following increases of 0.3
percent in January and 0.2 percent
in February. 1982-84=100
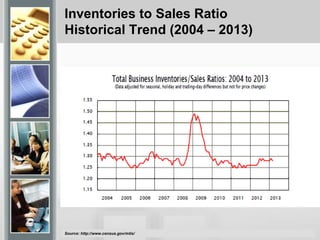
Source: http://research.stlouisfed.org/fred2/graph/?s[1][id]=CPILFESL
232.76
0.000
50.000
100.000
150.000
200.000
250.000
Jan-70
May-71
Sep-72
Jan-74
May-75
Sep-76
Jan-78
May-79
Sep-80
Jan-82
May-83
Sep-84
Jan-86
May-87
Sep-88
Jan-90
May-91
Sep-92
Jan-94
May-95
Sep-96
Jan-98
May-99
Sep-00
Jan-02
May-03
Sep-04
Jan-06
May-07
Sep-08
Jan-10
May-11
Sep-12
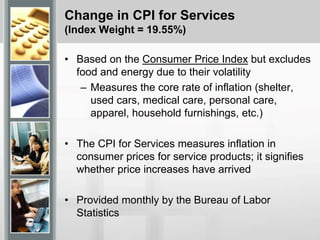
CPI for Services
Jan 79 – Dec 80
Average = .93%](https://image.slidesharecdn.com/economiclaggingindicators-130424135425-phpapp02/85/Lagging-economic-indicators-10-320.jpg)
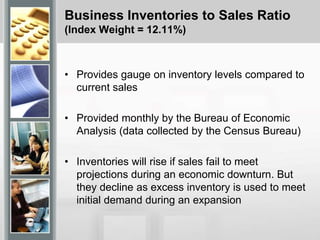
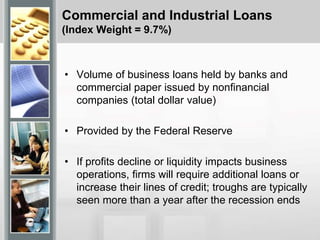
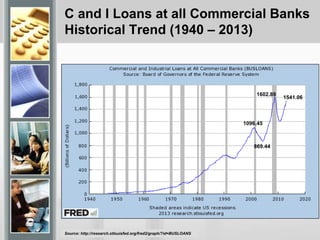
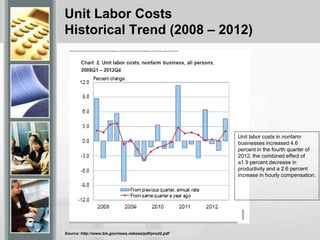
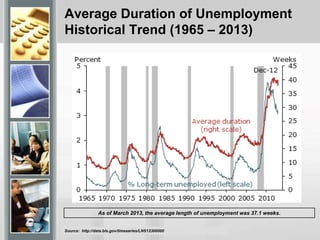
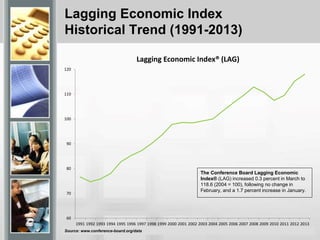


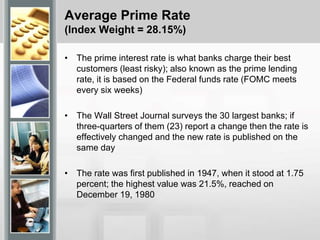
The composite index of lagging indicators is published monthly by The Conference Board to track changes in the business cycle after they have occurred. It comprises seven economic measures weighted as follows: the average prime rate charged by banks (28.15%), consumer debt to income ratio (21.01%), change in consumer price index for services (19.55%), business inventories to sales ratio (12.11%), commercial and industrial loans (9.7%), change in labor costs per unit of output (5.87%), and average duration of unemployment (3.61%). The index provides confirmation that the business cycle has shifted to a new stage, indicating peak and trough turning points. In March 2013, the lagging index increased 0.


