
Download to read offline
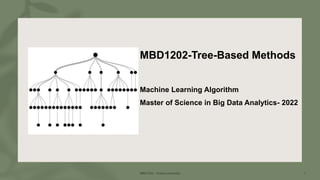
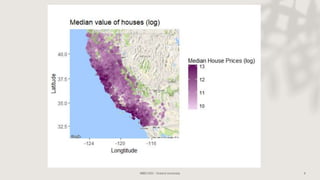
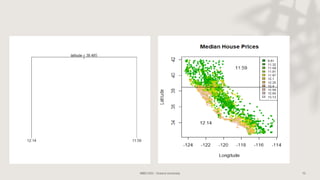
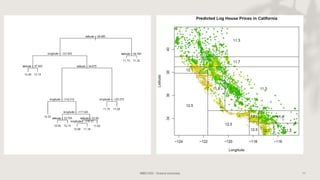
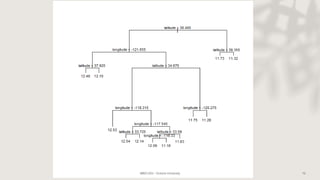
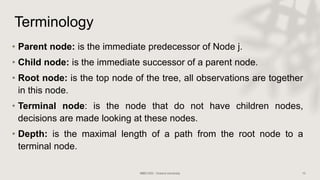
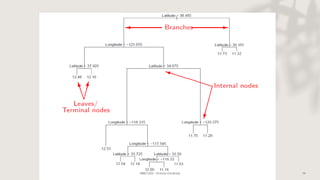
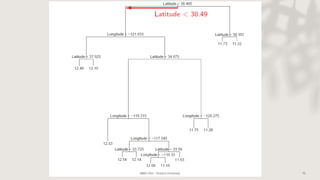
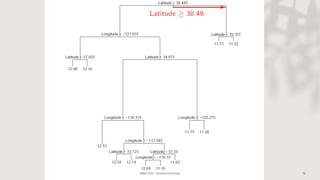
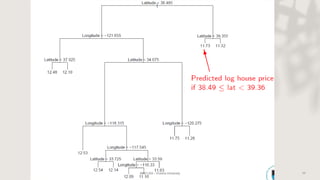
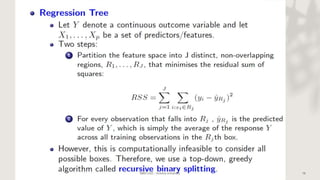
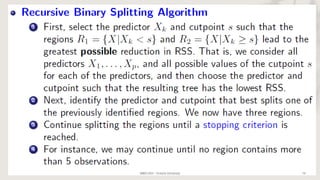
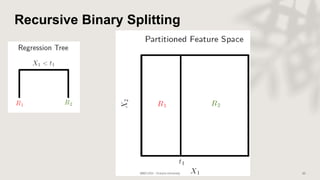
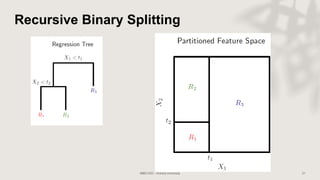
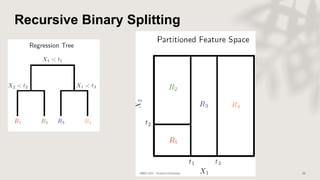
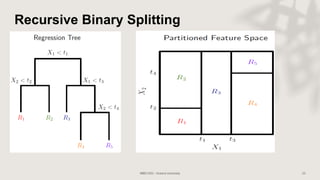

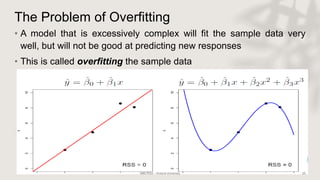
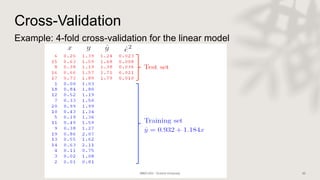
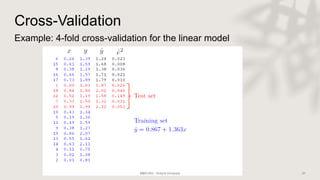
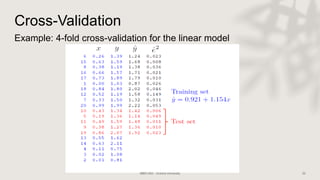
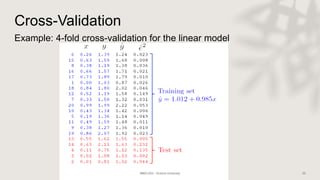
Classification and regression trees (CART) are decision tree models that can be used for both classification and regression problems. CART builds trees using recursive partitioning that splits nodes based on predictor variables. This example document discusses regression trees using a California housing dataset to predict median home prices based on location and other attributes. It covers terminology like parent and child nodes, recursive binary splitting to create the tree structure, overfitting, cross-validation to evaluate model performance, and pruning trees to optimize complexity.


