SlideShare a Scribd company logo
1 of 2
Logistic Regression
Logistic model (or logit model) is used to model the probability of events realized in two
classes such as alive/dead or healthy/sick etc. This can be extended to model several classes of
events such as determining whether an image contains a cat, dog, lion, etc. Each object being
detected in the image would be assigned a probability between 0 and 1, the sum adding to one.
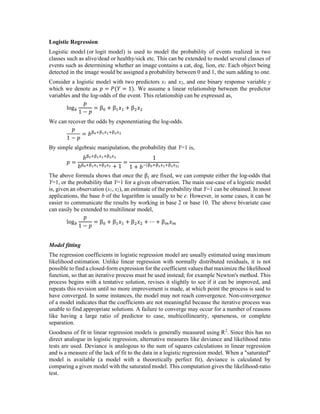
Consider a logistic model with two predictors x1 and x2, and one binary response variable y
which we denote as 𝑝 = 𝑃(π‘Œ = 1). We assume a linear relationship between the predictor
variables and the log-odds of the event. This relationship can be expressed as,
log
𝑝
1 βˆ’ 𝑝
= Ξ² + Ξ² π‘₯ + Ξ² π‘₯
We can recover the odds by exponentiating the log-odds.
𝑝
1 βˆ’ 𝑝
= 𝑏
By simple algebraic manipulation, the probability that Y=1 is,
𝑝 =
𝑏
𝑏 + 1
=
1
1 + 𝑏 ( )
The above formula shows that once the Ξ² are fixed, we can compute either the log-odds that
Y=1, or the probability that Y=1 for a given observation. The main use-case of a logistic model
is, given an observation (x1, x2), an estimate of the probability that Y=1 can be obtained. In most
applications, the base b of the logarithm is usually to be e. However, in some cases, it can be
easier to communicate the results by working in base 2 or base 10. The above bivariate case
can easily be extended to multilinear model,
log
𝑝
1 βˆ’ 𝑝
= Ξ² + Ξ² π‘₯ + Ξ² π‘₯ + β‹― + Ξ² π‘₯
Model fitting
The regression coefficients in logistic regression model are usually estimated using maximum
likelihood estimation. Unlike linear regression with normally distributed residuals, it is not
possible to find a closed-form expression for the coefficient values that maximize the likelihood
function, so that an iterative process must be used instead; for example Newton's method. This
process begins with a tentative solution, revises it slightly to see if it can be improved, and
repeats this revision until no more improvement is made, at which point the process is said to
have converged. In some instances, the model may not reach convergence. Non-convergence
of a model indicates that the coefficients are not meaningful because the iterative process was
unable to find appropriate solutions. A failure to converge may occur for a number of reasons
like having a large ratio of predictor to case, multicollinearity, sparseness, or complete
separation.
Goodness of fit in linear regression models is generally measured using R2
. Since this has no
direct analogue in logistic regression, alternative measures like deviance and likelihood ratio
tests are used. Deviance is analogous to the sum of squares calculations in linear regression
and is a measure of the lack of fit to the data in a logistic regression model. When a "saturated"
model is available (a model with a theoretically perfect fit), deviance is calculated by
comparing a given model with the saturated model. This computation gives the likelihood-ratio
test.
𝐷 = βˆ’2ln
In the above equation, D represents the deviance and ln represents the natural logarithm. The
log of this likelihood ratio (the ratio of the fitted model to the saturated model) will produce a
negative value, hence the need for a negative sign. D can be shown to follow an
approximate chi-squared distribution. Smaller values indicate better fit as the fitted model
deviates less from the saturated model. When assessed upon a chi-square distribution,
nonsignificant chi-square values indicate very little unexplained variance and thus, good model
fit. Conversely, a significant chi-square value indicates that a significant amount of the variance
is unexplained.
Assessing the predictive ability of the model
One straightforward method to assess the predictivity is to compute the confusion matrix and
evaluate the accuracy. One can also resort to k-fold cross validation. As a last step, one may
also see the ROC (receiver operating characteristic) curve and calculate the AUC (area under
the curve) which are typical performance measurements for a binary classifier. The ROC is a
curve generated by plotting the true positive rate (TPR) against the false positive rate (FPR) at
various threshold settings while the AUC is the area under the ROC curve. As a rule of thumb,
a model with good predictive ability should have an AUC closer to 1 (1 is ideal) than to 0.5.

More Related Content

What's hot

correlation and regression
correlation and regressioncorrelation and regression
correlation and regressionKeyur Tejani
Β 
Multicolinearity
MulticolinearityMulticolinearity
MulticolinearityPawan Kawan
Β 
Correlation analysis
Correlation analysisCorrelation analysis
Correlation analysisVan Martija
Β 
Kendall's ,partial correlation and scatter plot
Kendall's ,partial correlation and scatter plotKendall's ,partial correlation and scatter plot
Kendall's ,partial correlation and scatter plotBharath kumar Karanam
Β 
Auto Correlation Presentation
Auto Correlation PresentationAuto Correlation Presentation
Auto Correlation PresentationIrfan Hussain
Β 
Research Methodology Module-06
Research Methodology Module-06Research Methodology Module-06
Research Methodology Module-06Kishor Ade
Β 
Correlation and Regression
Correlation and RegressionCorrelation and Regression
Correlation and Regressionjasondroesch
Β 
Correlation and regression
Correlation and regressionCorrelation and regression
Correlation and regressionMohit Asija
Β 
Advanced microeconometric project
Advanced microeconometric projectAdvanced microeconometric project
Advanced microeconometric projectLaurentCyrus
Β 
Econometric modelling
Econometric modellingEconometric modelling
Econometric modellingCAPE ECONOMICS
Β 
Autocorrelation
AutocorrelationAutocorrelation
AutocorrelationMuhammad Ali
Β 
Regression vs correlation and causation
Regression vs correlation and causationRegression vs correlation and causation
Regression vs correlation and causationGarimaGupta229
Β 

What's hot (17)

R - Multiple Regression
R - Multiple RegressionR - Multiple Regression
R - Multiple Regression
Β 
correlation and regression
correlation and regressioncorrelation and regression
correlation and regression
Β 
Multicolinearity
MulticolinearityMulticolinearity
Multicolinearity
Β 
Correlation analysis
Correlation analysisCorrelation analysis
Correlation analysis
Β 
Kendall's ,partial correlation and scatter plot
Kendall's ,partial correlation and scatter plotKendall's ,partial correlation and scatter plot
Kendall's ,partial correlation and scatter plot
Β 
Auto Correlation Presentation
Auto Correlation PresentationAuto Correlation Presentation
Auto Correlation Presentation
Β 
Multicollinearity PPT
Multicollinearity PPTMulticollinearity PPT
Multicollinearity PPT
Β 
Ch 7 correlation_and_linear_regression
Ch 7 correlation_and_linear_regressionCh 7 correlation_and_linear_regression
Ch 7 correlation_and_linear_regression
Β 
Numeros complejos y_azar
Numeros complejos y_azarNumeros complejos y_azar
Numeros complejos y_azar
Β 
Research Methodology Module-06
Research Methodology Module-06Research Methodology Module-06
Research Methodology Module-06
Β 
Correlation and Regression
Correlation and RegressionCorrelation and Regression
Correlation and Regression
Β 
Correlation and regression
Correlation and regressionCorrelation and regression
Correlation and regression
Β 
Advanced microeconometric project
Advanced microeconometric projectAdvanced microeconometric project
Advanced microeconometric project
Β 
Econometric modelling
Econometric modellingEconometric modelling
Econometric modelling
Β 
Correlation in Statistics
Correlation in StatisticsCorrelation in Statistics
Correlation in Statistics
Β 
Autocorrelation
AutocorrelationAutocorrelation
Autocorrelation
Β 
Regression vs correlation and causation
Regression vs correlation and causationRegression vs correlation and causation
Regression vs correlation and causation
Β 

Similar to Logistic Regression Model Fitting & Assessment

Logistic Regression.pptx
Logistic Regression.pptxLogistic Regression.pptx
Logistic Regression.pptxMuskaan194530
Β 
Data Science - Part XII - Ridge Regression, LASSO, and Elastic Nets
Data Science - Part XII - Ridge Regression, LASSO, and Elastic NetsData Science - Part XII - Ridge Regression, LASSO, and Elastic Nets
Data Science - Part XII - Ridge Regression, LASSO, and Elastic NetsDerek Kane
Β 
Logistic regression and analysis using statistical information
Logistic regression and analysis using statistical informationLogistic regression and analysis using statistical information
Logistic regression and analysis using statistical informationAsadJaved304231
Β 
Machine learning session4(linear regression)
Machine learning   session4(linear regression)Machine learning   session4(linear regression)
Machine learning session4(linear regression)Abhimanyu Dwivedi
Β 
Logistic regression
Logistic regressionLogistic regression
Logistic regressionRupak Roy
Β 
M8.logreg.ppt
M8.logreg.pptM8.logreg.ppt
M8.logreg.pptSuaibDanish
Β 
7. logistics regression using spss
7. logistics regression using spss7. logistics regression using spss
7. logistics regression using spssDr Nisha Arora
Β 
Logistic regression with SPSS examples
Logistic regression with SPSS examplesLogistic regression with SPSS examples
Logistic regression with SPSS examplesGaurav Kamboj
Β 
Get Multiple Regression Assignment Help
Get Multiple Regression Assignment Help Get Multiple Regression Assignment Help
Get Multiple Regression Assignment Help HelpWithAssignment.com
Β 
Regression with Time Series Data
Regression with Time Series DataRegression with Time Series Data
Regression with Time Series DataRizano Ahdiat R
Β 
Simple Linear Regression.pptx
Simple Linear Regression.pptxSimple Linear Regression.pptx
Simple Linear Regression.pptxAbdalrahmanTahaJaya
Β 
Heteroscedasticity Remedial Measures.pptx
Heteroscedasticity Remedial Measures.pptxHeteroscedasticity Remedial Measures.pptx
Heteroscedasticity Remedial Measures.pptxPatilDevendra5
Β 
Applications of regression analysis - Measurement of validity of relationship
Applications of regression analysis - Measurement of validity of relationshipApplications of regression analysis - Measurement of validity of relationship
Applications of regression analysis - Measurement of validity of relationshipRithish Kumar
Β 

Similar to Logistic Regression Model Fitting & Assessment (20)

Logistic Regression.pptx
Logistic Regression.pptxLogistic Regression.pptx
Logistic Regression.pptx
Β 
Data Science - Part XII - Ridge Regression, LASSO, and Elastic Nets
Data Science - Part XII - Ridge Regression, LASSO, and Elastic NetsData Science - Part XII - Ridge Regression, LASSO, and Elastic Nets
Data Science - Part XII - Ridge Regression, LASSO, and Elastic Nets
Β 
Modelo Generalizado
Modelo GeneralizadoModelo Generalizado
Modelo Generalizado
Β 
Logistic regression and analysis using statistical information
Logistic regression and analysis using statistical informationLogistic regression and analysis using statistical information
Logistic regression and analysis using statistical information
Β 
Machine learning session4(linear regression)
Machine learning   session4(linear regression)Machine learning   session4(linear regression)
Machine learning session4(linear regression)
Β 
Logistic regression
Logistic regressionLogistic regression
Logistic regression
Β 
M8.logreg.ppt
M8.logreg.pptM8.logreg.ppt
M8.logreg.ppt
Β 
M8.logreg.ppt
M8.logreg.pptM8.logreg.ppt
M8.logreg.ppt
Β 
7. logistics regression using spss
7. logistics regression using spss7. logistics regression using spss
7. logistics regression using spss
Β 
Logistic regression sage
Logistic regression sageLogistic regression sage
Logistic regression sage
Β 
2. diagnostics, collinearity, transformation, and missing data
2. diagnostics, collinearity, transformation, and missing data 2. diagnostics, collinearity, transformation, and missing data
2. diagnostics, collinearity, transformation, and missing data
Β 
Logistic regression with SPSS examples
Logistic regression with SPSS examplesLogistic regression with SPSS examples
Logistic regression with SPSS examples
Β 
Get Multiple Regression Assignment Help
Get Multiple Regression Assignment Help Get Multiple Regression Assignment Help
Get Multiple Regression Assignment Help
Β 
Regression with Time Series Data
Regression with Time Series DataRegression with Time Series Data
Regression with Time Series Data
Β 
Logistical Regression.pptx
Logistical Regression.pptxLogistical Regression.pptx
Logistical Regression.pptx
Β 
Simple Linear Regression.pptx
Simple Linear Regression.pptxSimple Linear Regression.pptx
Simple Linear Regression.pptx
Β 
Talk 4
Talk 4Talk 4
Talk 4
Β 
Simple egression.pptx
Simple egression.pptxSimple egression.pptx
Simple egression.pptx
Β 
Heteroscedasticity Remedial Measures.pptx
Heteroscedasticity Remedial Measures.pptxHeteroscedasticity Remedial Measures.pptx
Heteroscedasticity Remedial Measures.pptx
Β 
Applications of regression analysis - Measurement of validity of relationship
Applications of regression analysis - Measurement of validity of relationshipApplications of regression analysis - Measurement of validity of relationship
Applications of regression analysis - Measurement of validity of relationship
Β 

More from Ayurdata

Statistical distributions
Statistical distributionsStatistical distributions
Statistical distributionsAyurdata
Β 
Health Behaviour: An Ayurveda Perspective
Health Behaviour: An Ayurveda PerspectiveHealth Behaviour: An Ayurveda Perspective
Health Behaviour: An Ayurveda PerspectiveAyurdata
Β 
Ayur data
Ayur data Ayur data
Ayur data Ayurdata
Β 
Stat Methods in ayurveda
Stat Methods in ayurvedaStat Methods in ayurveda
Stat Methods in ayurvedaAyurdata
Β 
Ayurveda colleges and courses
Ayurveda colleges and coursesAyurveda colleges and courses
Ayurveda colleges and coursesAyurdata
Β 
AyurData Ayurveda Webinar
AyurData Ayurveda WebinarAyurData Ayurveda Webinar
AyurData Ayurveda WebinarAyurdata
Β 
Advanced Statistical Manual for Ayurveda Research
Advanced Statistical Manual for Ayurveda ResearchAdvanced Statistical Manual for Ayurveda Research
Advanced Statistical Manual for Ayurveda ResearchAyurdata
Β 
Advanced manual part 4
Advanced manual part 4Advanced manual part 4
Advanced manual part 4Ayurdata
Β 
Investigation modes in ayurveda
Investigation modes in ayurvedaInvestigation modes in ayurveda
Investigation modes in ayurvedaAyurdata
Β 
Advanced Statistical Manual Part III
Advanced Statistical Manual Part IIIAdvanced Statistical Manual Part III
Advanced Statistical Manual Part IIIAyurdata
Β 
Advanced statistical manual part ii
Advanced statistical manual part iiAdvanced statistical manual part ii
Advanced statistical manual part iiAyurdata
Β 
Advanced statistical manual part i
Advanced statistical manual part iAdvanced statistical manual part i
Advanced statistical manual part iAyurdata
Β 
Advanced statistical manual for ayurveda research sample
Advanced statistical manual for ayurveda research sampleAdvanced statistical manual for ayurveda research sample
Advanced statistical manual for ayurveda research sampleAyurdata
Β 
Ayurveda vs allopathy
Ayurveda vs allopathyAyurveda vs allopathy
Ayurveda vs allopathyAyurdata
Β 
Meta-Analysis in Ayurveda
Meta-Analysis in AyurvedaMeta-Analysis in Ayurveda
Meta-Analysis in AyurvedaAyurdata
Β 
A manual on statistical analysis in ayurveda research
A manual on statistical analysis in ayurveda researchA manual on statistical analysis in ayurveda research
A manual on statistical analysis in ayurveda researchAyurdata
Β 
Ich sample size
Ich sample sizeIch sample size
Ich sample sizeAyurdata
Β 
Classifiers
ClassifiersClassifiers
ClassifiersAyurdata
Β 
Ayur data startup
Ayur data startupAyur data startup
Ayur data startupAyurdata
Β 

More from Ayurdata (20)

Statistical distributions
Statistical distributionsStatistical distributions
Statistical distributions
Β 
BMI
BMIBMI
BMI
Β 
Health Behaviour: An Ayurveda Perspective
Health Behaviour: An Ayurveda PerspectiveHealth Behaviour: An Ayurveda Perspective
Health Behaviour: An Ayurveda Perspective
Β 
Ayur data
Ayur data Ayur data
Ayur data
Β 
Stat Methods in ayurveda
Stat Methods in ayurvedaStat Methods in ayurveda
Stat Methods in ayurveda
Β 
Ayurveda colleges and courses
Ayurveda colleges and coursesAyurveda colleges and courses
Ayurveda colleges and courses
Β 
AyurData Ayurveda Webinar
AyurData Ayurveda WebinarAyurData Ayurveda Webinar
AyurData Ayurveda Webinar
Β 
Advanced Statistical Manual for Ayurveda Research
Advanced Statistical Manual for Ayurveda ResearchAdvanced Statistical Manual for Ayurveda Research
Advanced Statistical Manual for Ayurveda Research
Β 
Advanced manual part 4
Advanced manual part 4Advanced manual part 4
Advanced manual part 4
Β 
Investigation modes in ayurveda
Investigation modes in ayurvedaInvestigation modes in ayurveda
Investigation modes in ayurveda
Β 
Advanced Statistical Manual Part III
Advanced Statistical Manual Part IIIAdvanced Statistical Manual Part III
Advanced Statistical Manual Part III
Β 
Advanced statistical manual part ii
Advanced statistical manual part iiAdvanced statistical manual part ii
Advanced statistical manual part ii
Β 
Advanced statistical manual part i
Advanced statistical manual part iAdvanced statistical manual part i
Advanced statistical manual part i
Β 
Advanced statistical manual for ayurveda research sample
Advanced statistical manual for ayurveda research sampleAdvanced statistical manual for ayurveda research sample
Advanced statistical manual for ayurveda research sample
Β 
Ayurveda vs allopathy
Ayurveda vs allopathyAyurveda vs allopathy
Ayurveda vs allopathy
Β 
Meta-Analysis in Ayurveda
Meta-Analysis in AyurvedaMeta-Analysis in Ayurveda
Meta-Analysis in Ayurveda
Β 
A manual on statistical analysis in ayurveda research
A manual on statistical analysis in ayurveda researchA manual on statistical analysis in ayurveda research
A manual on statistical analysis in ayurveda research
Β 
Ich sample size
Ich sample sizeIch sample size
Ich sample size
Β 
Classifiers
ClassifiersClassifiers
Classifiers
Β 
Ayur data startup
Ayur data startupAyur data startup
Ayur data startup
Β 

Recently uploaded

꧁❀ Greater Noida Call Girls Delhi ❀꧂ 9711199171 ☎️ Hard And Sexy Vip Call
꧁❀ Greater Noida Call Girls Delhi ❀꧂ 9711199171 ☎️ Hard And Sexy Vip Call꧁❀ Greater Noida Call Girls Delhi ❀꧂ 9711199171 ☎️ Hard And Sexy Vip Call
꧁❀ Greater Noida Call Girls Delhi ❀꧂ 9711199171 ☎️ Hard And Sexy Vip Callshivangimorya083
Β 
20240419 - Measurecamp Amsterdam - SAM.pdf
20240419 - Measurecamp Amsterdam - SAM.pdf20240419 - Measurecamp Amsterdam - SAM.pdf
20240419 - Measurecamp Amsterdam - SAM.pdfHuman37
Β 
Unveiling Insights: The Role of a Data Analyst
Unveiling Insights: The Role of a Data AnalystUnveiling Insights: The Role of a Data Analyst
Unveiling Insights: The Role of a Data AnalystSamantha Rae Coolbeth
Β 
PKS-TGC-1084-630 - Stage 1 Proposal.pptx
PKS-TGC-1084-630 - Stage 1 Proposal.pptxPKS-TGC-1084-630 - Stage 1 Proposal.pptx
PKS-TGC-1084-630 - Stage 1 Proposal.pptxPramod Kumar Srivastava
Β 
Market Analysis in the 5 Largest Economic Countries in Southeast Asia.pdf
Market Analysis in the 5 Largest Economic Countries in Southeast Asia.pdfMarket Analysis in the 5 Largest Economic Countries in Southeast Asia.pdf
Market Analysis in the 5 Largest Economic Countries in Southeast Asia.pdfRachmat Ramadhan H
Β 
VIP High Class Call Girls Bikaner Anushka 8250192130 Independent Escort Servi...
VIP High Class Call Girls Bikaner Anushka 8250192130 Independent Escort Servi...VIP High Class Call Girls Bikaner Anushka 8250192130 Independent Escort Servi...
VIP High Class Call Girls Bikaner Anushka 8250192130 Independent Escort Servi...Suhani Kapoor
Β 
Low Rate Call Girls Bhilai Anika 8250192130 Independent Escort Service Bhilai
Low Rate Call Girls Bhilai Anika 8250192130 Independent Escort Service BhilaiLow Rate Call Girls Bhilai Anika 8250192130 Independent Escort Service Bhilai
Low Rate Call Girls Bhilai Anika 8250192130 Independent Escort Service BhilaiSuhani Kapoor
Β 
High Class Call Girls Noida Sector 39 Aarushi πŸ”8264348440πŸ” Independent Escort...
High Class Call Girls Noida Sector 39 Aarushi πŸ”8264348440πŸ” Independent Escort...High Class Call Girls Noida Sector 39 Aarushi πŸ”8264348440πŸ” Independent Escort...
High Class Call Girls Noida Sector 39 Aarushi πŸ”8264348440πŸ” Independent Escort...soniya singh
Β 
Ukraine War presentation: KNOW THE BASICS
Ukraine War presentation: KNOW THE BASICSUkraine War presentation: KNOW THE BASICS
Ukraine War presentation: KNOW THE BASICSAishani27
Β 
Full night πŸ₯΅ Call Girls Delhi New Friends Colony {9711199171} Sanya Reddy ✌️o...
Full night πŸ₯΅ Call Girls Delhi New Friends Colony {9711199171} Sanya Reddy ✌️o...Full night πŸ₯΅ Call Girls Delhi New Friends Colony {9711199171} Sanya Reddy ✌️o...
Full night πŸ₯΅ Call Girls Delhi New Friends Colony {9711199171} Sanya Reddy ✌️o...shivangimorya083
Β 
VIP High Profile Call Girls Amravati Aarushi 8250192130 Independent Escort Se...
VIP High Profile Call Girls Amravati Aarushi 8250192130 Independent Escort Se...VIP High Profile Call Girls Amravati Aarushi 8250192130 Independent Escort Se...
VIP High Profile Call Girls Amravati Aarushi 8250192130 Independent Escort Se...Suhani Kapoor
Β 
Data Warehouse , Data Cube Computation
Data Warehouse   , Data Cube ComputationData Warehouse   , Data Cube Computation
Data Warehouse , Data Cube Computationsit20ad004
Β 
Call Girls in Defence Colony Delhi πŸ’―Call Us πŸ”8264348440πŸ”
Call Girls in Defence Colony Delhi πŸ’―Call Us πŸ”8264348440πŸ”Call Girls in Defence Colony Delhi πŸ’―Call Us πŸ”8264348440πŸ”
Call Girls in Defence Colony Delhi πŸ’―Call Us πŸ”8264348440πŸ”soniya singh
Β 
04242024_CCC TUG_Joins and Relationships
04242024_CCC TUG_Joins and Relationships04242024_CCC TUG_Joins and Relationships
04242024_CCC TUG_Joins and Relationshipsccctableauusergroup
Β 
Dubai Call Girls Wifey O52&786472 Call Girls Dubai
Dubai Call Girls Wifey O52&786472 Call Girls DubaiDubai Call Girls Wifey O52&786472 Call Girls Dubai
Dubai Call Girls Wifey O52&786472 Call Girls Dubaihf8803863
Β 
Call Girls In Mahipalpur O9654467111 Escorts Service
Call Girls In Mahipalpur O9654467111  Escorts ServiceCall Girls In Mahipalpur O9654467111  Escorts Service
Call Girls In Mahipalpur O9654467111 Escorts ServiceSapana Sha
Β 
VIP Call Girls Service Miyapur Hyderabad Call +91-8250192130
VIP Call Girls Service Miyapur Hyderabad Call +91-8250192130VIP Call Girls Service Miyapur Hyderabad Call +91-8250192130
VIP Call Girls Service Miyapur Hyderabad Call +91-8250192130Suhani Kapoor
Β 

Recently uploaded (20)

꧁❀ Greater Noida Call Girls Delhi ❀꧂ 9711199171 ☎️ Hard And Sexy Vip Call
꧁❀ Greater Noida Call Girls Delhi ❀꧂ 9711199171 ☎️ Hard And Sexy Vip Call꧁❀ Greater Noida Call Girls Delhi ❀꧂ 9711199171 ☎️ Hard And Sexy Vip Call
꧁❀ Greater Noida Call Girls Delhi ❀꧂ 9711199171 ☎️ Hard And Sexy Vip Call
Β 
VIP Call Girls Service Charbagh { Lucknow Call Girls Service 9548273370 } Boo...
VIP Call Girls Service Charbagh { Lucknow Call Girls Service 9548273370 } Boo...VIP Call Girls Service Charbagh { Lucknow Call Girls Service 9548273370 } Boo...
VIP Call Girls Service Charbagh { Lucknow Call Girls Service 9548273370 } Boo...
Β 
20240419 - Measurecamp Amsterdam - SAM.pdf
20240419 - Measurecamp Amsterdam - SAM.pdf20240419 - Measurecamp Amsterdam - SAM.pdf
20240419 - Measurecamp Amsterdam - SAM.pdf
Β 
Unveiling Insights: The Role of a Data Analyst
Unveiling Insights: The Role of a Data AnalystUnveiling Insights: The Role of a Data Analyst
Unveiling Insights: The Role of a Data Analyst
Β 
PKS-TGC-1084-630 - Stage 1 Proposal.pptx
PKS-TGC-1084-630 - Stage 1 Proposal.pptxPKS-TGC-1084-630 - Stage 1 Proposal.pptx
PKS-TGC-1084-630 - Stage 1 Proposal.pptx
Β 
Market Analysis in the 5 Largest Economic Countries in Southeast Asia.pdf
Market Analysis in the 5 Largest Economic Countries in Southeast Asia.pdfMarket Analysis in the 5 Largest Economic Countries in Southeast Asia.pdf
Market Analysis in the 5 Largest Economic Countries in Southeast Asia.pdf
Β 
VIP High Class Call Girls Bikaner Anushka 8250192130 Independent Escort Servi...
VIP High Class Call Girls Bikaner Anushka 8250192130 Independent Escort Servi...VIP High Class Call Girls Bikaner Anushka 8250192130 Independent Escort Servi...
VIP High Class Call Girls Bikaner Anushka 8250192130 Independent Escort Servi...
Β 
Low Rate Call Girls Bhilai Anika 8250192130 Independent Escort Service Bhilai
Low Rate Call Girls Bhilai Anika 8250192130 Independent Escort Service BhilaiLow Rate Call Girls Bhilai Anika 8250192130 Independent Escort Service Bhilai
Low Rate Call Girls Bhilai Anika 8250192130 Independent Escort Service Bhilai
Β 
High Class Call Girls Noida Sector 39 Aarushi πŸ”8264348440πŸ” Independent Escort...
High Class Call Girls Noida Sector 39 Aarushi πŸ”8264348440πŸ” Independent Escort...High Class Call Girls Noida Sector 39 Aarushi πŸ”8264348440πŸ” Independent Escort...
High Class Call Girls Noida Sector 39 Aarushi πŸ”8264348440πŸ” Independent Escort...
Β 
E-Commerce Order PredictionShraddha Kamble.pptx
E-Commerce Order PredictionShraddha Kamble.pptxE-Commerce Order PredictionShraddha Kamble.pptx
E-Commerce Order PredictionShraddha Kamble.pptx
Β 
Ukraine War presentation: KNOW THE BASICS
Ukraine War presentation: KNOW THE BASICSUkraine War presentation: KNOW THE BASICS
Ukraine War presentation: KNOW THE BASICS
Β 
Full night πŸ₯΅ Call Girls Delhi New Friends Colony {9711199171} Sanya Reddy ✌️o...
Full night πŸ₯΅ Call Girls Delhi New Friends Colony {9711199171} Sanya Reddy ✌️o...Full night πŸ₯΅ Call Girls Delhi New Friends Colony {9711199171} Sanya Reddy ✌️o...
Full night πŸ₯΅ Call Girls Delhi New Friends Colony {9711199171} Sanya Reddy ✌️o...
Β 
VIP High Profile Call Girls Amravati Aarushi 8250192130 Independent Escort Se...
VIP High Profile Call Girls Amravati Aarushi 8250192130 Independent Escort Se...VIP High Profile Call Girls Amravati Aarushi 8250192130 Independent Escort Se...
VIP High Profile Call Girls Amravati Aarushi 8250192130 Independent Escort Se...
Β 
Data Warehouse , Data Cube Computation
Data Warehouse   , Data Cube ComputationData Warehouse   , Data Cube Computation
Data Warehouse , Data Cube Computation
Β 
Call Girls in Defence Colony Delhi πŸ’―Call Us πŸ”8264348440πŸ”
Call Girls in Defence Colony Delhi πŸ’―Call Us πŸ”8264348440πŸ”Call Girls in Defence Colony Delhi πŸ’―Call Us πŸ”8264348440πŸ”
Call Girls in Defence Colony Delhi πŸ’―Call Us πŸ”8264348440πŸ”
Β 
04242024_CCC TUG_Joins and Relationships
04242024_CCC TUG_Joins and Relationships04242024_CCC TUG_Joins and Relationships
04242024_CCC TUG_Joins and Relationships
Β 
Dubai Call Girls Wifey O52&786472 Call Girls Dubai
Dubai Call Girls Wifey O52&786472 Call Girls DubaiDubai Call Girls Wifey O52&786472 Call Girls Dubai
Dubai Call Girls Wifey O52&786472 Call Girls Dubai
Β 
꧁❀ Aerocity Call Girls Service Aerocity Delhi ❀꧂ 9999965857 ☎️ Hard And Sexy ...
꧁❀ Aerocity Call Girls Service Aerocity Delhi ❀꧂ 9999965857 ☎️ Hard And Sexy ...꧁❀ Aerocity Call Girls Service Aerocity Delhi ❀꧂ 9999965857 ☎️ Hard And Sexy ...
꧁❀ Aerocity Call Girls Service Aerocity Delhi ❀꧂ 9999965857 ☎️ Hard And Sexy ...
Β 
Call Girls In Mahipalpur O9654467111 Escorts Service
Call Girls In Mahipalpur O9654467111  Escorts ServiceCall Girls In Mahipalpur O9654467111  Escorts Service
Call Girls In Mahipalpur O9654467111 Escorts Service
Β 
VIP Call Girls Service Miyapur Hyderabad Call +91-8250192130
VIP Call Girls Service Miyapur Hyderabad Call +91-8250192130VIP Call Girls Service Miyapur Hyderabad Call +91-8250192130
VIP Call Girls Service Miyapur Hyderabad Call +91-8250192130
Β 

Logistic Regression Model Fitting & Assessment

  • 1. Logistic Regression Logistic model (or logit model) is used to model the probability of events realized in two classes such as alive/dead or healthy/sick etc. This can be extended to model several classes of events such as determining whether an image contains a cat, dog, lion, etc. Each object being detected in the image would be assigned a probability between 0 and 1, the sum adding to one. Consider a logistic model with two predictors x1 and x2, and one binary response variable y which we denote as 𝑝 = 𝑃(π‘Œ = 1). We assume a linear relationship between the predictor variables and the log-odds of the event. This relationship can be expressed as, log 𝑝 1 βˆ’ 𝑝 = Ξ² + Ξ² π‘₯ + Ξ² π‘₯ We can recover the odds by exponentiating the log-odds. 𝑝 1 βˆ’ 𝑝 = 𝑏 By simple algebraic manipulation, the probability that Y=1 is, 𝑝 = 𝑏 𝑏 + 1 = 1 1 + 𝑏 ( ) The above formula shows that once the Ξ² are fixed, we can compute either the log-odds that Y=1, or the probability that Y=1 for a given observation. The main use-case of a logistic model is, given an observation (x1, x2), an estimate of the probability that Y=1 can be obtained. In most applications, the base b of the logarithm is usually to be e. However, in some cases, it can be easier to communicate the results by working in base 2 or base 10. The above bivariate case can easily be extended to multilinear model, log 𝑝 1 βˆ’ 𝑝 = Ξ² + Ξ² π‘₯ + Ξ² π‘₯ + β‹― + Ξ² π‘₯ Model fitting The regression coefficients in logistic regression model are usually estimated using maximum likelihood estimation. Unlike linear regression with normally distributed residuals, it is not possible to find a closed-form expression for the coefficient values that maximize the likelihood function, so that an iterative process must be used instead; for example Newton's method. This process begins with a tentative solution, revises it slightly to see if it can be improved, and repeats this revision until no more improvement is made, at which point the process is said to have converged. In some instances, the model may not reach convergence. Non-convergence of a model indicates that the coefficients are not meaningful because the iterative process was unable to find appropriate solutions. A failure to converge may occur for a number of reasons like having a large ratio of predictor to case, multicollinearity, sparseness, or complete separation. Goodness of fit in linear regression models is generally measured using R2 . Since this has no direct analogue in logistic regression, alternative measures like deviance and likelihood ratio tests are used. Deviance is analogous to the sum of squares calculations in linear regression and is a measure of the lack of fit to the data in a logistic regression model. When a "saturated" model is available (a model with a theoretically perfect fit), deviance is calculated by comparing a given model with the saturated model. This computation gives the likelihood-ratio test.
  • 2. 𝐷 = βˆ’2ln In the above equation, D represents the deviance and ln represents the natural logarithm. The log of this likelihood ratio (the ratio of the fitted model to the saturated model) will produce a negative value, hence the need for a negative sign. D can be shown to follow an approximate chi-squared distribution. Smaller values indicate better fit as the fitted model deviates less from the saturated model. When assessed upon a chi-square distribution, nonsignificant chi-square values indicate very little unexplained variance and thus, good model fit. Conversely, a significant chi-square value indicates that a significant amount of the variance is unexplained. Assessing the predictive ability of the model One straightforward method to assess the predictivity is to compute the confusion matrix and evaluate the accuracy. One can also resort to k-fold cross validation. As a last step, one may also see the ROC (receiver operating characteristic) curve and calculate the AUC (area under the curve) which are typical performance measurements for a binary classifier. The ROC is a curve generated by plotting the true positive rate (TPR) against the false positive rate (FPR) at various threshold settings while the AUC is the area under the ROC curve. As a rule of thumb, a model with good predictive ability should have an AUC closer to 1 (1 is ideal) than to 0.5.