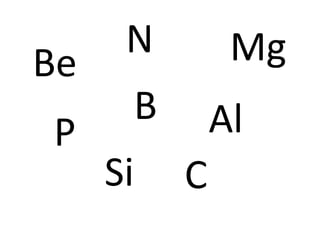
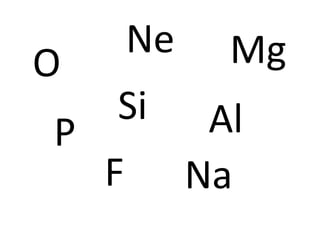
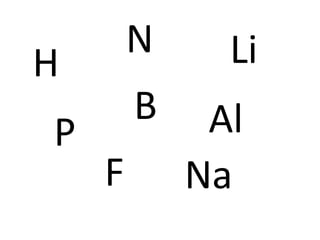
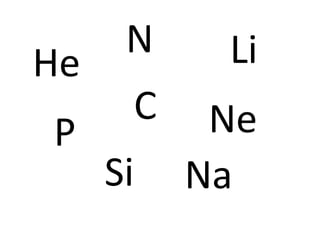
The document contains multiple repetitions of chemical element arrangements in rows and columns. Each repetition shows different elements grouped together including N, Li, H, B, Al, P, F, Na, He, C, Ne, Si, Mg, Be.
This document provides an overview of asteroids, including their sizes, where they are located, and where they come from. It discusses how asteroids are studied and examples of asteroid missions. The document addresses why asteroids are of interest and the different levels of impact threats they pose to Earth, from small localized impacts to large civilization-ending impacts. It provides statistics on impact frequencies and examples of impact effects. Finally, it discusses strategies that can be used to detect, deflect, or destroy asteroids to mitigate impact risks.
The document discusses asteroids, comets, and Pluto. It explains that asteroids formed from leftover material from planet formation and are found mainly in the asteroid belt between Mars and Jupiter due to Jupiter's gravitational influence. Comets formed beyond the frost line and have icy compositions; their tails form when they near the Sun and ice sublimates. Most comets originate from the Kuiper Belt and Oort Cloud. Pluto has properties matching Kuiper Belt objects. An impact likely caused the mass extinction that killed the dinosaurs. While impacts pose a real threat, the likelihood of a major impact within our lifetimes is low. Other planets can affect Earth's impact rates through their gravitational influence on small solar system bodies.
This document provides classroom demonstrations and activities for teaching about seismic waves. It includes animations of the four main types of seismic waves: P waves (compressional waves), S waves (shear waves), Rayleigh waves, and Love waves. The animations show the particle motion and propagation of each wave type. It also suggests having students simulate the different wave types by moving their bodies in specific ways while walking forward, to help understand how each wave deforms the Earth. Links are provided to download or view the animations separately.
This document provides guidance on writing a scientific paper. It explains that a scientific paper has a standardized format (Introduction, Methods, Results, Discussion) to communicate research findings logically and unambiguously. The introduction defines the research problem and objectives. The methods section describes the materials and procedures used so others can replicate the study. The results section presents the experimental observations and data without interpreting them.
This document provides a rubric for evaluating student research papers. It evaluates papers across several dimensions, including research title, introduction (background, literature review, significance), research framework, research problem, definition of terms, methods (research design, data gathering, analysis), results and discussion, conclusion and recommendations, citations and references, and grammar/composition. Each dimension contains 3-6 criteria for excellent performance and provides a rating scale from excellent to needs improvement. The rubric aims to make evaluations objective and provide useful feedback to students.
This document describes 11 statistical tests, including their use/function, level of measurement, type of data, and sample problems. The tests covered are: Pearson R, Spearman Rank Order, One Population Z-Test, Z-Test of Independent Proportions, Z-test of Dependent Proportions, T-Test of Independent Means, T-Test of Dependent Means, Chi-Square Test of Goodness of Fit, Chi-Square Test of Independent Proportions, One-Way Analysis of Variance (ANOVA I), and Two-Way Analysis of Variance (ANOVA II). Each test is used to analyze different types of data and answer different statistical questions.
This document provides information about measures of variation, including range, median, quartiles, and interquartile range. It defines these terms and shows examples of calculating them for various data sets. The examples include finding the measures of variation for data on water consumption, speeds, golf courses, internet users, exercise times, moons of planets, and more. Students are provided practice problems to calculate these measures of variation for additional data sets.
The document discusses various measures of central tendency, dispersion, and shape used to describe data numerically. It defines terms like mean, median, mode, variance, standard deviation, coefficient of variation, range, interquartile range, skewness, and quartiles. It provides formulas and examples of how to calculate these measures from data sets. The document also discusses concepts like normal distribution, empirical rule, and how measures of central tendency and dispersion do not provide information about the shape or symmetry of a distribution.
This document provides guidance on writing the materials and methods section of a research study. It discusses including a list of all materials used, such as live organisms, reagents, chemicals, and experimental units. The materials and methods section should specify these materials in sufficient detail and describe the procedures to allow others to evaluate and replicate the study. It is important to control for experimental error by using proper research design, replication, and statistical analysis to reduce or eliminate errors from instruments, limited samples or trials, and lack of controls. The materials and methods section should be written in an expository style using future tense for proposed studies and past tense for technical reports, without personal pronouns, spelling out numbers if they start sentences, and including diagrams to
Statistical tests can be used to analyze data in two main ways: descriptive statistics provide an overview of data attributes, while inferential statistics assess how well data support hypotheses and generalizability. There are parametric tests that assume normal distributions and continuous scales, and non-parametric tests for other distributions or scales. Key questions are whether tests examine relatedness between variables or differences between samples/populations. Tests for differences include comparing means (t-tests for two samples, ANOVA for more), distributions (chi-square tests), or variances (F-tests) between parametric or non-parametric data.
This document discusses descriptive and inferential statistics. Descriptive statistics summarize and organize data through frequency distributions, graphs, and summary statistics like the mean, median, mode, variance, and standard deviation. Inferential statistics allow generalization from samples to populations through hypothesis testing, where the null hypothesis is tested against the alternative hypothesis. Type I and type II errors are possible, and significance tests control the probability of type I errors through the alpha level while power analysis aims to reduce type II errors. Common inferential tests mentioned include t-tests, ANOVA, and meta-analysis.
This document discusses the difference between descriptive and inferential statistics. Descriptive statistics describe the characteristics of a whole population, using data from every member. Inferential statistics draw conclusions about a population based on a sample of data, allowing generalization to populations that are too large to measure entirely. Word problems involving descriptive statistics will refer to all or the entire group as the population, while inferential problems refer to samples that allow inferences about a broader population.
There are three common measures of central tendency: mean, median, and mode. The mean is the average value found by dividing the sum of all values by the total number of values. The median is the middle value when values are arranged from lowest to highest. The mode is the value that occurs most frequently. Each measure provides a single number to represent the central or typical value in a data set.
This document discusses measures of central tendency, which convey the most information about distributions. The three main measures are the mode, median, and mean. The mode is the most frequently occurring value. The median is the midpoint value when data are ordered from smallest to largest. The mean is the average value. Which measure is most appropriate depends on the level of measurement and intent of the communication. The mode is suitable for any level, while the median and mean are best for interval/ratio data. These measures may differ depending on the shape of the distribution.
This document discusses different types of graphs and charts, their uses, and provides examples. It summarizes 6 common types: line graphs show trends over time; bar charts compare categorical data with bars; pie charts illustrate proportional data with slices; histograms show distributions of continuous data with columns; scatter plots show relationships between two variables with x-y axes; and Venn charts visualize logical relationships between groups with overlapping circles. The document provides examples and descriptions of when each type would be useful.
This document discusses the four levels of measurement for data: nominal, ordinal, interval, and ratio. Nominal data involves qualitative categories without order. Ordinal data involves ordered categories but without measurable differences. Interval data involves ordered categories with measurable differences but no defined zero point. Ratio data involves ordered categories with measurable differences and a defined zero point, allowing calculations of ratios. Examples are provided for each level of measurement.
This document provides instructions for using a Gantt chart spreadsheet template for project management. The template allows users to input task details like name, start date, duration and progress. It then generates a 12-month Gantt chart to track the project schedule automatically. The template can be customized by defining weekends and holidays, and extended to support more tasks or a longer schedule period beyond 12 months.
The document discusses the Gantt chart, a project management tool used to illustrate the relationship between project activities and time. It provides examples of how to create a basic Gantt chart, including determining project start/end dates, listing activities with durations and dependencies, and populating the chart using forward or backward scheduling. The Gantt chart is useful for planning but has limitations like being difficult to update and not considering costs/resources. Alternatives like PERT and GERT are also discussed.
A Gantt chart is a horizontal bar chart developed in 1917 by Henry Gantt to help plan, coordinate, and track tasks in a project. It uses a horizontal axis for the timeline and a vertical axis for tasks. Bars of varying lengths represent the timing and duration of each task. Gantt charts provide a graphical illustration of a project schedule but do not show task dependencies. More complex automated versions created in software can store additional task details and notes to offer more flexibility in tracking project status over time.
This document reports on three experiments: 1) The effect of different percentages of fish meal as supplemental feed on mudcrab yield, with 10% fish meal yielding the highest results. 2) The growth rate of cultivating eucheuma using broadcasting and lantay methods, with lantay yielding higher results. 3) The effects of traditional vs modern teaching methods on pre-test and post-test scores, with the modern method yielding higher post-test scores.
The document discusses different types of research designs including historical, descriptive, experimental, and case study designs. It provides definitions and explanations of each design. Historical design focuses on examining past events. Descriptive design describes present conditions, situations, or phenomena. Experimental design tests the effects of manipulating variables through controlled experiments. Case study design involves an in-depth analysis of an individual, group, or situation over time. The document also discusses key aspects of each design such as methods, procedures, advantages, limitations, and examples.
This document discusses variables and identifying them. It begins by eliciting what is common in pictures and exploring variables in a given topic. Students are then split into groups to research 5 different studies and identify the variables within for 15 minutes. After presenting their findings, the document elaborates on variables and extends the discussion to variables in real life.
This document outlines different ways to classify research according to various features. It discusses 8 classifications: by purpose, goal, level of investigation, type of analysis, scope, choice of answers to problems, statistical content, and time element. Within each classification there are typically 2-3 types or approaches of research described through brief definitions and examples. The overall purpose is to provide an overview of how research can be categorized based on distinctive aspects.
This document discusses several key ethical issues in research including authorship, plagiarism, peer review, conflicts of interest, and research with human subjects. It provides definitions and guidelines for each topic. For authorship, all authors must significantly contribute to the research and writing. For plagiarism, ideas and words from others must be properly cited. Peer review ensures research quality and ethics. Conflicts of interest can arise from financial interests that compromise research objectivity. Research with human subjects must protect participant welfare.
This document outlines the course outline for Basic Science Research I, a grade 7 subject that equips students with research skills. Over four quarters, topics covered include the scientific research process, identifying variables, designing experiments, collecting and analyzing data, testing hypotheses, and communicating findings. Students will practice skills like selecting research topics, formulating hypotheses, conducting experiments, and presenting their work. The goal is for students to complete a simple science investigatory project to demonstrate their research abilities.
The document discusses the background and definition of research ethics. It defines ethics as norms for conduct that distinguish acceptable from unacceptable behavior. Research ethics refers to rules that define proper conduct for researchers and are aimed at protecting human subjects. The history of modern research ethics is traced back to unethical medical experiments conducted by Nazi doctors during World War 2, which led to the Nuremberg Code establishing ethical principles for research involving human subjects. Other influential documents discussed include the Helsinki Declaration, Belmont Report, and controversies like the Tuskegee Syphilis Study.
The document provides guidance for writing a reflection on a film showing by answering 5 questions. Students are instructed to take notes during the film, write their reflection on one sheet of paper, and answer questions about the film's plot, issues raised, historical accuracy, interesting facts or ideas brought to mind, a particular object/image's significance, strongest emotion felt, strengths and weaknesses, anything not understood, what was learned, and the film's message and whether the student agrees.
This document discusses the characteristics of good research and researchers. It provides 7 key characteristics of research: empirical, logical, cyclical, analytical, critical, methodical, and replicability. It also lists 5 qualities of a good researcher: intellectual curiosity, prudence, healthy criticism, intellectual honesty, and intellectual creativity. The document emphasizes that good research is based on direct experience, uses valid procedures, starts and ends with a problem, uses proven analytical methods, involves careful judgment, follows systematic methods, and can be replicated. Good researchers are curious, careful, open to criticism, honest, and creative in their work.