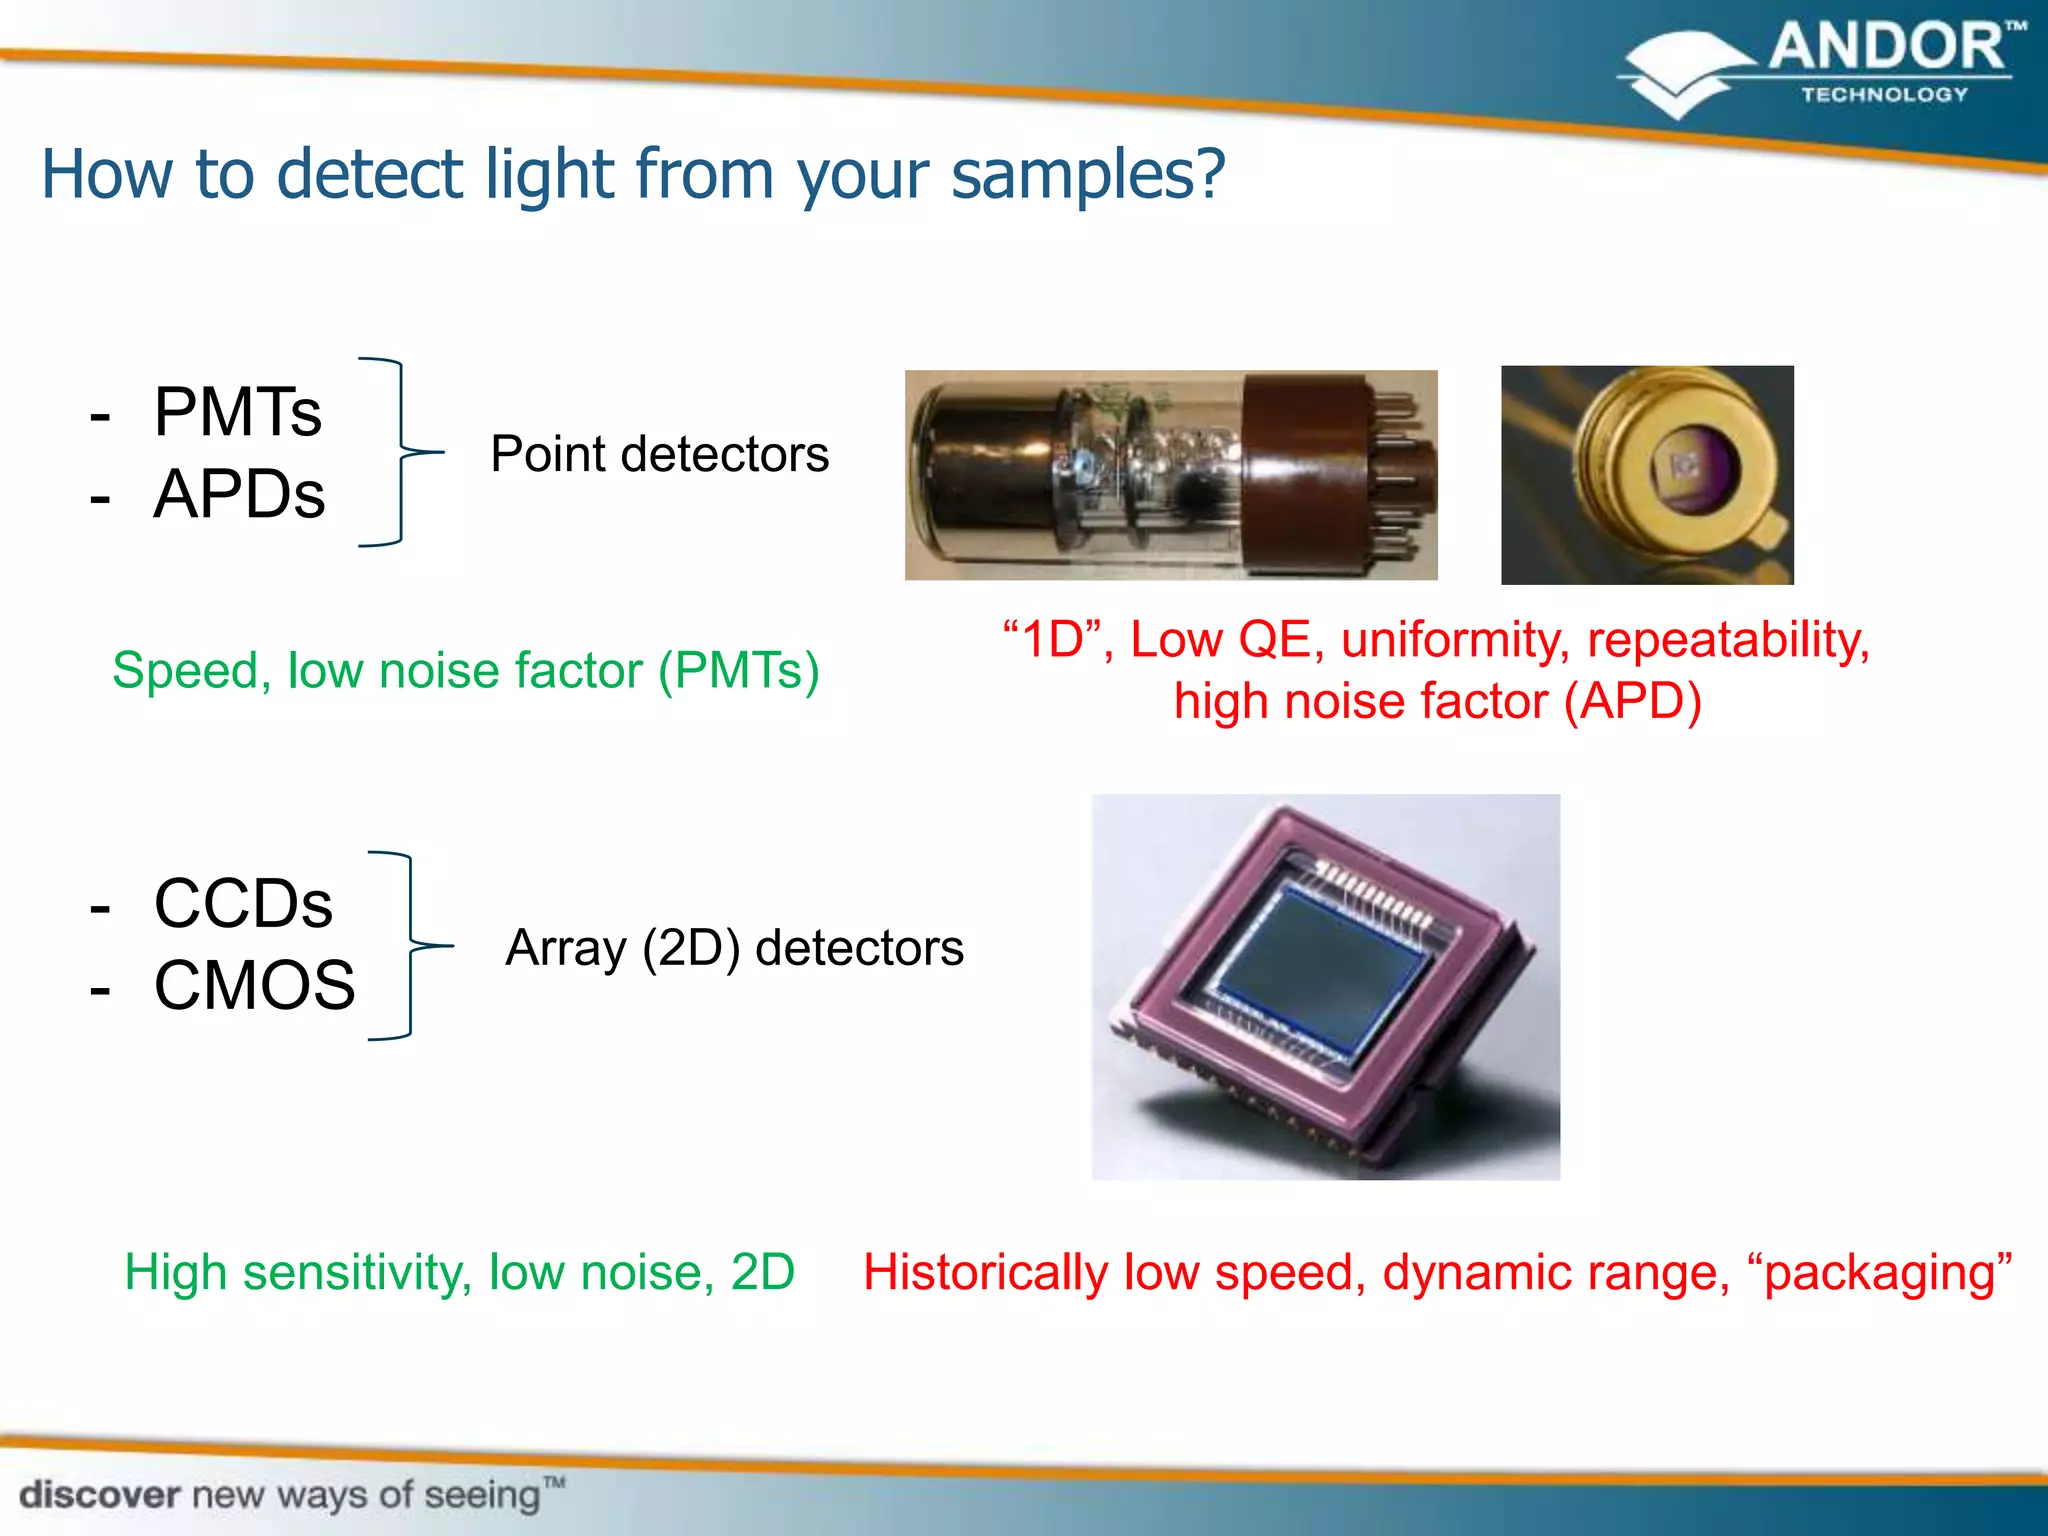
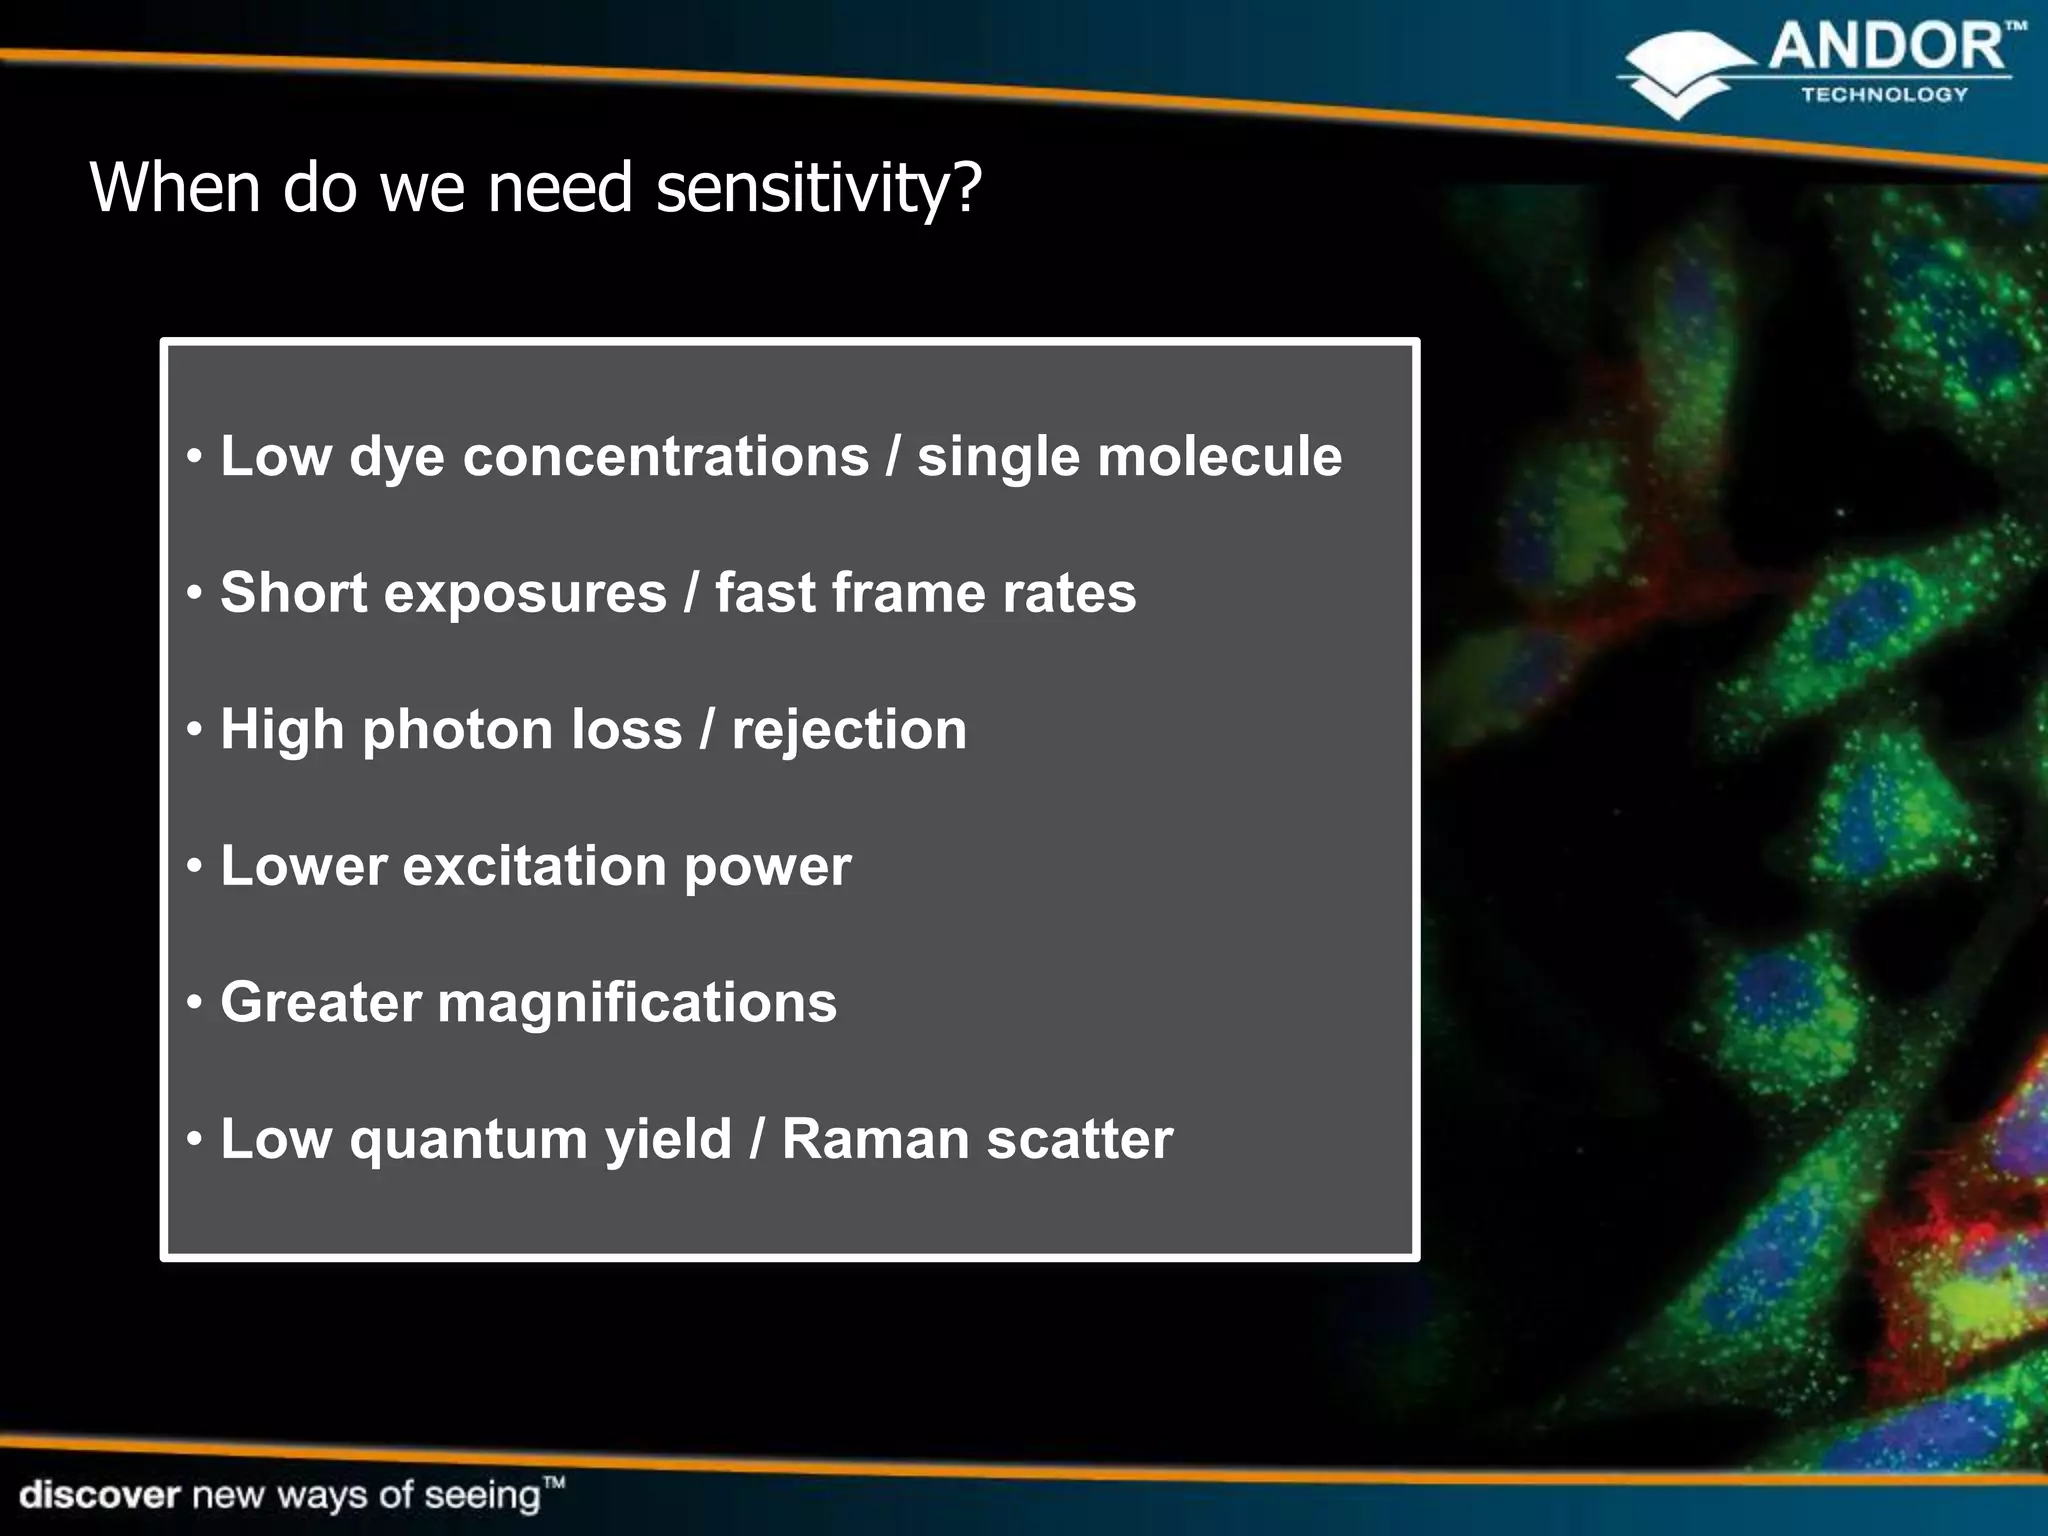
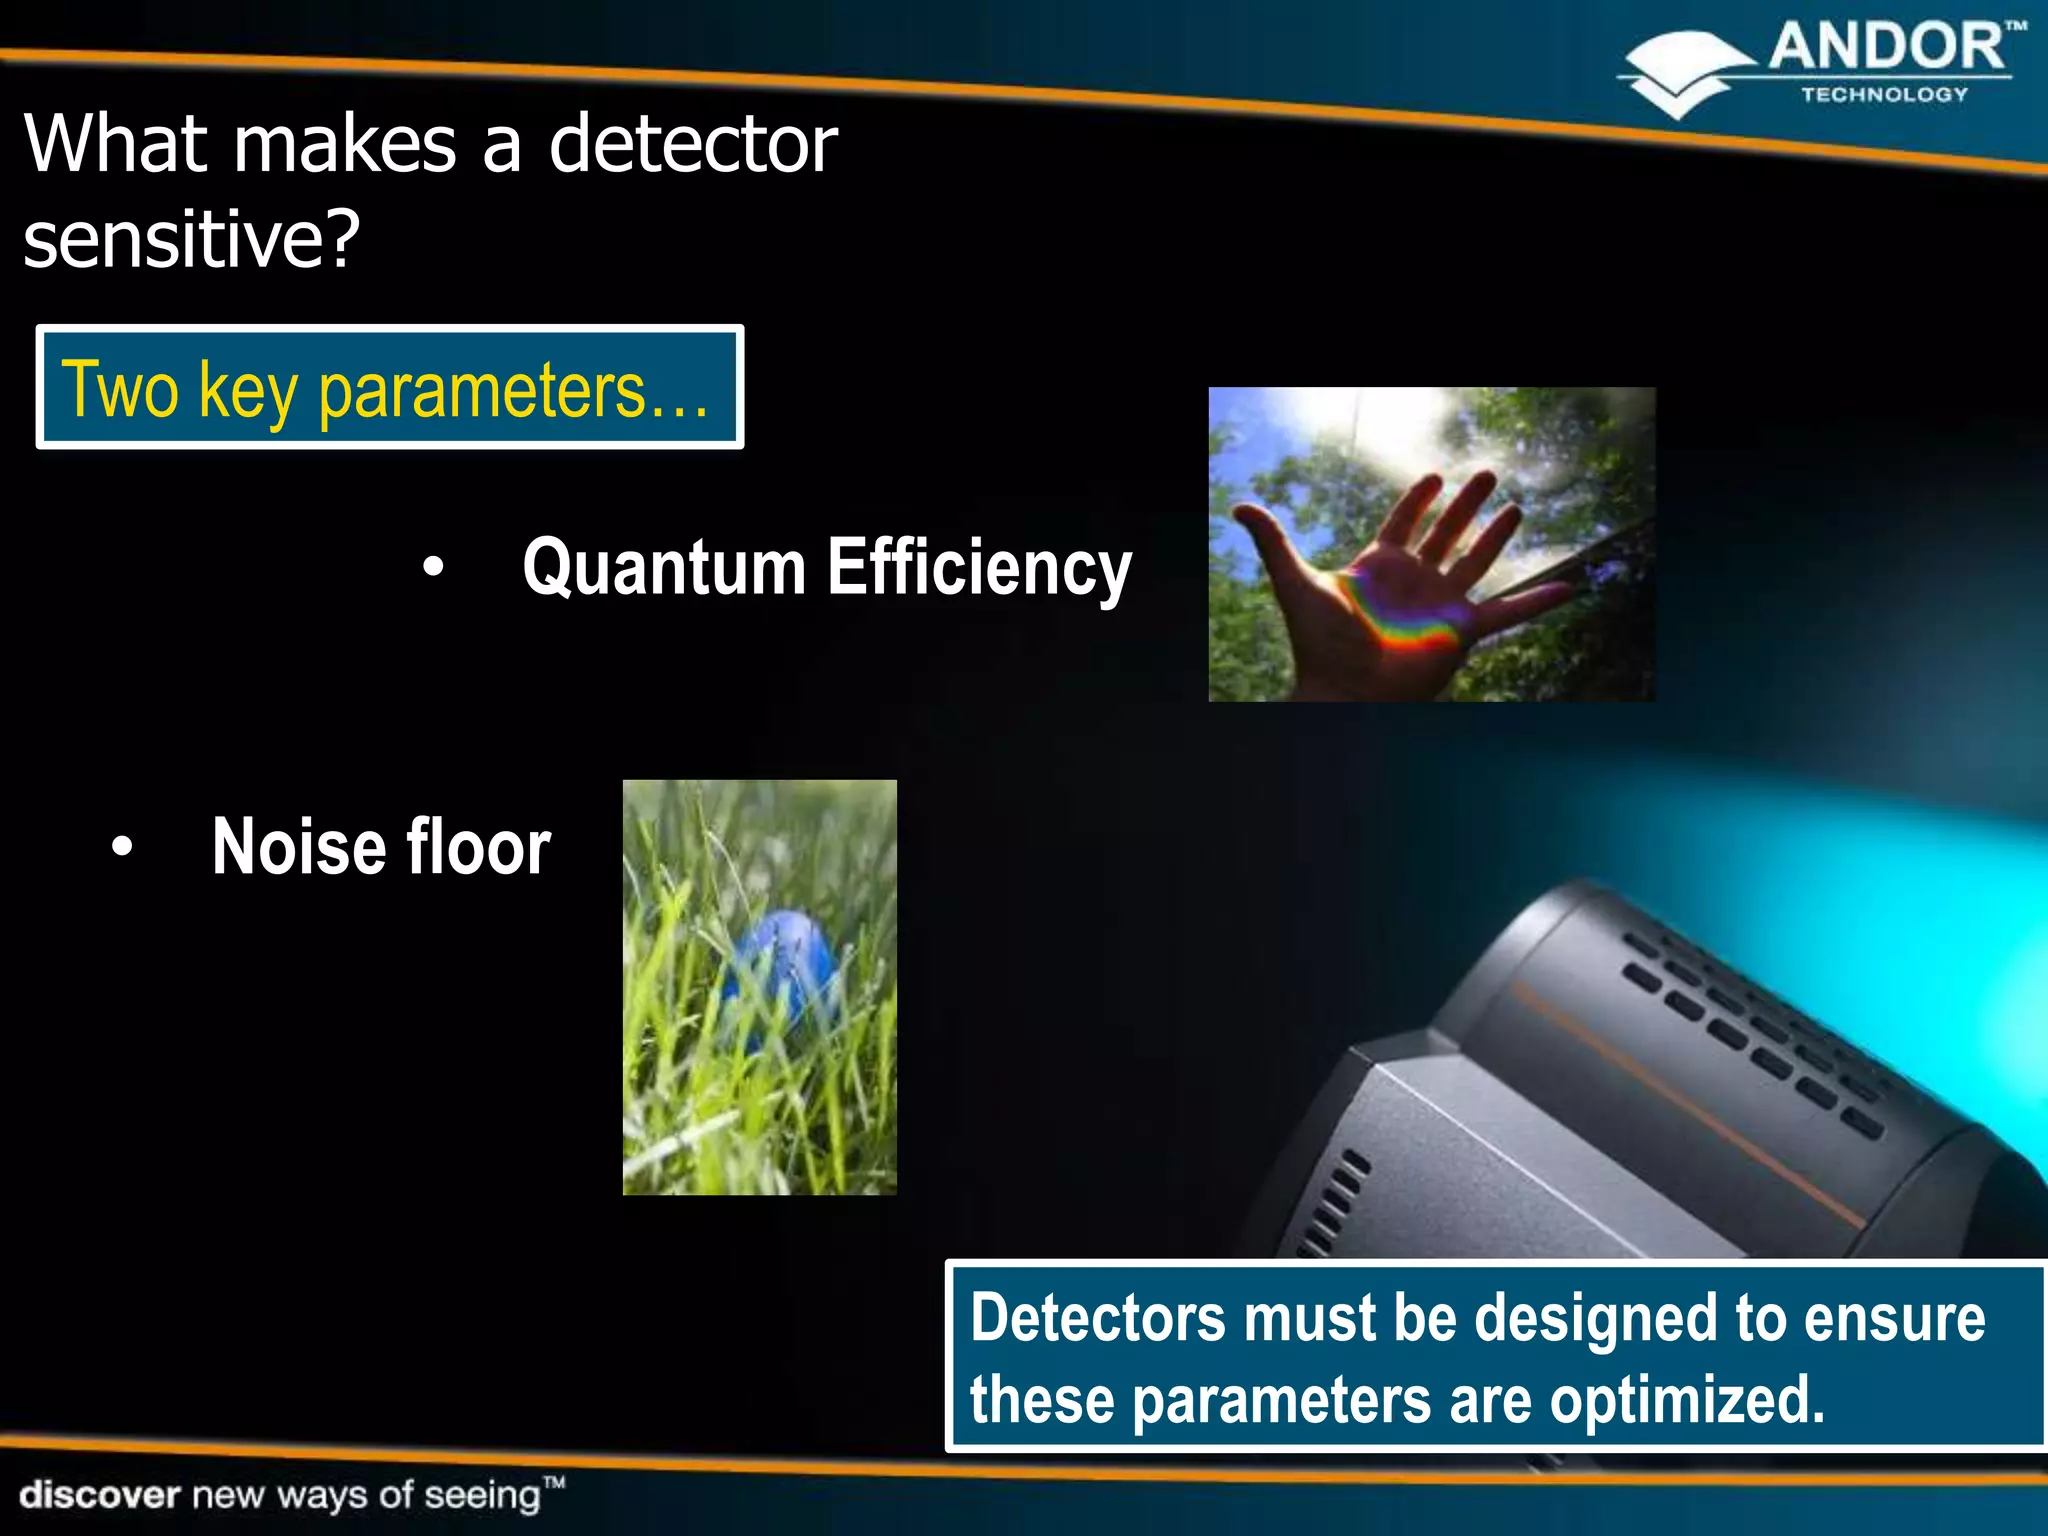
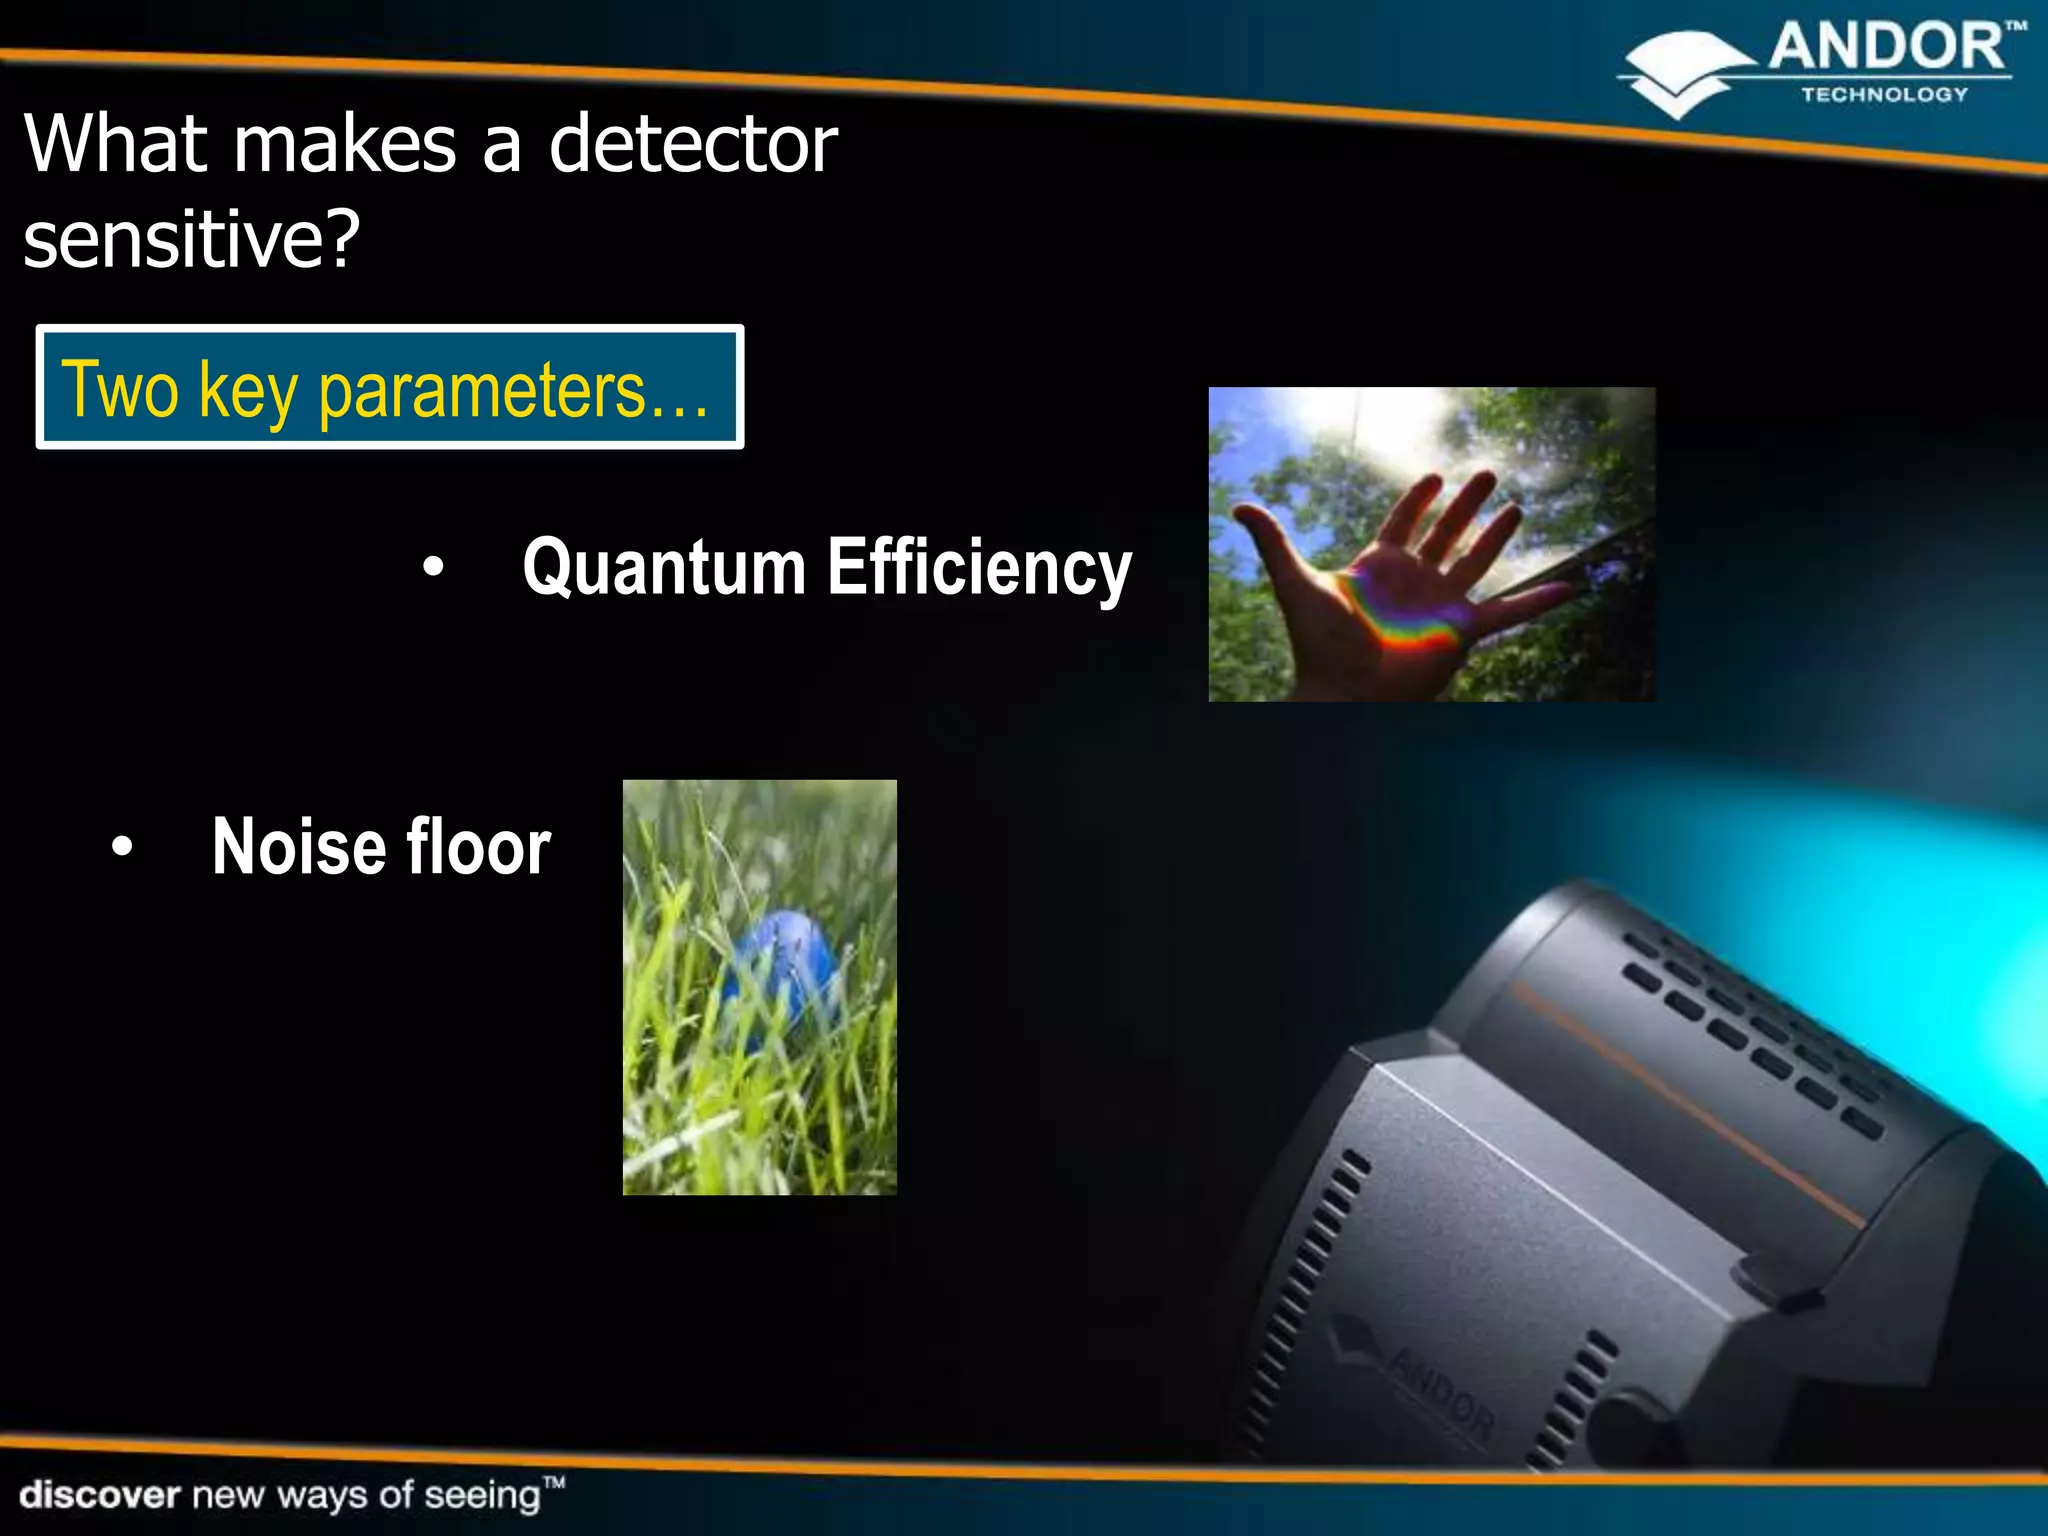
Detectors for light microscopy
         Marcin Barszczewski PhD

                                   1
• Single Molecule Detection
                                                 „Low Light Imaging‟
• Live cell confocal
                                                 Application examples
                       • TIRF
    • Ion signalling                   • Selective Plane Illumination Microscopy (SPIM)


     • Intracellular luminescence              • Cell Motility
                                                                      • FRET
                                 •Single photon counting

           • Fluorescence Correlation Spectroscopy (FCS)

                                            • Super-resolution PALM/ STORM
             • Adaptive optics
How to detect light from your samples?


 - PMTs
                  Point detectors
 - APDs

                                          “1D”, Low QE, uniformity, repeatability,
  Speed, low noise factor (PMTs)
                                                  high noise factor (APD)


 - CCDs
                   Array (2D) detectors
 - CMOS


  High sensitivity, low noise, 2D   Historically low speed, dynamic range, “packaging”
Scientific imaging trade-offs

              Today‟s imaging detectors exhibit trade-offs
                 between key performance parameters

                      • Low noise/sensitivity
                       • Speed
                       • Wide dynamic range
                       • High resolution
                       • Large field of view
When do we need sensitivity?


  • Low dye concentrations / single molecule

  • Short exposures / fast frame rates

  • High photon loss / rejection

  • Lower excitation power

  • Greater magnifications

  • Low quantum yield / Raman scatter
What makes a detector
sensitive?
Two key parameters…

           • Quantum Efficiency


  • Noise floor


                          Detectors must be designed to ensure
                          these parameters are optimized.
Typical Quantum Efficiency Curves

                                                      Back-illuminated
         100
                                                                    „Virtual Phase‟
         90                          MicroLens                     Front-illuminated
         80                       front-illuminated
         70                                                              Front-illuminated
QE (%)


         60                      ICCD
         50
         40
         30
         20
         10
          0
               200   300   400      500       600      700       800        900      1000
                                    Wavelength (nm)
Making sense of sensitivity

                        Shot Noise     • Read noise
                         Variation
                                          ‘Usual’ camera detection limit.

                                       • Dark noise
                                          Dependent on temperature

        Average
                                       • Shot Noise
     Signal Intensity                     QE and signal dependent.


                                             Noise Floor
                                     (Read Noise and Dark Noise)
Camera-based imaging technologies
                   Sony interline         EMCCD               sCMOS

 Sensor format          1.4 MP            1 MP (max.)                5.5 MP

 Pixel size             6.45 m            8 to 24 m                 6.5 m

 Max. frame rate      12 fps @ 20MHz     > 30 fps                   100 fps

 Read noise              4 – 8 e-       Negligible (<1 e-)     1 e- @ 30 fps
                                                               1.3 e- @ 100 fps

 QE                  ~ 60% (FI)        65% (FI) / >90% (BI)        ~ 57% (FI)
                                                                   (excellent red response)


 Dynamic range     ~ 3,000:1           ~ 8,500:1              30,000:1
                   (@ 11 frames/sec)   (@ 30 frames/sec)      (@ 30 frames/sec)

 Darkcurrent
 (TE cooled)        0.0003 e/pix/sec    0.001 e/pix/sec        0.07 e-/pix/sec
                    @ -55 0C            @ -85 0C               @ -30 0C
Frame transfer EMCCD – gain register
Effect of EM Gain on signal-to-noise


                                       EMCCD Gain
     Gain x1           Gain x10


     Gain x100         Gain x500
CMOS vs. CCD Architecture
What makes a detector
sensitive?
Two key parameters…

           • Quantum Efficiency


  • Noise floor
Primary sources of noise within imaging sensors


  1. READ NOISE
  -   Caused by electronic noise in the CCD output transistor and in the
      external circuitry

  2. DARK CURRENT
  -   Caused by thermally generated electrons in the CCD

  3. PHOTON NOISE / SHOT NOISE
  -   It is due to the fact that the CCD detects photons

  + other noise types
CCDs - reduced read noise      1MHz (offering ~ 1 fps) - 2.4 e- read noise
but slower frame rate

 - Read Noise is a
   fundamental trait of CCDs

 - Read noise can be
   accounted and corrected

 - Its influence on images     20MHz (offering ~ 11 fps) – 5.5 e- read noise
   can be decreased by
   reducing frame rates
Impact of extensive cooling on weak signals

  -70 0C             -95 0C           -   All CCDs build up “dark
                                          current” whether the CCD is
                                          being exposed to light or
                                          not

                                      -   The rate of dark current
                                          build up can be reduced by
                                          a factor of 100 or more by
                                          cooling the CCD

                                      -   The remaining dark current
 • Extremely weak signal –low-light       is subtracted from an image
 luminescence experiment                  using dark frames.
 • High EM Gain
External noise source - background photon


                                   Sources?

        • Out of focus fluorescence background – counter with
        confocal, TIRF, SPIM

        • Non-optimal optical filters

        • Stray background light

        • Non-specific binding of fluorophore.
Application
  Considerations

- which camera for
 what application?
Scientific imaging trade-offs

              Today‟s imaging detectors exhibit trade-offs
                 between key performance parameters

                       • Low noise/sensitivity
                       • Rapid frame rates
                       • Wide dynamic range
                       • High resolution
                       • Large field of view
Scientific CMOS (sCMOS)
          is unique in
 simultaneously offering:

• Extremely low noise (without multiplication)
• Rapid frame rates
• Wide dynamic range
• High QE
• High resolution
• Large field of view
The
Electron Multiplying
  Charge Coupled
       Device
      (EMCCD)

  Eliminates read noise detection limit

  High Quantum Efficiency

  Fast frame rates with the lowest
   noise
Single Molecule Detection

  • extremely low light regime - a back-illuminated EMCCD
    domain

  • pushing typical exposure times even shorter


Live cell imaging
  • sCMOS – greater flexibility with FOV, resolution, speed


  • Some low light modalities will still need the sensitivity of
    EMCCD, e.g. spinning disk confocal
EMCCD vs. sCMOS image comparison
                490             68           8
              photons        photons     photons
              per pixel      per pixel   per pixel


  sCMOS
 2x2 binned
  (13 µm)


  EMCCD
  (13 µm)
Field of View comparisons

 sCMOS


                                                                           Sony ICX285 interline


         Field of view comparison of two technologies; x60 magnification; 1.25 NA; 5.5 megapixel
                  sCMOS vs 1.4 megapixel interline CCD (each have ~ 6.5 m pixel pitch).
SPIM (Selective Plane Illumination Microscopy)

                                                       Neo sCMOS                         Dr. Lars
                                                                                         Hufnagel, Developmenta
                                                                                         l Biology Unit, EMBL
                                                                                         Heidelberg.
                                                       Resolution
                                                       Field of View

                                                       Speed

•   Optical sectioning even with lenses that have a large working
    distance and a relatively low numerical aperture

•   Especially well suited for the investigation of large samples (e.g.
    embryos) to study features such as
    growth, migration, morphological changes and gene expression
    patterns, that require high resolution, while being extended over a
    large volume.

•   Single plane illumination significantly reduces                       Mouse Embryo
    photobleaching/phototoxicity
Optical cross-sections through a developing Drosophila melanogaster embryo in stage 5/6. Two
Neos are used to capture this 3-D structure and one of these can be captured every 20
seconds.


                                                                                           26
Thank you for
your attention!


                  27

Detectors for light microscopy

  • 1.
    Detectors for lightmicroscopy Marcin Barszczewski PhD 1
  • 2.
    • Single MoleculeDetection „Low Light Imaging‟ • Live cell confocal Application examples • TIRF • Ion signalling • Selective Plane Illumination Microscopy (SPIM) • Intracellular luminescence • Cell Motility • FRET •Single photon counting • Fluorescence Correlation Spectroscopy (FCS) • Super-resolution PALM/ STORM • Adaptive optics
  • 3.
    How to detectlight from your samples? - PMTs Point detectors - APDs “1D”, Low QE, uniformity, repeatability, Speed, low noise factor (PMTs) high noise factor (APD) - CCDs Array (2D) detectors - CMOS High sensitivity, low noise, 2D Historically low speed, dynamic range, “packaging”
  • 4.
    Scientific imaging trade-offs Today‟s imaging detectors exhibit trade-offs between key performance parameters • Low noise/sensitivity • Speed • Wide dynamic range • High resolution • Large field of view
  • 5.
    When do weneed sensitivity? • Low dye concentrations / single molecule • Short exposures / fast frame rates • High photon loss / rejection • Lower excitation power • Greater magnifications • Low quantum yield / Raman scatter
  • 6.
    What makes adetector sensitive? Two key parameters… • Quantum Efficiency • Noise floor Detectors must be designed to ensure these parameters are optimized.
  • 7.
    Typical Quantum EfficiencyCurves Back-illuminated 100 „Virtual Phase‟ 90 MicroLens Front-illuminated 80 front-illuminated 70 Front-illuminated QE (%) 60 ICCD 50 40 30 20 10 0 200 300 400 500 600 700 800 900 1000 Wavelength (nm)
  • 8.
    Making sense ofsensitivity Shot Noise • Read noise Variation ‘Usual’ camera detection limit. • Dark noise Dependent on temperature Average • Shot Noise Signal Intensity QE and signal dependent. Noise Floor (Read Noise and Dark Noise)
  • 9.
    Camera-based imaging technologies Sony interline EMCCD sCMOS Sensor format 1.4 MP 1 MP (max.) 5.5 MP Pixel size 6.45 m 8 to 24 m 6.5 m Max. frame rate 12 fps @ 20MHz > 30 fps 100 fps Read noise 4 – 8 e- Negligible (<1 e-) 1 e- @ 30 fps 1.3 e- @ 100 fps QE ~ 60% (FI) 65% (FI) / >90% (BI) ~ 57% (FI) (excellent red response) Dynamic range ~ 3,000:1 ~ 8,500:1 30,000:1 (@ 11 frames/sec) (@ 30 frames/sec) (@ 30 frames/sec) Darkcurrent (TE cooled) 0.0003 e/pix/sec 0.001 e/pix/sec 0.07 e-/pix/sec @ -55 0C @ -85 0C @ -30 0C
  • 10.
    Frame transfer EMCCD– gain register
  • 11.
    Effect of EMGain on signal-to-noise EMCCD Gain Gain x1 Gain x10 Gain x100 Gain x500
  • 12.
    CMOS vs. CCDArchitecture
  • 13.
    What makes adetector sensitive? Two key parameters… • Quantum Efficiency • Noise floor
  • 14.
    Primary sources ofnoise within imaging sensors 1. READ NOISE - Caused by electronic noise in the CCD output transistor and in the external circuitry 2. DARK CURRENT - Caused by thermally generated electrons in the CCD 3. PHOTON NOISE / SHOT NOISE - It is due to the fact that the CCD detects photons + other noise types
  • 15.
    CCDs - reducedread noise 1MHz (offering ~ 1 fps) - 2.4 e- read noise but slower frame rate - Read Noise is a fundamental trait of CCDs - Read noise can be accounted and corrected - Its influence on images 20MHz (offering ~ 11 fps) – 5.5 e- read noise can be decreased by reducing frame rates
  • 16.
    Impact of extensivecooling on weak signals -70 0C -95 0C - All CCDs build up “dark current” whether the CCD is being exposed to light or not - The rate of dark current build up can be reduced by a factor of 100 or more by cooling the CCD - The remaining dark current • Extremely weak signal –low-light is subtracted from an image luminescence experiment using dark frames. • High EM Gain
  • 17.
    External noise source- background photon Sources? • Out of focus fluorescence background – counter with confocal, TIRF, SPIM • Non-optimal optical filters • Stray background light • Non-specific binding of fluorophore.
  • 18.
    Application Considerations -which camera for what application?
  • 19.
    Scientific imaging trade-offs Today‟s imaging detectors exhibit trade-offs between key performance parameters • Low noise/sensitivity • Rapid frame rates • Wide dynamic range • High resolution • Large field of view
  • 20.
    Scientific CMOS (sCMOS) is unique in simultaneously offering: • Extremely low noise (without multiplication) • Rapid frame rates • Wide dynamic range • High QE • High resolution • Large field of view
  • 21.
    The Electron Multiplying Charge Coupled Device (EMCCD)  Eliminates read noise detection limit  High Quantum Efficiency  Fast frame rates with the lowest noise
  • 22.
    Single Molecule Detection • extremely low light regime - a back-illuminated EMCCD domain • pushing typical exposure times even shorter Live cell imaging • sCMOS – greater flexibility with FOV, resolution, speed • Some low light modalities will still need the sensitivity of EMCCD, e.g. spinning disk confocal
  • 23.
    EMCCD vs. sCMOSimage comparison 490 68 8 photons photons photons per pixel per pixel per pixel sCMOS 2x2 binned (13 µm) EMCCD (13 µm)
  • 24.
    Field of Viewcomparisons sCMOS Sony ICX285 interline Field of view comparison of two technologies; x60 magnification; 1.25 NA; 5.5 megapixel sCMOS vs 1.4 megapixel interline CCD (each have ~ 6.5 m pixel pitch).
  • 25.
    SPIM (Selective PlaneIllumination Microscopy) Neo sCMOS Dr. Lars Hufnagel, Developmenta l Biology Unit, EMBL Heidelberg.  Resolution  Field of View  Speed • Optical sectioning even with lenses that have a large working distance and a relatively low numerical aperture • Especially well suited for the investigation of large samples (e.g. embryos) to study features such as growth, migration, morphological changes and gene expression patterns, that require high resolution, while being extended over a large volume. • Single plane illumination significantly reduces Mouse Embryo photobleaching/phototoxicity
  • 26.
    Optical cross-sections througha developing Drosophila melanogaster embryo in stage 5/6. Two Neos are used to capture this 3-D structure and one of these can be captured every 20 seconds. 26
  • 27.
    Thank you for yourattention! 27

Editor's Notes

  • #13 Explain why CMOS is attractiveCCD = only for highend detectorsCMOS is used for more than 99% of all electronic manufactute. Therefore you can do more for cheap.
  • #27 Themovie shows optical cross-sections through a developing Drosophila melanogaster embryo in stage 5/6. This H2B-mCherry mutant has fluorescently labeled nuclei. The left two images show recordings from the front sCMOS camera (good images at the beginning of the stack), the right two show images collected by the back sCMOS (good images at the end). The top images were illuminated from the top (top part of the images is sharp), while the bottom images were illuminated from the bottom (the bottom part of the images looks sharp). All four stacks together provide complete information about the location and speed of every single cell in the embryo. Due to the 4-lens setup and fast frame rates made possible by the sCMOS, we are able to record such a 3-dimensional image of the embryo every 20 seconds. (Stefan Guenther &amp; Uros Krzic, Hufnagel lab, EMBL Heidelberg)They have one computer per camera and another &quot;master computer&quot; that controls the whole experiment, in total three PCs.Unfortunately we had to write the software from scratch (in LabView) to control such a complex machine, including the modules that talk to the sCMOS cameras. A typical experiment produces around 2-3 Tb of data. We have a dedicated RAID computer with approx 60Tb storage to store the data while it&apos;s being analysed, and a fiber-optic 10gbase network to the microscope computers.