Download as PDF, PPTX

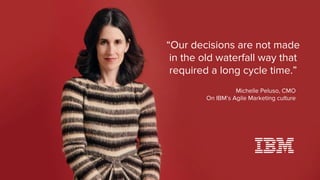

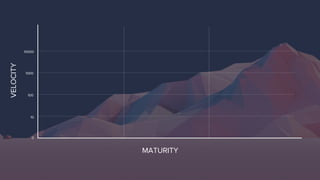
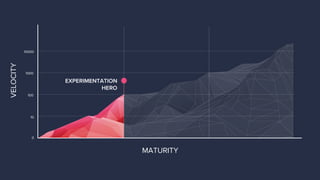
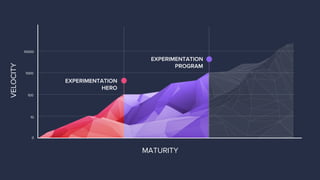
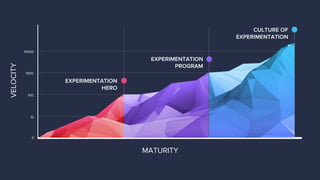
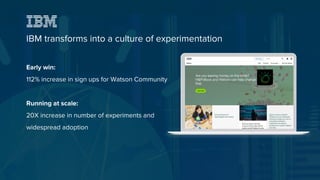
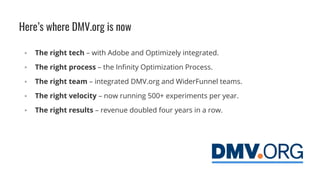


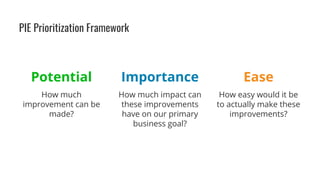
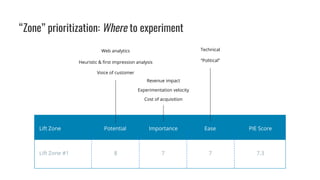
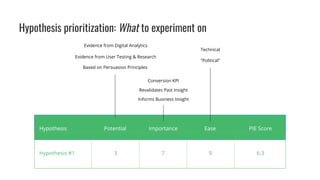
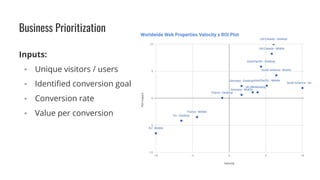
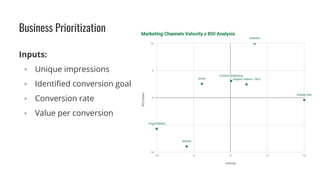
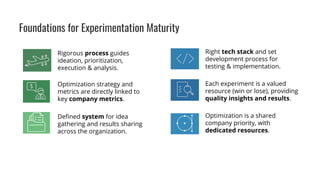
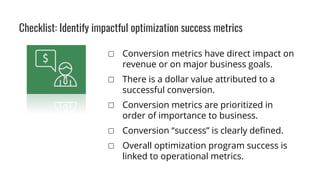


The document discusses the evolution of IBM into a culture of experimentation, highlighting a successful case study of a client's journey from minimal optimization to a robust experimentation program that conducted over 500 experiments a year and doubled revenue for four consecutive years. It outlines the importance of structured approaches, the right technology, and prioritization frameworks in achieving experimentation maturity. Key elements include integrating teams, defining metrics, and maintaining a focus on clarity and relevance in testing practices.
![[Webinar] Building Your Organizations Experimentation Engine - Chris Goward &...](https://cdn.slidesharecdn.com/ss_thumbnails/avangateexperimentationenginechrisgowardv2-180620163210-thumbnail.jpg?width=640&height=640&fit=bounds)
![[Webinar] Creating Emotionally Relevant Customer Experiences - WiderFunnel & ...](https://cdn.slidesharecdn.com/ss_thumbnails/evergage2018chrisgowardv3-180628163736-thumbnail.jpg?width=640&height=640&fit=bounds)


![[Webinar] Scaling experimentation: 5 key pillars of maturity by Nick So](https://cdn.slidesharecdn.com/ss_thumbnails/scalingexperimentation-5keypillarsofmaturity-nickso-180523213514-thumbnail.jpg?width=640&height=640&fit=bounds)


![[Webinar] Visa's Journey to a Culture of Experimentation](https://cdn.slidesharecdn.com/ss_thumbnails/optimizelywebinar-visasjourneytoacultureofexperimentation-180227210737-thumbnail.jpg?width=640&height=640&fit=bounds)


![[Webinar] The power of experimentation in direct-to-consumer eCommerce](https://cdn.slidesharecdn.com/ss_thumbnails/taylormadewiderfunnelwebinar-201119205416-thumbnail.jpg?width=640&height=640&fit=bounds)


![[Webinar] Groomed for Success: Dollar Shave Club Wins with Experimentation](https://cdn.slidesharecdn.com/ss_thumbnails/dscwiderfunnelwebinarv1-200227004622-thumbnail.jpg?width=640&height=640&fit=bounds)


![[Webinar] Getting started with server-side testing - presented by WiderFunnel...](https://cdn.slidesharecdn.com/ss_thumbnails/serversidetestingwebinardeck-171213214850-thumbnail.jpg?width=640&height=640&fit=bounds)