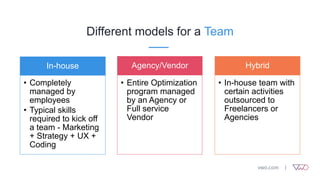
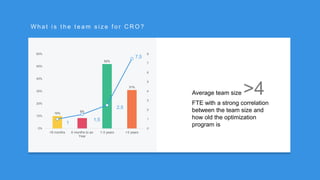
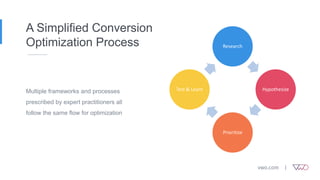
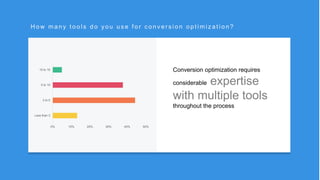
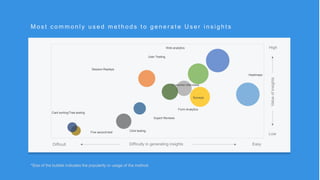
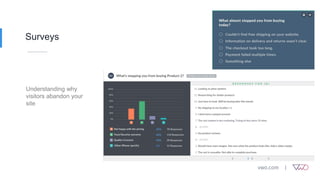
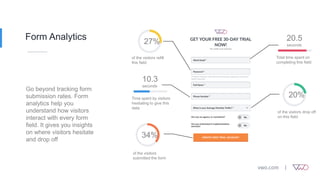
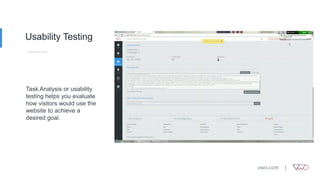
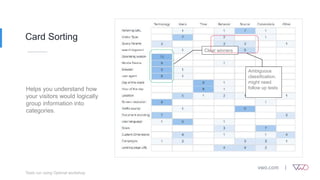
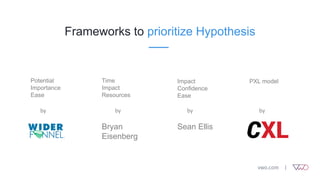
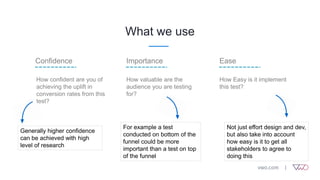
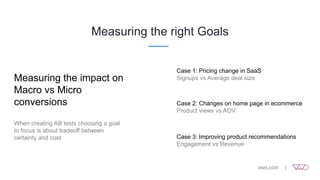
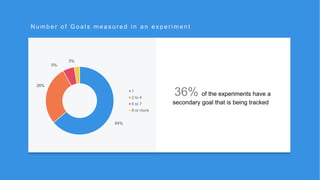
Build a winning optimization
strategy
Srikant Kotapalli
Head of Product @ VWO
Most commonly used methods for
optimizing conversion rates
What is A/B testing
In the most simplest form, A/B
Testing is comparing two versions
of a web page to see which version
performs better for a defined
conversion goal
Adding ‘Free
Shipping’ threshold
leads to increase in
AOV by 7.3%
A N E X A M P L E Variation
Control
Is A/B Testing really working?
Only Only More than
1in 8
Tests create a
major impact
on conversions
25
%
Companies are quite
satisfied with their
conversion rates
7in
10
Companies do not
take a structured
approach to testing
Source: Conversionxl and econsultancy 2016 report
High frequency, low returns testing
What does it take to be
successful at Testing?
A successful
Optimization Engine
People Process Techniques
Building a Team
Different models for a Team
In-house
• Completely
managed by
employees
• Typical skills
required to kick off
a team - Marketing
+ Strategy + UX +
Coding
Agency/Vendor
• Entire Optimization
program managed
by an Agency or
Full service
Vendor
Hybrid
• In-house team with
certain activities
outsourced to
Freelancers or
Agencies
r
W h a t i s t h e t e a m s i z e f o r C R O ?
Average team size >4
FTE with a strong correlation
between the team size and
how old the optimization
program is
10%
8%
52%
31%
1
1,5
2,5
7,5
0
1
2
3
4
5
6
7
8
0%
10%
20%
30%
40%
50%
60%
<6 months 6 months to an
Year
1-3 years >3 years
r
W h a t a r e a s o f o p t i m i z a t i o n a r e y o u m o s t l i k e l y t o o u t s o u r c e ?
Development,
Designand QAof the
experiment are the top skills that
companies outsource
0% 5% 10% 15% 20% 25% 30% 35%
Entire Optimization Program
Strategy
Project Management
Idea Generation
User Research
UI/Design of the Test
Copywriting
Development of the Test
QA of the Test
None
Adopting the
right process
A Simplified Conversion
Optimization Process
Multiple frameworks and processes
prescribed by expert practitioners all
follow the same flow for optimization
Research
Hypothesize
Prioritize
Test & Learn
Tools & Techniques
r
H o w m a n y t o o l s d o y o u u s e f o r c o n v e r s i o n o p t i m i z a t i o n ?
Conversion optimization requires
considerable expertise
with multiple tools
throughout the process
0% 10% 20% 30% 40% 50%
Less than 3
3 to 5
5 to 10
10 to 15
Techniques for
Research
Research
Hypothesize
Prioritize
Test & Learn
r
M o s t c o m m o n l y u s e d m e t h o d s t o g e n e r a t e U s e r i n s i g h t s
Heatmaps
Session Replays
Customer interviews
Surveys
Web analytics
User Testing
Expert Reviews
Click testingFive second test
Card sorting/Tree testing
Form Analytics
Difficulty in generating insightsDifficult Easy
Valueofinsights
Low
High
*Size of the bubble indicates the popularity or usage of the method
Heuristic Analysis
Evaluation of a website by
a usability expert against a
set heuristics to identify
potential conversion
barriers
Heatmap
Navigation bar distracting
users from the primary goal
of this page which is to
download the app
Scrollmap
A sharp drop-off of 40
%age points happens here
and content below this is
going to be ineffective.
Also acts as a in page
funnel representation
98% (103) views
58% (61) views
Session Replays
A huge drop-off of 40 %age
points happens here and
content below this is going
to be ineffective.
Also acts as a in page
funnel representation
98% (103) views
58% (61) views
Surveys
Understanding Word of
mouth effect on your direct
traffic
98% (103) views
58% (61) views
Surveys
Understanding why
visitors abandon your
site
98% (103) views
58% (61) views
Form Analytics
Go beyond tracking form
submission rates. Form
analytics help you
understand how visitors
interact with every form
field. It gives you insights
on where visitors hesitate
and drop off
98% (103) views
58% (61) views
27%
34%
of the visitors
submitted the form
20.5
seconds
Total time spent on
completing this field
10.3
seconds
Time spent by visitors
hesitating to give this
data
20%
of the visitors drop off
on this field
of the visitors refill
this field
Usability Testing
Task Analysis or usability
testing helps you evaluate
how visitors would use the
website to achieve a
desired goal.
98% (103) views
58% (61) views
Card Sorting
Helps you understand how
your visitors would logically
group information into
categories.
98% (103) views
58% (61) views
Clear winners
Ambiguous
classification,
might need
follow up tests
Tests run using Optimal workshop
Five Second test
Helps you understand how
visitors perceive your
messaging
98% (103) views
58% (61) views
What solution are they selling?
Tests run using Usabilityhub
Techniques for
better Hypothesis
Research
Hypothesize
Prioritize
Test & Learn
Build a structured Hypothesis
Based on Observations
I believe Solution
will address Problem
for Audience
and impact Goal by uplift %
Evidence or
Research that
identifies a pattern
or a problem that
needs solving
If you are just starting to
test, then Audience is
probably all visitors. But
as you mature in
optimization your
audience is a subset
Brings in accountability
on what your team
was trying to achieve
Techniques for
better Hypothesis
Research
Hypothesize
Prioritize
Test & Learn
r
W h a t % a g e o f i d e a s d o y o u t e s t f r o m y o u r b a c k l o g ?
There are always more
ideas than you can actually
test. Prioritizationof
which ideas to test is essential
0% 5% 10% 15% 20% 25% 30% 35%
<10%
10% - 25%
25% - 50%
50% - 75%
>75%
Frameworks to prioritize Hypothesis
Potential
Importance
Ease
Time
Impact
Resources
Bryan
Eisenberg
Impact
Confidence
Ease
Sean Ellis
PXL model
by by by by
What we use
Confidence Importance Ease
How confident are you of
achieving the uplift in
conversion rates from this
test?
How valuable are the
audience you are testing
for?
How Easy is it implement
this test?
Generally higher confidence
can be achieved with high
level of research
Not just effort design and dev,
but also take into account
how easy is it to get all
stakeholders to agree to
doing this
For example a test
conducted on bottom of the
funnel could be more
important than a test on top
of the funnel
Techniques for
Test & Learn
Research
Hypothesize
Prioritize
Test & Learn
Measuring the right Goals
Measuring the impact on
Macro vs Micro
conversions
When creating AB tests choosing a goal
to focus is about tradeoff between
certainty and cost
Case 1: Pricing change in SaaS
Signups vs Average deal size
Case 2: Changes on home page in ecommerce
Product views vs AOV
Case 3: Improving product recommendations
Engagement vs Revenue
r
N u m b e r o f G o a l s m e a s u r e d i n a n e x p e r i m e n t
36% of the experiments have a
secondary goal that is being tracked
64%
28%
5%
3%
1
2 to 4
5 to 7
8 or more
Uncover learnings
Say you are running a test
to see if adding a price
store to your category or
home page increases your
conversions. And find it
wins for the goal add-to-
carts. What do you do
next?
Are there segments
that performed better
or worse for the
price store?
Impact on
profitability of adding
a price store?
Were there any
segments who
converted better but
with a lower AOV?
r
H o w m a n y t i m e s d o e s a f a i l e d t e s t l e a d t o a n o t h e r i d e a ?
Every test, even a failedone
can result in better
understanding of
visitor behaviorand
generate follow up ideas
0% 5% 10% 15% 20% 25% 30% 35% 40%
1 in 10
1 in 5
1 in 3
1 in 2
No follow up ideas
Thank You!
Q&A
Come talk to us at
Booth 4 to discuss
how VWO can help
with your Optimization
Program
A/B Testing & Conversion Optimization Platform
powered by SmartStats
2.5bn+
Users served per
month
Goals FunnelsTrack
Heatmaps Recordings Surveys FormsAnalyze
Test
Plan HypothesisObservation

Build a Winning Conversion Optimization Strategy

  • 1.
    Build a winningoptimization strategy Srikant Kotapalli Head of Product @ VWO
  • 2.
    Most commonly usedmethods for optimizing conversion rates
  • 3.
    What is A/Btesting In the most simplest form, A/B Testing is comparing two versions of a web page to see which version performs better for a defined conversion goal
  • 4.
    Adding ‘Free Shipping’ threshold leadsto increase in AOV by 7.3% A N E X A M P L E Variation Control
  • 5.
    Is A/B Testingreally working? Only Only More than 1in 8 Tests create a major impact on conversions 25 % Companies are quite satisfied with their conversion rates 7in 10 Companies do not take a structured approach to testing Source: Conversionxl and econsultancy 2016 report High frequency, low returns testing
  • 6.
    What does ittake to be successful at Testing?
  • 7.
  • 8.
  • 9.
    Different models fora Team In-house • Completely managed by employees • Typical skills required to kick off a team - Marketing + Strategy + UX + Coding Agency/Vendor • Entire Optimization program managed by an Agency or Full service Vendor Hybrid • In-house team with certain activities outsourced to Freelancers or Agencies
  • 10.
    r W h at i s t h e t e a m s i z e f o r C R O ? Average team size >4 FTE with a strong correlation between the team size and how old the optimization program is 10% 8% 52% 31% 1 1,5 2,5 7,5 0 1 2 3 4 5 6 7 8 0% 10% 20% 30% 40% 50% 60% <6 months 6 months to an Year 1-3 years >3 years
  • 11.
    r W h at a r e a s o f o p t i m i z a t i o n a r e y o u m o s t l i k e l y t o o u t s o u r c e ? Development, Designand QAof the experiment are the top skills that companies outsource 0% 5% 10% 15% 20% 25% 30% 35% Entire Optimization Program Strategy Project Management Idea Generation User Research UI/Design of the Test Copywriting Development of the Test QA of the Test None
  • 12.
  • 13.
    A Simplified Conversion OptimizationProcess Multiple frameworks and processes prescribed by expert practitioners all follow the same flow for optimization Research Hypothesize Prioritize Test & Learn
  • 14.
  • 15.
    r H o wm a n y t o o l s d o y o u u s e f o r c o n v e r s i o n o p t i m i z a t i o n ? Conversion optimization requires considerable expertise with multiple tools throughout the process 0% 10% 20% 30% 40% 50% Less than 3 3 to 5 5 to 10 10 to 15
  • 16.
  • 17.
    r M o st c o m m o n l y u s e d m e t h o d s t o g e n e r a t e U s e r i n s i g h t s Heatmaps Session Replays Customer interviews Surveys Web analytics User Testing Expert Reviews Click testingFive second test Card sorting/Tree testing Form Analytics Difficulty in generating insightsDifficult Easy Valueofinsights Low High *Size of the bubble indicates the popularity or usage of the method
  • 18.
    Heuristic Analysis Evaluation ofa website by a usability expert against a set heuristics to identify potential conversion barriers
  • 19.
    Heatmap Navigation bar distracting usersfrom the primary goal of this page which is to download the app
  • 20.
    Scrollmap A sharp drop-offof 40 %age points happens here and content below this is going to be ineffective. Also acts as a in page funnel representation 98% (103) views 58% (61) views
  • 21.
    Session Replays A hugedrop-off of 40 %age points happens here and content below this is going to be ineffective. Also acts as a in page funnel representation 98% (103) views 58% (61) views
  • 22.
    Surveys Understanding Word of moutheffect on your direct traffic 98% (103) views 58% (61) views
  • 23.
    Surveys Understanding why visitors abandonyour site 98% (103) views 58% (61) views
  • 24.
    Form Analytics Go beyondtracking form submission rates. Form analytics help you understand how visitors interact with every form field. It gives you insights on where visitors hesitate and drop off 98% (103) views 58% (61) views 27% 34% of the visitors submitted the form 20.5 seconds Total time spent on completing this field 10.3 seconds Time spent by visitors hesitating to give this data 20% of the visitors drop off on this field of the visitors refill this field
  • 25.
    Usability Testing Task Analysisor usability testing helps you evaluate how visitors would use the website to achieve a desired goal. 98% (103) views 58% (61) views
  • 26.
    Card Sorting Helps youunderstand how your visitors would logically group information into categories. 98% (103) views 58% (61) views Clear winners Ambiguous classification, might need follow up tests Tests run using Optimal workshop
  • 27.
    Five Second test Helpsyou understand how visitors perceive your messaging 98% (103) views 58% (61) views What solution are they selling? Tests run using Usabilityhub
  • 28.
  • 29.
    Build a structuredHypothesis Based on Observations I believe Solution will address Problem for Audience and impact Goal by uplift % Evidence or Research that identifies a pattern or a problem that needs solving If you are just starting to test, then Audience is probably all visitors. But as you mature in optimization your audience is a subset Brings in accountability on what your team was trying to achieve
  • 30.
  • 31.
    r W h at % a g e o f i d e a s d o y o u t e s t f r o m y o u r b a c k l o g ? There are always more ideas than you can actually test. Prioritizationof which ideas to test is essential 0% 5% 10% 15% 20% 25% 30% 35% <10% 10% - 25% 25% - 50% 50% - 75% >75%
  • 32.
    Frameworks to prioritizeHypothesis Potential Importance Ease Time Impact Resources Bryan Eisenberg Impact Confidence Ease Sean Ellis PXL model by by by by
  • 33.
    What we use ConfidenceImportance Ease How confident are you of achieving the uplift in conversion rates from this test? How valuable are the audience you are testing for? How Easy is it implement this test? Generally higher confidence can be achieved with high level of research Not just effort design and dev, but also take into account how easy is it to get all stakeholders to agree to doing this For example a test conducted on bottom of the funnel could be more important than a test on top of the funnel
  • 34.
    Techniques for Test &Learn Research Hypothesize Prioritize Test & Learn
  • 35.
    Measuring the rightGoals Measuring the impact on Macro vs Micro conversions When creating AB tests choosing a goal to focus is about tradeoff between certainty and cost Case 1: Pricing change in SaaS Signups vs Average deal size Case 2: Changes on home page in ecommerce Product views vs AOV Case 3: Improving product recommendations Engagement vs Revenue
  • 36.
    r N u mb e r o f G o a l s m e a s u r e d i n a n e x p e r i m e n t 36% of the experiments have a secondary goal that is being tracked 64% 28% 5% 3% 1 2 to 4 5 to 7 8 or more
  • 37.
    Uncover learnings Say youare running a test to see if adding a price store to your category or home page increases your conversions. And find it wins for the goal add-to- carts. What do you do next? Are there segments that performed better or worse for the price store? Impact on profitability of adding a price store? Were there any segments who converted better but with a lower AOV?
  • 38.
    r H o wm a n y t i m e s d o e s a f a i l e d t e s t l e a d t o a n o t h e r i d e a ? Every test, even a failedone can result in better understanding of visitor behaviorand generate follow up ideas 0% 5% 10% 15% 20% 25% 30% 35% 40% 1 in 10 1 in 5 1 in 3 1 in 2 No follow up ideas
  • 39.
    Thank You! Q&A Come talkto us at Booth 4 to discuss how VWO can help with your Optimization Program A/B Testing & Conversion Optimization Platform powered by SmartStats 2.5bn+ Users served per month Goals FunnelsTrack Heatmaps Recordings Surveys FormsAnalyze Test Plan HypothesisObservation