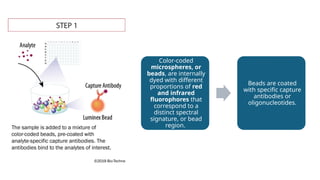
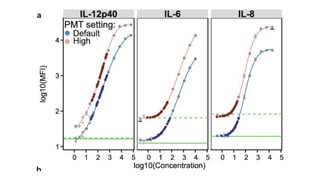
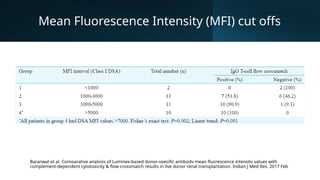
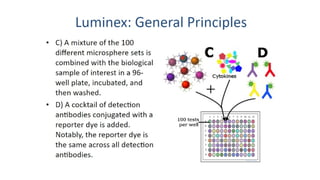
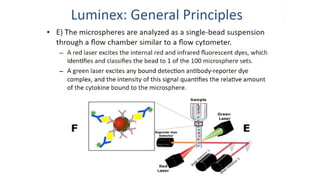
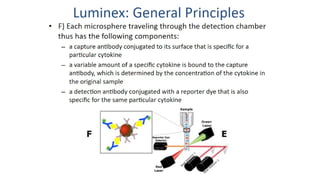
Tissue Typing and
HLA Luminex
Ken Chau
Contents
• HLA
• What is Luminex, Multiplex
• What is MFI
• How is MFI interpreted, correlate clinically
LUMINEX
What is LUMINEX immunoassay?
• Luminex assay is a magnetic microparticle-based immunoassay which utilizes
the same sandwich principles as traditional ELISAs (Enzyme-linked
immunosorbent assay).
Color-coded
microspheres, or
beads, are internally
dyed with different
proportions of red
and infrared
fluorophores that
correspond to a
distinct spectral
signature, or bead
region.
Beads are coated
with specific capture
antibodies or
oligonucleotides.
• The sample is mixed with the
bead mixture, allowing the
analytes to bind to their
respective capture antibodies on
the beads.
• The beads are incubated to
allow for the binding of analytes
from the sample.
• After washing away unbound
materials, samples are
incubated with a mixture of
biotinylated detection
antibodies and a streptavidin-
phycoerythrin (PE) reporter, a
fluorescent dye.
• The beads are passed through a dual-laser flow-based detection system in the Luminex
analyzer.
• One laser excites the internal dyes to identify the bead set and hence the analyte.
• The second laser excites the PE, generating a fluorescence signal that correlates with
the amount of analyte bound.
• Multiple readings are taken at each bead region, ensuring robust detection.
What is Multiplex?
• Multiplex allows multiple biological target analytes to be simultaneously
examined and quantified in a single sample.
Benefits of Multiplex include:
• Maximizes limited sample – allows data collection from just 25mcL or less of
undiluted sample
• Minimizes experimental variability – samples are processed only once, so
multiple data points are derived from a single manipulation
• Economical – examining multiple analytes in a single sample saves time and
resources.
Median Fluorescence Intensity (MFI)
MFI is how Luminex results are read out.
1.Fluorescence Measurement:
1. The fluorescence intensity of PE on each bead is measured.
2. The intensity reflects the quantity of the analyte captured on that bead.
2.Median Calculation:
1. For each bead set (specific analyte), the fluorescence intensity is measured for numerous beads.
2. The median value of these fluorescence intensities is calculated.
3. The median, rather than the mean, is used to reduce the impact of outliers and provide a more
robust measure of central tendency.
3.Interpreting MFI:
1. MFI is directly proportional to the concentration of the analyte in the sample.
2. Higher MFI values indicate higher concentrations of the target analyte.
4.Standard Curves and Quantification:
1. Standard curves are generated using known concentrations of the analyte.
2. The MFI values from the samples are compared to the standard curve to quantify the analyte
concentration.
Typical Bead Count per Analyte
1.Minimum Bead Count:
1. Most Luminex instruments and assays are designed to use at least 50 to 100 beads
per analyte to ensure robust statistical analysis.
2. This count provides a sufficient sample size to calculate a reliable median value and
reduces the impact of any potential outliers.
2.Optimal Bead Count:
1. For higher precision and reliability, many assays use around 100 to 200 beads per
analyte.
2. This range ensures a good representation of the population of beads, allowing for
more accurate median calculations.
3.High Throughput and Variability:
1. In high-throughput settings or assays with more variability, using even more beads
(up to several hundred) per analyte might be preferred to enhance data
robustness.
How do we correlate fluorescence intensity to
actual level of antigen/antibody?
• The correlation of fluorescence intensity to the actual level of
antigen or antibody in a Luminex immunoassay involves
generating a standard curve using known concentrations of the
target analyte
• 1) after preparing a series of standard solutions with known
concentrations (using serial dilution methods) of target
antigen/antibody.
• 2) run Luminex assay on each solutions and measure fluorescence
intensity (FI)
• 3) plot FI against different concentration to generate standard
curve
Mean Fluorescence Intensity (MFI) cut offs
Baranwal et al. Comparative analysis of Luminex-based donor-specific antibody mean fluorescence intensity values with
complement-dependent cytotoxicity & flow crossmatch results in live donor renal transplantation. Indian J Med Res. 2017 Feb
Conclusion
• 60 years have passed since the introduction of complement-dependent cytotoxicity (CDC) as the
first technique for the detection of HLA antibodies in recipients before undergoing renal
transplantation.
• Methodologies to detect HLA antibodies have progressed from purely target donor cell-based
assays, such as CDC or flow cytometry to the more sensitive and specific HLA protein-based
solid-phase assay systems in the form of an enzyme-linked immunosorbent assay (ELISA) or
HLA antigen-coated fluorescence bead assay based on a Luminex platform.
• In Luminex, the mean fluorescence intensity (MFI) is a measure of the degree of saturation of
total antigens present on the beads by antibodies and is used as a surrogate marker for the level
of antibody titres.
• Currently, there is a lack of consensus with regard to the optimum MFI cut-offs for classifying
antibodies as positive or those that are significant.
Thank you.
Any question?

Luminex, Tissue typing and HLA matching.

  • 1.
    Tissue Typing and HLALuminex Ken Chau
  • 2.
    Contents • HLA • Whatis Luminex, Multiplex • What is MFI • How is MFI interpreted, correlate clinically
  • 6.
  • 7.
    What is LUMINEXimmunoassay? • Luminex assay is a magnetic microparticle-based immunoassay which utilizes the same sandwich principles as traditional ELISAs (Enzyme-linked immunosorbent assay).
  • 8.
    Color-coded microspheres, or beads, areinternally dyed with different proportions of red and infrared fluorophores that correspond to a distinct spectral signature, or bead region. Beads are coated with specific capture antibodies or oligonucleotides.
  • 9.
    • The sampleis mixed with the bead mixture, allowing the analytes to bind to their respective capture antibodies on the beads. • The beads are incubated to allow for the binding of analytes from the sample. • After washing away unbound materials, samples are incubated with a mixture of biotinylated detection antibodies and a streptavidin- phycoerythrin (PE) reporter, a fluorescent dye.
  • 10.
    • The beadsare passed through a dual-laser flow-based detection system in the Luminex analyzer. • One laser excites the internal dyes to identify the bead set and hence the analyte. • The second laser excites the PE, generating a fluorescence signal that correlates with the amount of analyte bound. • Multiple readings are taken at each bead region, ensuring robust detection.
  • 11.
    What is Multiplex? •Multiplex allows multiple biological target analytes to be simultaneously examined and quantified in a single sample. Benefits of Multiplex include: • Maximizes limited sample – allows data collection from just 25mcL or less of undiluted sample • Minimizes experimental variability – samples are processed only once, so multiple data points are derived from a single manipulation • Economical – examining multiple analytes in a single sample saves time and resources.
  • 12.
    Median Fluorescence Intensity(MFI) MFI is how Luminex results are read out. 1.Fluorescence Measurement: 1. The fluorescence intensity of PE on each bead is measured. 2. The intensity reflects the quantity of the analyte captured on that bead. 2.Median Calculation: 1. For each bead set (specific analyte), the fluorescence intensity is measured for numerous beads. 2. The median value of these fluorescence intensities is calculated. 3. The median, rather than the mean, is used to reduce the impact of outliers and provide a more robust measure of central tendency. 3.Interpreting MFI: 1. MFI is directly proportional to the concentration of the analyte in the sample. 2. Higher MFI values indicate higher concentrations of the target analyte. 4.Standard Curves and Quantification: 1. Standard curves are generated using known concentrations of the analyte. 2. The MFI values from the samples are compared to the standard curve to quantify the analyte concentration.
  • 13.
    Typical Bead Countper Analyte 1.Minimum Bead Count: 1. Most Luminex instruments and assays are designed to use at least 50 to 100 beads per analyte to ensure robust statistical analysis. 2. This count provides a sufficient sample size to calculate a reliable median value and reduces the impact of any potential outliers. 2.Optimal Bead Count: 1. For higher precision and reliability, many assays use around 100 to 200 beads per analyte. 2. This range ensures a good representation of the population of beads, allowing for more accurate median calculations. 3.High Throughput and Variability: 1. In high-throughput settings or assays with more variability, using even more beads (up to several hundred) per analyte might be preferred to enhance data robustness.
  • 14.
    How do wecorrelate fluorescence intensity to actual level of antigen/antibody? • The correlation of fluorescence intensity to the actual level of antigen or antibody in a Luminex immunoassay involves generating a standard curve using known concentrations of the target analyte • 1) after preparing a series of standard solutions with known concentrations (using serial dilution methods) of target antigen/antibody. • 2) run Luminex assay on each solutions and measure fluorescence intensity (FI) • 3) plot FI against different concentration to generate standard curve
  • 16.
    Mean Fluorescence Intensity(MFI) cut offs Baranwal et al. Comparative analysis of Luminex-based donor-specific antibody mean fluorescence intensity values with complement-dependent cytotoxicity & flow crossmatch results in live donor renal transplantation. Indian J Med Res. 2017 Feb
  • 26.
    Conclusion • 60 yearshave passed since the introduction of complement-dependent cytotoxicity (CDC) as the first technique for the detection of HLA antibodies in recipients before undergoing renal transplantation. • Methodologies to detect HLA antibodies have progressed from purely target donor cell-based assays, such as CDC or flow cytometry to the more sensitive and specific HLA protein-based solid-phase assay systems in the form of an enzyme-linked immunosorbent assay (ELISA) or HLA antigen-coated fluorescence bead assay based on a Luminex platform. • In Luminex, the mean fluorescence intensity (MFI) is a measure of the degree of saturation of total antigens present on the beads by antibodies and is used as a surrogate marker for the level of antibody titres. • Currently, there is a lack of consensus with regard to the optimum MFI cut-offs for classifying antibodies as positive or those that are significant.
  • 27.

Editor's Notes

  • #3 For transplant matching purposes, we focus on HLA – A, B, DR A and B are class 1, -DR is class 2
  • #4 HLA sits on short arm of chromosome 6 Each person has 2 alleles for each HLA antigens (1 from each parent), and we learnt that there are 3 important antigens (A, B, DR) on each allele, making 6 antigens to match in total. Hence why we have mismatches out of 6!
  • #5 HLA- Locus ∗Group :Subgroup Locus: The specific HLA gene (e.g., HLA-A, HLA-B, HLA-C). Group: The allele group (e.g., 02 in HLA-A*02). Subgroup: The specific allele within the group (e.g., 01 in HLA-A*02:01).
  • #7 The key advantage of a sandwich ELISA is its high sensitivity; it is 2-5 times more sensitive than direct or indirect ELISAs. Sandwich ELISA also delivers high specificity as two antibodies are used to detect the antigen.
  • #15 Curve Fitting: Apply a suitable curve-fitting method to the plotted data. Commonly used methods include: Linear Regression: Suitable for assays with a linear response range. Log-Log or Semi-Log: Useful for assays with a wide dynamic range. Five-Parameter Logistic (5PL) or Four-Parameter Logistic (4PL): These nonlinear regression models are often used for immunoassays due to their ability to fit a wide range of standard curves with high accuracy. The 4PL model is a symmetric sigmoid function used to fit data that follows a sigmoidal dose-response curve. The 5PL model extends the 4PL model by adding an asymmetry factor, making it useful for fitting data that does not symmetrically approach the upper and lower asymptotes.
  • #16 Currently, there is a lack of consensus with regard to the optimum MFI cut-offs for classifying antibodies as positive or those that are significant. Our results indicated that Luminex-based single antigen MFI cut-off of 3000 significantly correlated with FCXM positivity while a MFI value of 7000 and above was predictive of a positive CDC crossmatch. Although the numbers were small, an almost 100 per cent concordance reached between the two techniques i.e., CDC and Luminex-based SAB for the MFI values <3000 and >7000. Our results were consistent with those of others10,16. In fact, the latter group of investigators reported that in their experience, all CDC-positive crossmatches had a MFI value of >6000, but not all serum samples with high MFI were positive for CDC. They attributed this finding to the possible presence of non-complement-fixing antibodies. In our study also a similar case was seen in whom the CDC crossmatch was negative despite having DSA with MFI value of 9986. We found this to be due to the presence of non-complement-fixing antibodies by performing Luminex-based C1q assay for the detection of complement-fixing anti-HLA antibodies (C1qScreen, One Lambda). In the study by Ellis et al16, no such test was performed to confirm the presence of non-complement-fixing nature of antibodies.
  • #17 Left, cellular testing. Positive crossmatch result in cells being discharged Mid, flow cytometry can look for fluorescein labelled cells Right, now use beads as surrogate for cells. All asks the question “Does the recipient serum contain antibody to the donor lymphocytes?”
  • #18 So we covered how does Luminex work in a microscopic level, how is it done practically and what are its advantages/disadvantages?