Download to read offline

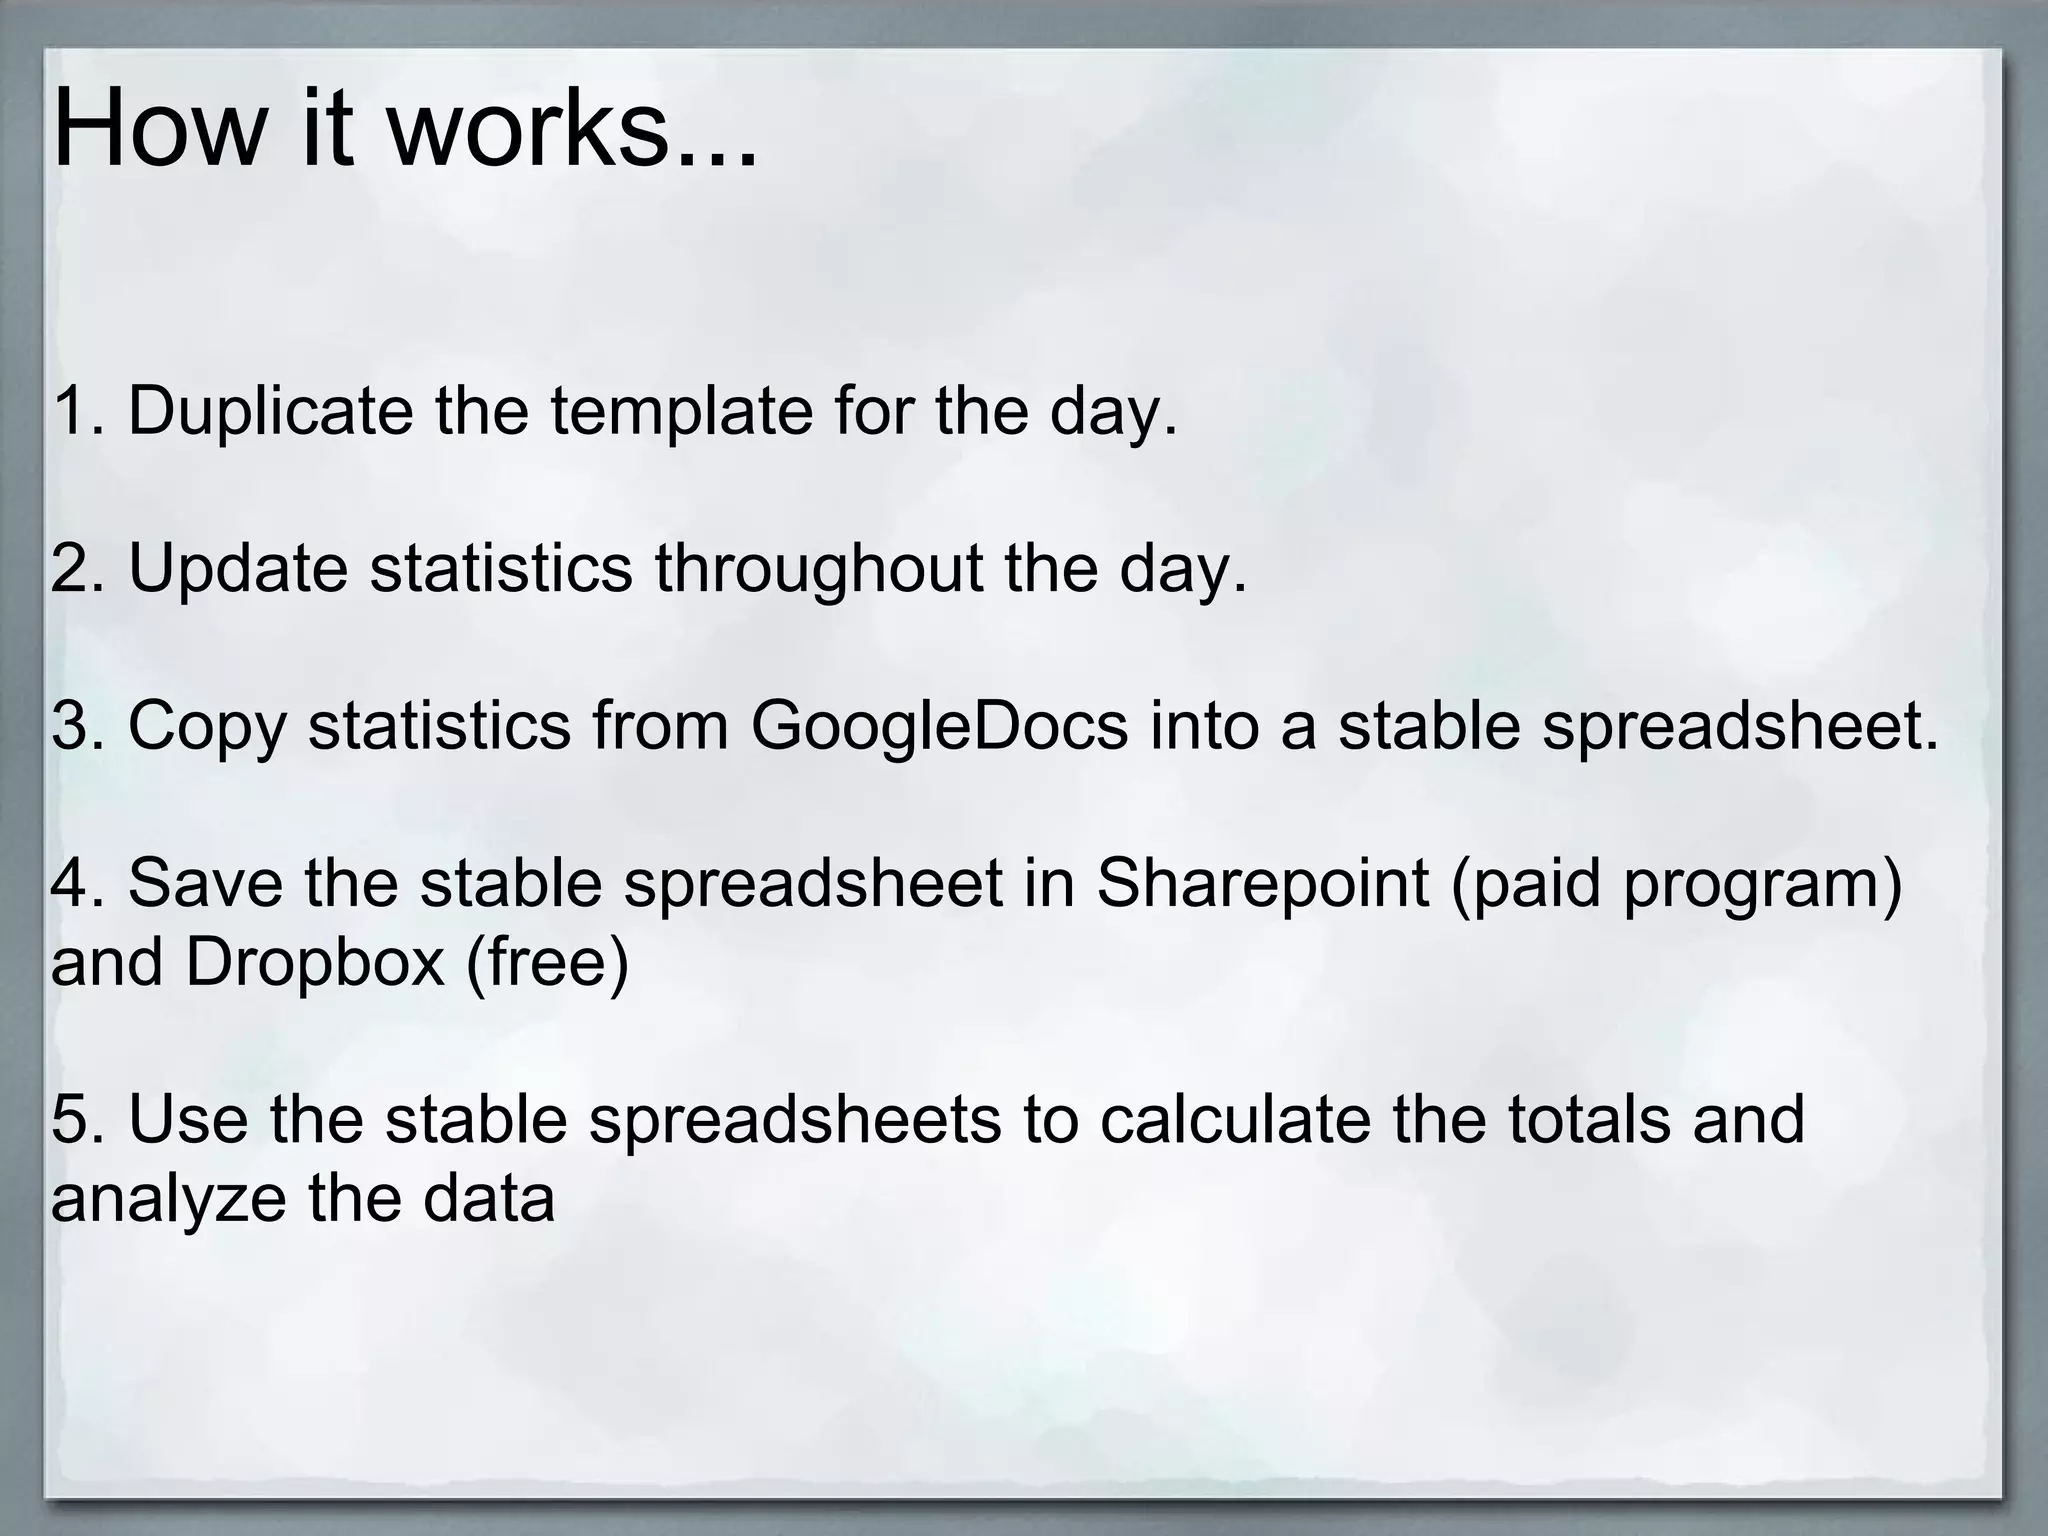
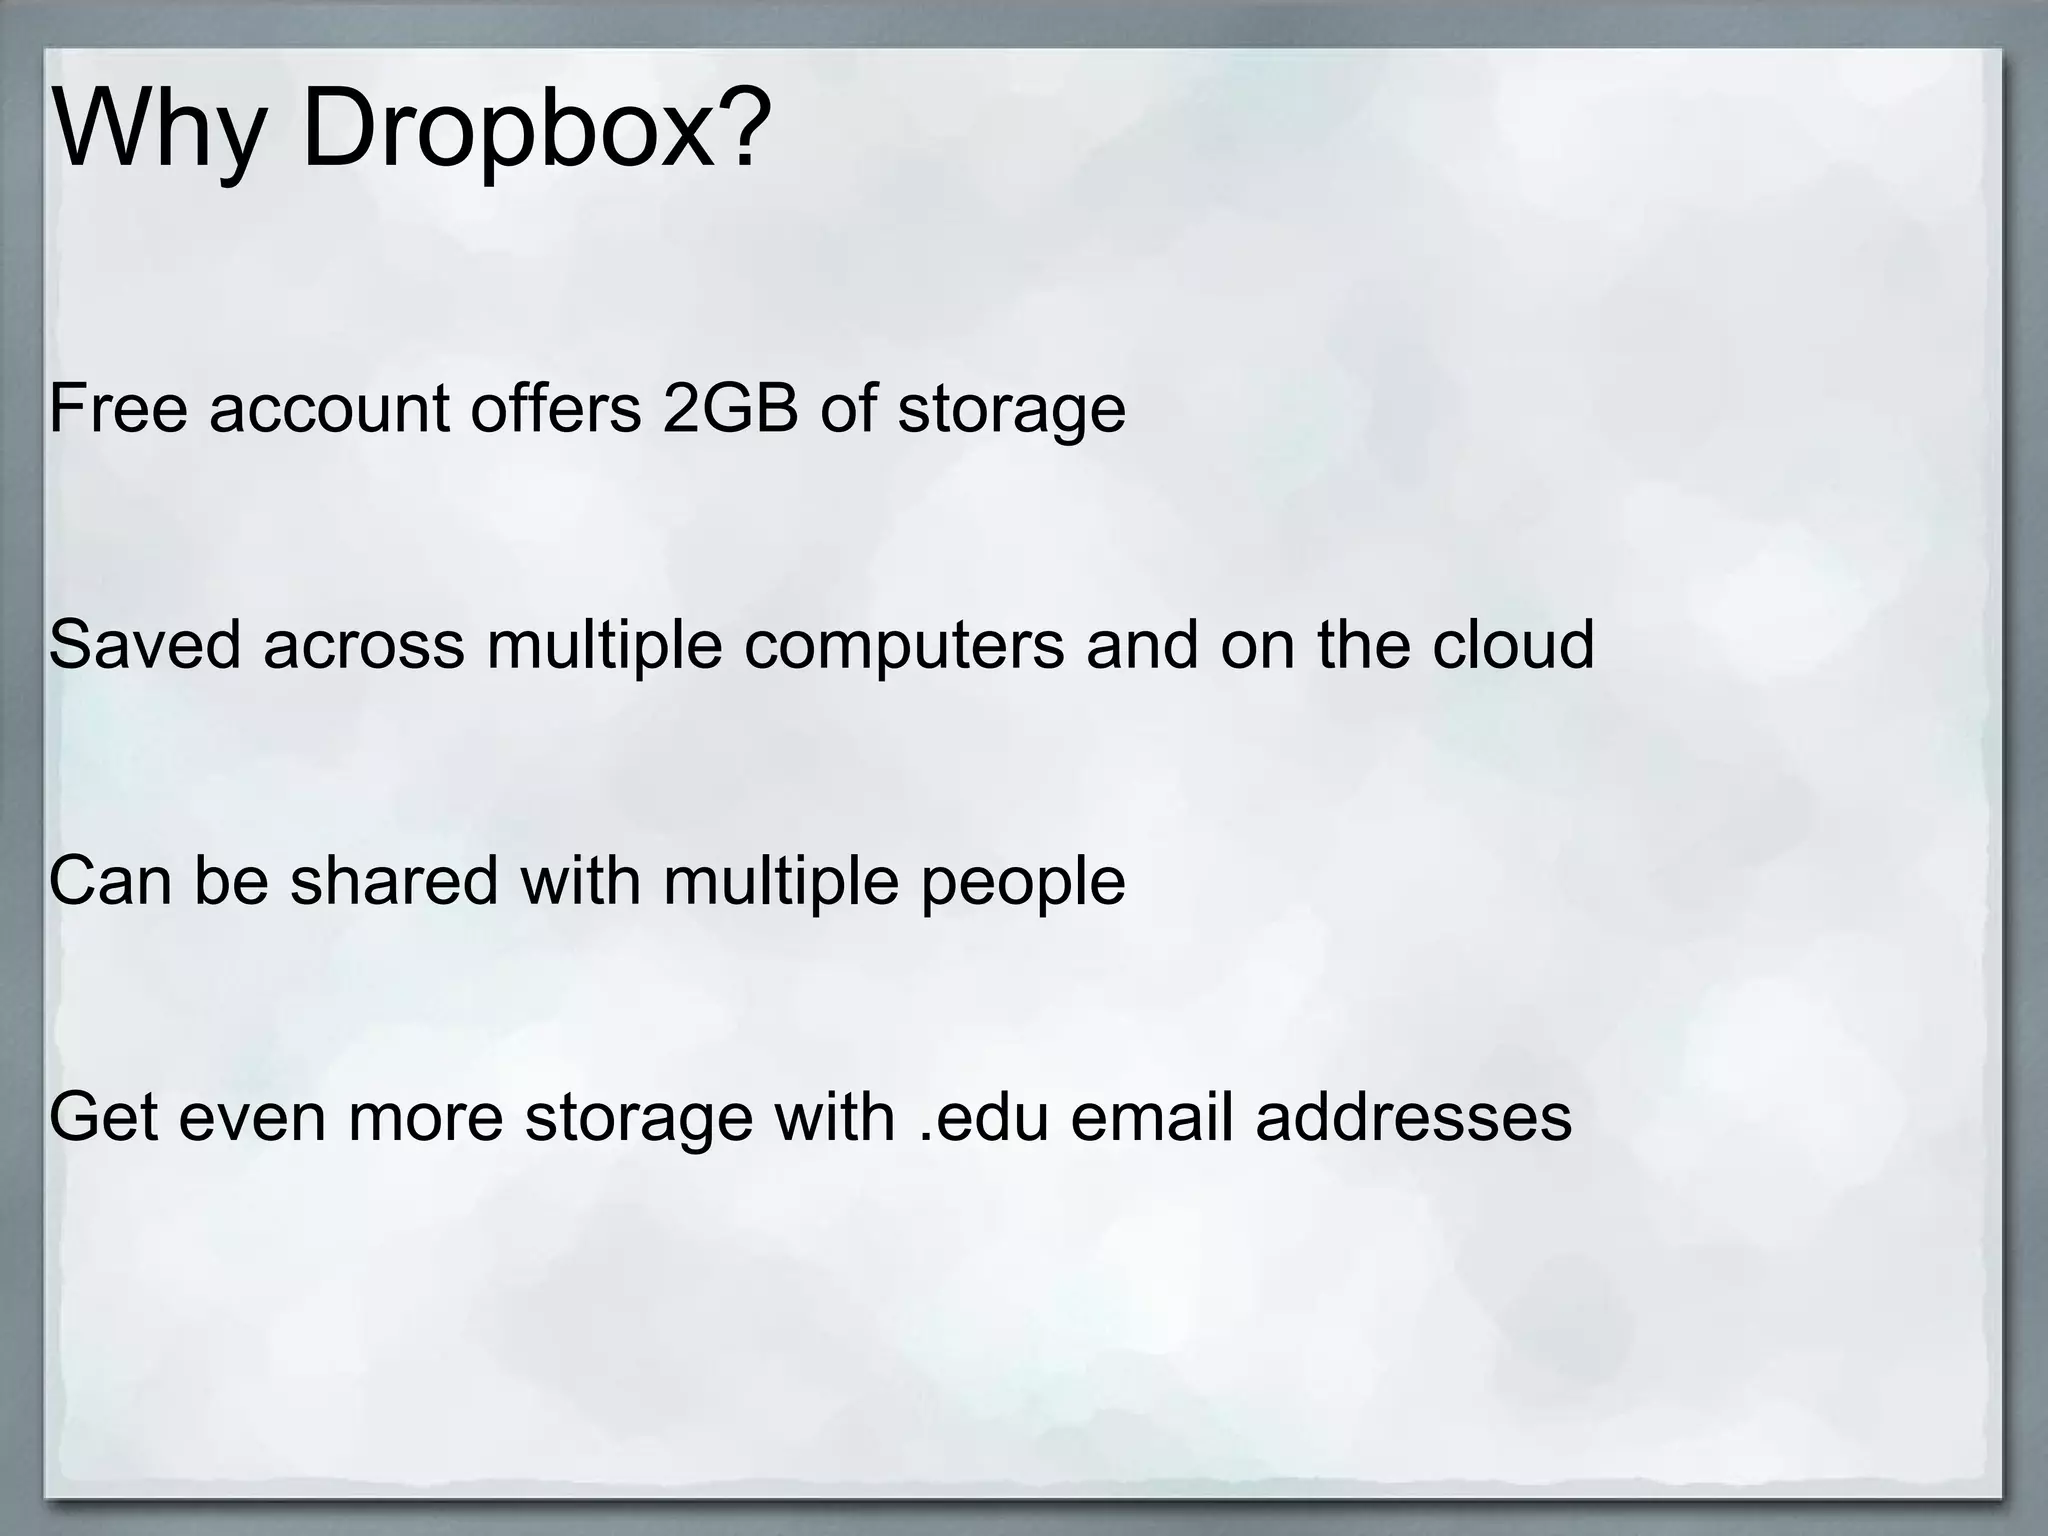
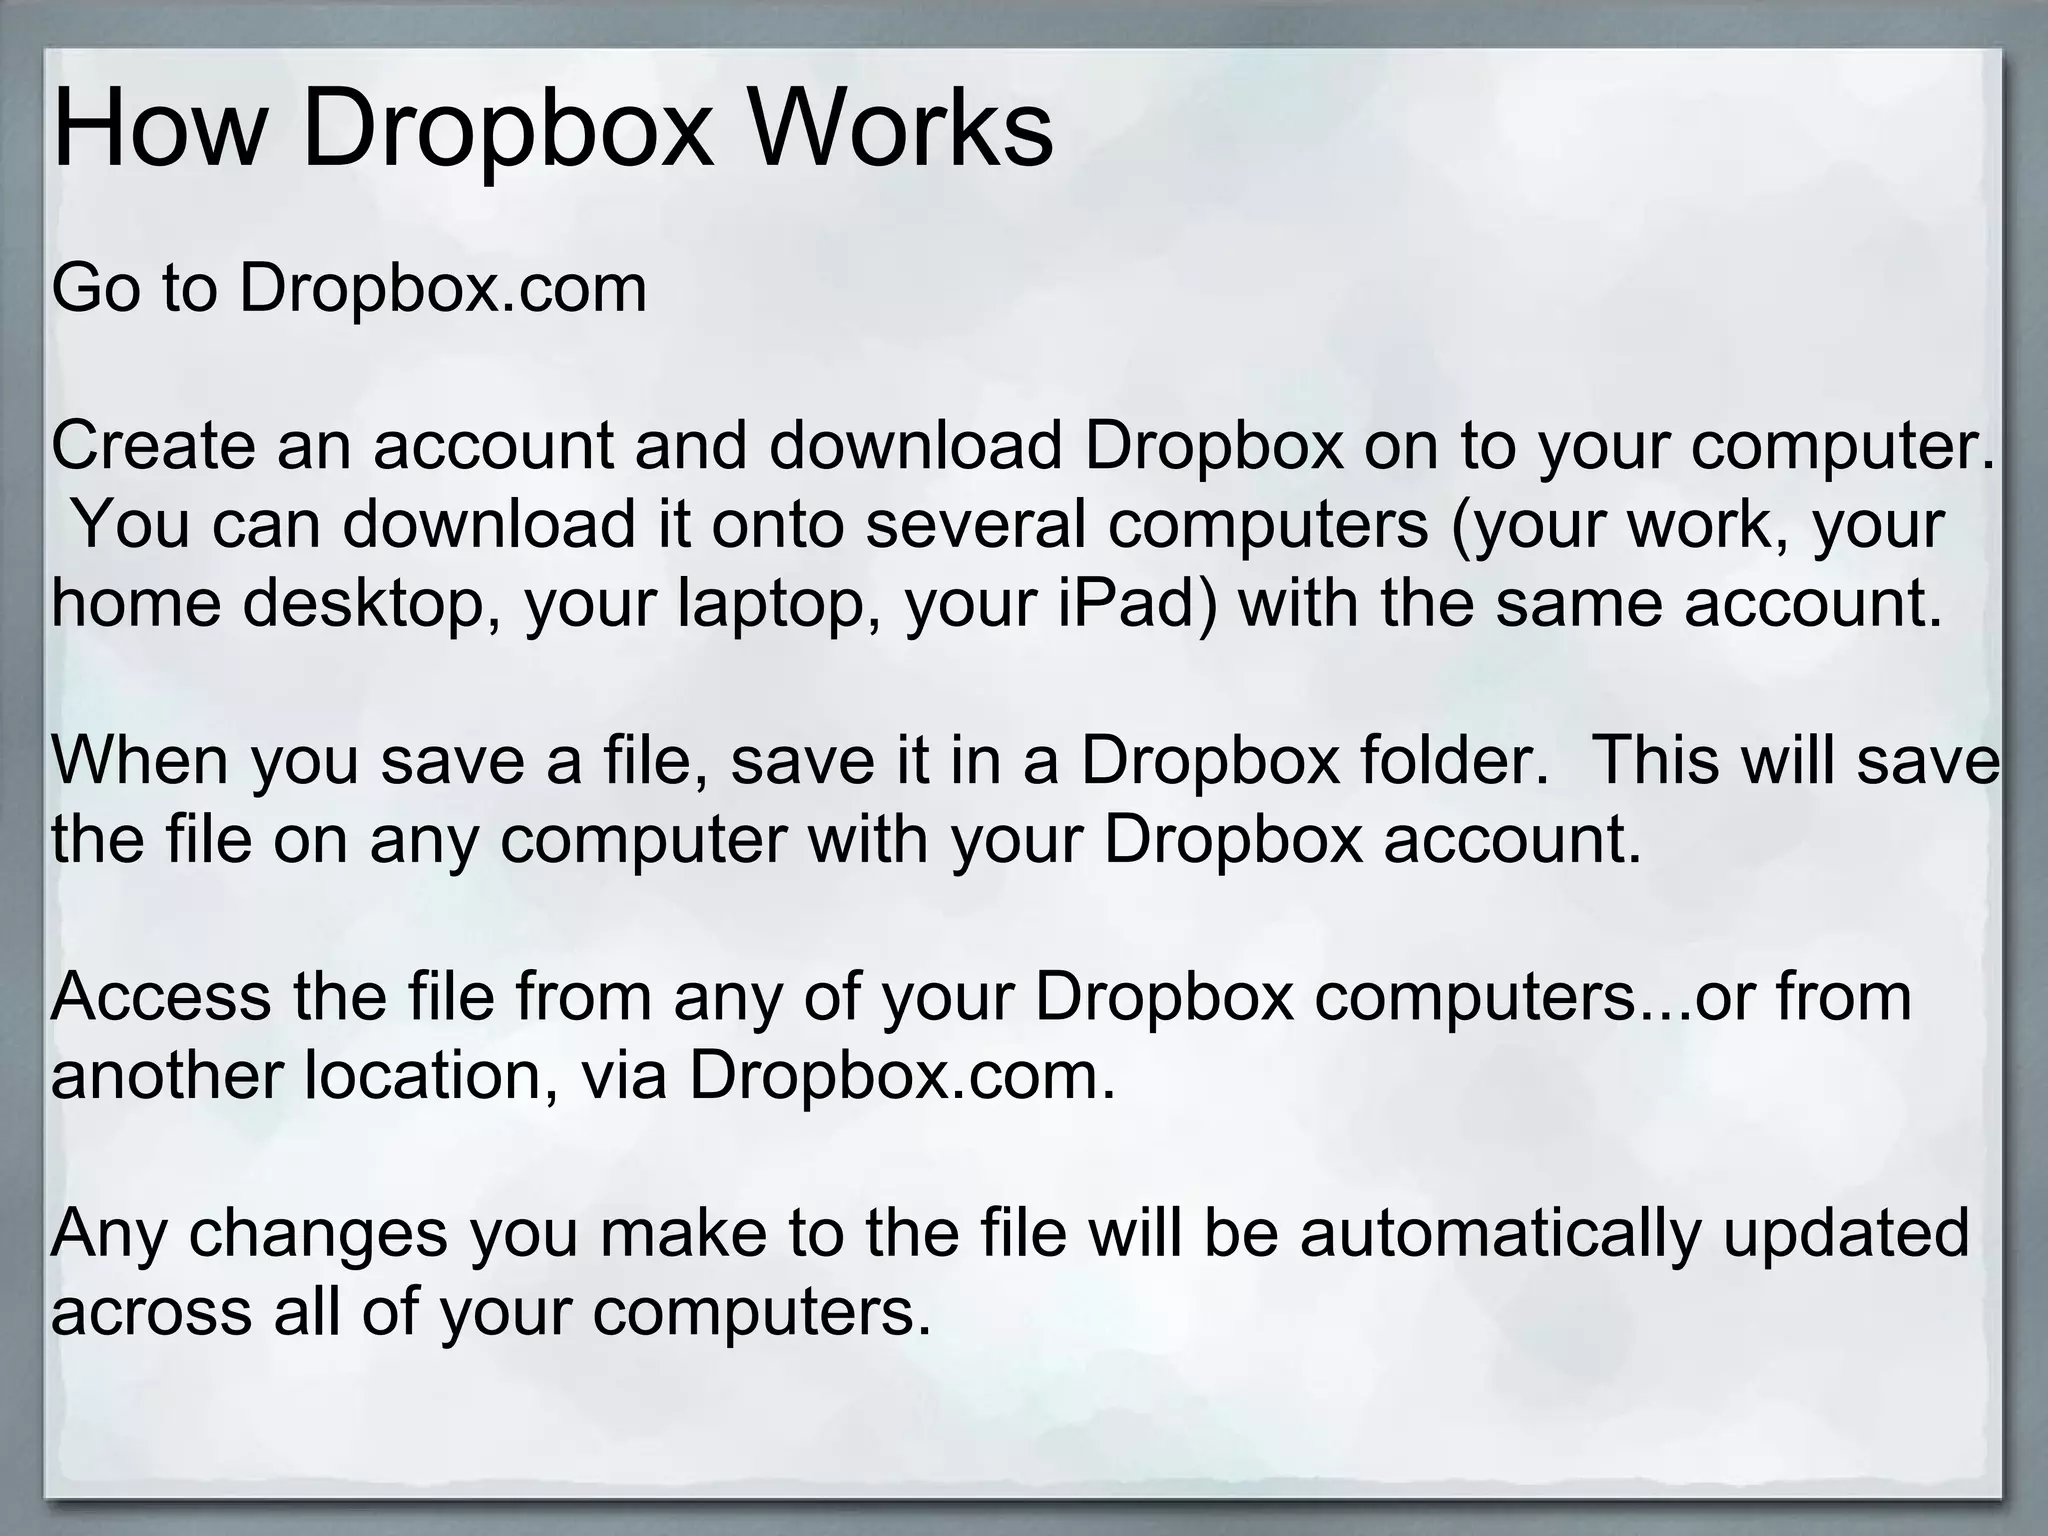

This document discusses using Google Docs and Dropbox to easily compile and analyze reference statistics from multiple locations. Originally, reference statistics were tracked using printouts that were messy and incomplete. Google Docs provides a digital alternative that allows real-time collaboration and updating from any location. Statistics are compiled in Google Docs and then copied to a stable spreadsheet saved in SharePoint and Dropbox for long-term analysis. The benefits of these tools include accessibility, collaboration, and free storage.


