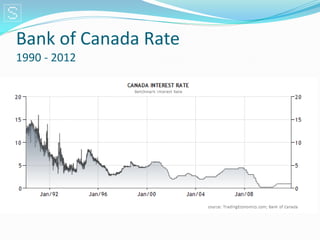
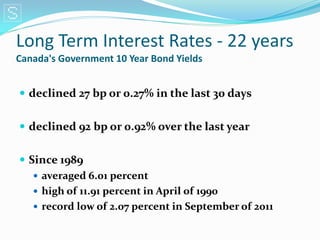
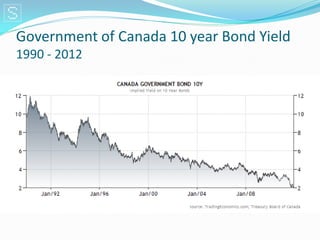
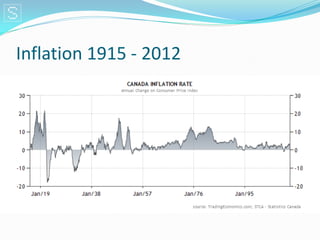
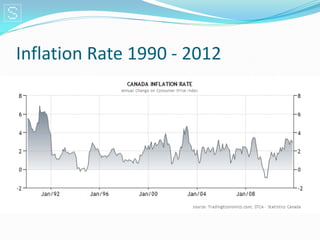
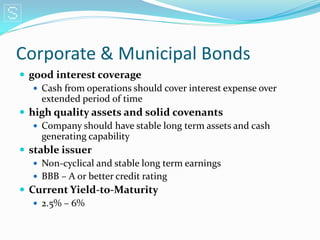
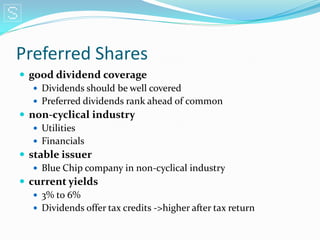
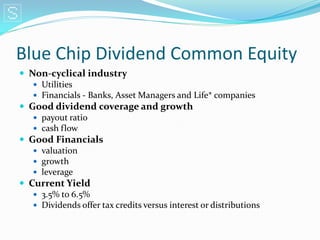
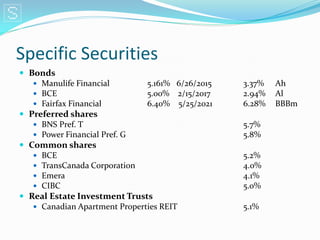
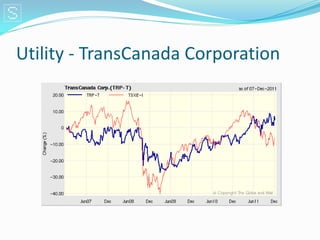
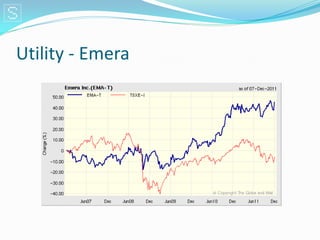
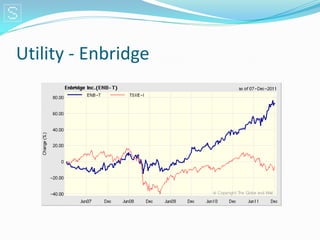
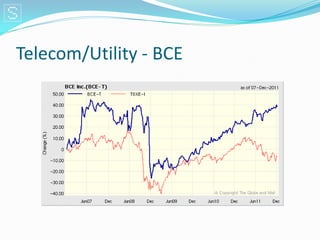
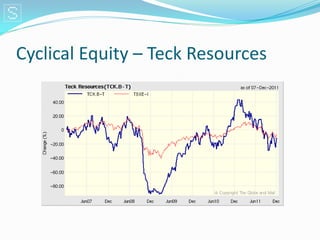
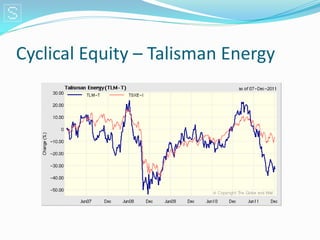
by
Albrecht Weller, CFA
          President
       December 8, 2011
Disclosure Statement

Schwaben Capital Group Limited (SCGL) maintains a Portfolio Management
and Exempt Market Dealer license in Ontario. This website does not
constitute an offer or solicitation to residents of the US or the UK, or to
anyone in any jurisdiction in which such an offer or solicitation is not
authorized or to any person to whom it is unlawful to make such a
solicitation. The content of the web pages of the SCGL site are for
information purposes only unless there is a specific indication to the
contrary. The content does not constitute an offer to sell or purchase
securities by or from SCGL or any of its affiliates or authorised third parties.
The services of SCGL are only available to residents or residences where
SCGL may legally operate. Canadian residents residing in provinces where
they can be legally offered. These services are subject to the conditions
defined in each individual applicable agreement. The content of these web
pages are the exclusive property of SCGL and cannot be reproduced in whole
or in part without the express consent of SCGL except for your personal use.
Bank of Canada Rate
1990 - 2012
Long Term Interest Rates - 22 years
Canada's Government 10 Year Bond Yields


 declined 27 bp or 0.27% in the last 30 days


 declined 92 bp or 0.92% over the last year


 Since 1989
    averaged 6.01 percent
    high of 11.91 percent in April of 1990
    record low of 2.07 percent in September of 2011
Government of Canada 10 year Bond Yield
1990 - 2012
The inflation rate in Canada
 2.9 % in October, 2011


 From 1915 until 2010, the average of 3.26 %


 high of 21.60 percent in June, 1920


 record low of -17.80 percent in June, 1921
Inflation 1915 - 2012
Inflation Rate 1990 - 2012
Alternatives to Government Bonds
 Corporate & Municipal Bonds
    Utilities
    Banks & Life Insurance
    Stable Blue Chips
 Preferred Shares
    Utilities
    Banks & Life companies
 Blue Chip dividend paying common shares
    Utilities
    Financial -> Banks
    Non- resource / non-cyclicals
 Stable Real Estate Investment Trust
    Residential
    Office Properties
Corporate & Municipal Bonds
 good interest coverage
    Cash from operations should cover interest expense over
     extended period of time
 high quality assets and solid covenants
    Company should have stable long term assets and cash
     generating capability
 stable issuer
    Non-cyclical and stable long term earnings
    BBB – A or better credit rating
 Current Yield-to-Maturity
    2.5% – 6%
Preferred Shares
 good dividend coverage
    Dividends should be well covered
    Preferred dividends rank ahead of common
 non-cyclical industry
    Utilities
    Financials
 stable issuer
    Blue Chip company in non-cyclical industry
 current yields
    3% to 6%
    Dividends offer tax credits ->higher after tax return
Blue Chip Dividend Common Equity
 Non-cyclical industry
    Utilities
    Financials - Banks, Asset Managers and Life* companies
 Good dividend coverage and growth
    payout ratio
    cash flow
 Good Financials
    valuation
    growth
    leverage
 Current Yield
    3.5% to 6.5%
    Dividends offer tax credits versus interest or distributions
Real Estate Investment Trusts
 non-cyclical holdings
    Apartment building
    Office properties
 geographically diversified
    Intercity and interprovincial
 stable distributions
    Long term and blue chip leases
    Leases are only as good as tenants
 modestly depreciating assets
    Prefer older renovated over new
 Current yields
    3.5% to 6.5%
    Higher distributions may not be covered and sustainable
Specific Securities
 Bonds
    Manulife Financial        5.161% 6/26/2015   3.37%   Ah
    BCE                       5.00% 2/15/2017    2.94%   Al
    Fairfax Financial         6.40% 5/25/2021    6.28%   BBBm
 Preferred shares
    BNS Pref. T                                  5.7%
    Power Financial Pref. G                      5.8%
 Common shares
    BCE                                          5.2%
    TransCanada Corporation                      4.0%
    Emera                                        4.1%
    CIBC                                         5.0%
 Real Estate Investment Trusts
    Canadian Apartment Properties REIT           5.1%
Non-cyclical / Counter-cyclical
 Generally Utilities


 Price movements reduce portfolio volatility
    Desirable portfolio attribute


 Over the long run improves portfolio return especially
  on a risk adjusted basis
Utility - TransCanada Corporation
Utility - Emera
Utility - Enbridge
Telecom/Utility - BCE
In Contrast – cyclical equities
less desirable
 Generally resource based stocks


 Increases rather than reduces portfolio volatility
   Undesirable


 Does not necessarily add to portfolio return
   It takes a 100% positive return to alleviate a 50% loss
Cyclical Equity – Teck Resources
Cyclical Equity – Talisman Energy
Schwaben Capital Group Limited
    161 Bay Street, 27th Floor
     Toronto ON M8V 3W9
           416.572.2265
         www.schwaben.ca
   SchwabenCapital.wordpress.com

Low interest rate investing 1.51

  • 1.
    by Albrecht Weller, CFA President December 8, 2011
  • 2.
    Disclosure Statement Schwaben CapitalGroup Limited (SCGL) maintains a Portfolio Management and Exempt Market Dealer license in Ontario. This website does not constitute an offer or solicitation to residents of the US or the UK, or to anyone in any jurisdiction in which such an offer or solicitation is not authorized or to any person to whom it is unlawful to make such a solicitation. The content of the web pages of the SCGL site are for information purposes only unless there is a specific indication to the contrary. The content does not constitute an offer to sell or purchase securities by or from SCGL or any of its affiliates or authorised third parties. The services of SCGL are only available to residents or residences where SCGL may legally operate. Canadian residents residing in provinces where they can be legally offered. These services are subject to the conditions defined in each individual applicable agreement. The content of these web pages are the exclusive property of SCGL and cannot be reproduced in whole or in part without the express consent of SCGL except for your personal use.
  • 3.
    Bank of CanadaRate 1990 - 2012
  • 4.
    Long Term InterestRates - 22 years Canada's Government 10 Year Bond Yields  declined 27 bp or 0.27% in the last 30 days  declined 92 bp or 0.92% over the last year  Since 1989  averaged 6.01 percent  high of 11.91 percent in April of 1990  record low of 2.07 percent in September of 2011
  • 5.
    Government of Canada10 year Bond Yield 1990 - 2012
  • 6.
    The inflation ratein Canada  2.9 % in October, 2011  From 1915 until 2010, the average of 3.26 %  high of 21.60 percent in June, 1920  record low of -17.80 percent in June, 1921
  • 7.
  • 8.
  • 9.
    Alternatives to GovernmentBonds  Corporate & Municipal Bonds  Utilities  Banks & Life Insurance  Stable Blue Chips  Preferred Shares  Utilities  Banks & Life companies  Blue Chip dividend paying common shares  Utilities  Financial -> Banks  Non- resource / non-cyclicals  Stable Real Estate Investment Trust  Residential  Office Properties
  • 10.
    Corporate & MunicipalBonds  good interest coverage  Cash from operations should cover interest expense over extended period of time  high quality assets and solid covenants  Company should have stable long term assets and cash generating capability  stable issuer  Non-cyclical and stable long term earnings  BBB – A or better credit rating  Current Yield-to-Maturity  2.5% – 6%
  • 11.
    Preferred Shares  gooddividend coverage  Dividends should be well covered  Preferred dividends rank ahead of common  non-cyclical industry  Utilities  Financials  stable issuer  Blue Chip company in non-cyclical industry  current yields  3% to 6%  Dividends offer tax credits ->higher after tax return
  • 12.
    Blue Chip DividendCommon Equity  Non-cyclical industry  Utilities  Financials - Banks, Asset Managers and Life* companies  Good dividend coverage and growth  payout ratio  cash flow  Good Financials  valuation  growth  leverage  Current Yield  3.5% to 6.5%  Dividends offer tax credits versus interest or distributions
  • 13.
    Real Estate InvestmentTrusts  non-cyclical holdings  Apartment building  Office properties  geographically diversified  Intercity and interprovincial  stable distributions  Long term and blue chip leases  Leases are only as good as tenants  modestly depreciating assets  Prefer older renovated over new  Current yields  3.5% to 6.5%  Higher distributions may not be covered and sustainable
  • 14.
    Specific Securities  Bonds  Manulife Financial 5.161% 6/26/2015 3.37% Ah  BCE 5.00% 2/15/2017 2.94% Al  Fairfax Financial 6.40% 5/25/2021 6.28% BBBm  Preferred shares  BNS Pref. T 5.7%  Power Financial Pref. G 5.8%  Common shares  BCE 5.2%  TransCanada Corporation 4.0%  Emera 4.1%  CIBC 5.0%  Real Estate Investment Trusts  Canadian Apartment Properties REIT 5.1%
  • 15.
    Non-cyclical / Counter-cyclical Generally Utilities  Price movements reduce portfolio volatility  Desirable portfolio attribute  Over the long run improves portfolio return especially on a risk adjusted basis
  • 16.
  • 17.
  • 18.
  • 19.
  • 20.
    In Contrast –cyclical equities less desirable  Generally resource based stocks  Increases rather than reduces portfolio volatility  Undesirable  Does not necessarily add to portfolio return  It takes a 100% positive return to alleviate a 50% loss
  • 21.
    Cyclical Equity –Teck Resources
  • 22.
    Cyclical Equity –Talisman Energy
  • 23.
    Schwaben Capital GroupLimited 161 Bay Street, 27th Floor Toronto ON M8V 3W9 416.572.2265 www.schwaben.ca SchwabenCapital.wordpress.com

Editor's Notes

  • #14 - Types of property held (apartment buildings, golf courses, shopping malls, mortgages, etc)- Concentration of location (big cities, small cities, overheated market?)- Stability of distribution (this is what we are looking for, right?)- Level of depreciation of assets (in Canada, we call it amortization. It is important to understand the accounting distortion when looking at financial statements)