North Village Private Equity Case Analysis
•
2 likes•2,895 views

The aim of the project was to act on behalf of North Village Capital's Investment Committee and discuss the various financing options of a proposed buyout investment in "AlarmServe." - Built a LBO Analysis to understand the impact of leverage on the investment - Ran a covenant stress test using the LBO model to find the appropriate financing structure - Recommended investment committee to purchase AlarmServe at moderate leverage with potential IRR of 23.4% in five years. - Received full marks on case analysis

Recommended
Recommended
More Related Content
What's hot
What's hot (20)
Similar to North Village Private Equity Case Analysis
Similar to North Village Private Equity Case Analysis (20)
Recently uploaded
Recently uploaded (20)
North Village Private Equity Case Analysis
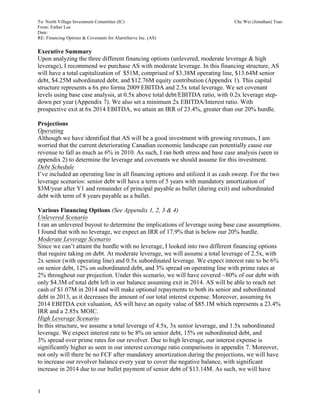
- 1. To: North Village Investment Committee (IC) Che Wei (Jonathan) Tsao From: Esther Lee Date: RE: Financing Options & Covenants for AlarmServe Inc. (AS) 1 Executive Summary Upon analyzing the three different financing options (unlevered, moderate leverage & high leverage), I recommend we purchase AS with moderate leverage. In this financing structure, AS will have a total capitalization of $51M, comprised of $3.38M operating line, $13.64M senior debt, $4.25M subordinated debt, and $12.76M equity contribution (Appendix 1). This capital structure represents a 6x pro forma 2009 EBITDA and 2.5x total leverage. We set covenant levels using base case analysis, at 0.5x above total debt/EBITDA ratio, with 0.2x leverage step- down per year (Appendix 7). We also set a minimum 2x EBITDA/Interest ratio. With prospective exit at 6x 2014 EBITDA, we attain an IRR of 23.4%, greater than our 20% hurdle. Projections Operating Although we have identified that AS will be a good investment with growing revenues, I am worried that the current deteriorating Canadian economic landscape can potentially cause our revenue to fall as much as 6% in 2010. As such, I ran both stress and base case analysis (seen in appendix 2) to determine the leverage and covenants we should assume for this investment. Debt Schedule I’ve included an operating line in all financing options and utilized it as cash sweep. For the two leverage scenarios: senior debt will have a term of 5 years with mandatory amortization of $3M/year after Y1 and remainder of principal payable as bullet (during exit) and subordinated debt with term of 8 years payable as a bullet. Various Financing Options (See Appendix 1, 2, 3 & 4) Unlevered Scenario I ran an unlevered buyout to determine the implications of leverage using base case assumptions. I found that with no leverage, we expect an IRR of 17.9% that is below our 20% hurdle. Moderate Leverage Scenario Since we can’t attaint the hurdle with no leverage, I looked into two different financing options that require taking on debt. At moderate leverage, we will assume a total leverage of 2.5x, with 2x senior (with operating line) and 0.5x subordinated leverage. We expect interest rate to be 6% on senior debt, 12% on subordinated debt, and 3% spread on operating line with prime rates at 2% throughout our projection. Under this scenario, we will have covered ~80% of our debt with only $4.3M of total debt left in our balance assuming exit in 2014. AS will be able to reach net cash of $1.07M in 2014 and will make optional repayments to both its senior and subordinated debt in 2013, as it decreases the amount of our total interest expense. Moreover, assuming 6x 2014 EBITDA exit valuation, AS will have an equity value of $85.1M which represents a 23.4% IRR and a 2.85x MOIC. High Leverage Scenario In this structure, we assume a total leverage of 4.5x, 3x senior leverage, and 1.5x subordinated leverage. We expect interest rate to be 8% on senior debt, 15% on subordinated debt, and 3% spread over prime rates for our revolver. Due to high leverage, our interest expense is significantly higher as seen in our interest coverage ratio comparisons in appendix 7. Moreover, not only will there be no FCF after mandatory amortization during the projections, we will have to increase our revolver balance every year to cover the negative balance, with significant increase in 2014 due to our bullet payment of senior debt of $13.14M. As such, we will have
- 2. 2 only covered ~14% of our total debt with $33.3M of total debt left in balance during exit. However, due to a much lower initial equity contribution of $12.76M, AS will have an equity value of $55M at exit that represents a 33.9% IRR and a 4.3x MOIC. Covenants (see Appendix 5, 6 & 7) As both leverage scenarios exceed our hurdle, I set up covenants at 0.5x over base case analysis with 0.2x step down per year for Total Debt/EBITDA ratio and a minimum 2.0x interest coverage ratio for all periods. I ran a covenant stress test to see which financing structure will survive the stress case assumptions. Debt/EBITDA Moderate Leverage: I set initial debt/EBITDA ratio covenant at 2.4x with 0.2x step down per year. Upon running a stress test, I found that we would breach covenant in the first three years of projections. However, as we aren’t amortizing our senior debt until year 2 of projections, our debt levels will be relatively unchanged until 2011. Moreover, since we projected 2010 revenues to fall by 6%, our EBITDA will only recover to pre-2010 levels in 2012. As such, we will meet covenant in 2013 and 2014, as revenue growth and EBITDA margins start to stabilize. It should also be noted that none of the covenants would be breached if we only measured the ratio for senior debts, as no mandatory amortization is required for the subordinated loans. High Leverage: I set initial covenant at 4.2x with 0.2x step down per year. In this leverage scenario, I found that all covenants are breached due to the reduction of EBITDA in 2010. As such, it seems like the chances of a high leverage buyout is unlikely. EBITDA/Total Interest Moderate Leverage: Even with a 6% drop in revenue in 2010 and lower gross margin, our EBITDA levels remain high enough through the projections to maintain over 2x interest coverage ratio. In fact, I also looked at EBITDA(less Capex)/Interest Expense and EBITDA(less Capex & change in NWC)/Interest Expense, and I found that covenant levels will only drop below our 2.0x minimum in 2010 & 2011. As EBITDA margins and revenue growth begin to stabilize in 2013, all minimum interest coverage ratios will be met. High Leverage: Since we are taking on significantly more debt, we are naturally incurring a much higher interest expense. As such, we are unable to meet the 2x EBITDA/interest covenant during 2010 & 2011 even in our base case analysis. Nevertheless, since the interest coverage ratio for 2010 & 2011 is not far off the 2x covenant level, I believe our sponsors will be willing to accept a lower covenant level during those years. Regardless, after stress test, we find that all covenants are breached except in 2014 since only senior debt is amortized while we continue to withdraw money from our operating line while subordinated debt remains the same. Recommendation I recommend our IC to purchase AS with moderate leverage, as it will generate 23.4% IRR. I rejected the high leverage buyout, as AS won’t be able to cover the high interest expense at expected covenant levels especially if we see revenues to drop in 2010. Moreover, even in base case analysis, we never reach net cash and will have to draw from our operating line every year to remain solvent. However, I understand that we still breach Debt/EBITDA covenants with moderate leverage from 2010 to 2012. As such, I recommend negotiating for higher debt covenant levels, starting at 3x (0.5x over buyout debt levels) with 0.2x step down, as we aren't amortizing the senior debt until 2011. With higher covenant levels, we expect the strong growth prospects of AS to hedge against economic risks while yielding great returns.
- 3. 3 Cash Flow Analysis 2010E 2011E 2012E 2013E 2014E Operating Activities Net Income 3.24 4.00 4.86 5.82 6.85 Depreciation 3.33 3.53 3.73 3.94 4.15 Chg Net WC 0.08- 0.22- 0.23- 0.24- 0.25- Cash from Ops 6.49 7.31 8.36 9.52 10.75 Investing Activities CAPEX 4.41- 4.63- 4.86- 5.10- 5.35- Financing Activities Change in Revolver 2.08- 0.32 0.50- 1.11- - Change in Senior Debt - 3.00- 3.00- 3.31- 4.33- Change in Subordinated Debt Cash Flow from Financing 2.08- 2.68- 3.50- 4.42- 4.33- Beg Cash - 0.00 0.00- 0.00- 0.00 Net Change 0.00 0.00 0.00- 0.00 1.07 Ending Cash 0.00 0.00 0.00- 0.00 1.07 Appendix 1: Purchase Analysis Appendix 2: Scenario Analysis Appendix 3: Base Case Moderate Leverage – Cash Flow Analysis & Debt Schedule Purchase Analysis Unlevered Moderate High 2 2009 EBITDA $8.5 Senior Leverage 1.60 x EBITDA Sources of Funds 1 2 3 EBITDA Multiple 6.0x Term 5 years Revolving Credit Facility Size 3.38 3.38 3.38 EV $51.0 Sub Debt Leverage 0.5 x EBITDA Revolving Credit Facility Draw 3.38 3.38 3.38 Less: Existing Debt $5.0 Senior Debt - 13.64 22.14 Implied Equity Purchase Price $46.0 Interest Rates Subordinated Debt - 4.25 12.76 Revolver 5% Equity Contribution 47.7 29.77 12.76 Senior Loan 6% Total Sources 51.03 51.03 51.03 Purchase Price $51.0 Mandatory Repayment 22% 17.011192 25.516788 Less: Existing Debt 5.00- Subordinated Loan 12% Use of Funds Plus: Exisiting Cash - Equity Purchase Price $46.0 $46.0 $46.0 Equity Offer Value 46 Bank Operating Line Coverage Repay Existing Bank Debt 5 5 5 Existing Goodwill - A/R 75% Total Use $51.0 $51.0 $51.0 Less: Book Value Acquired 17.30 Inv. 50% New Goodwill 28.73 Financing Structure TRANSACTION ASSUMPTIONS Goodwill Calculation Leverage Assumption Scenario Analysis - IS & CF Assumptions 1 Base 1 Sales Growth % 5% 5% 5% 5% 5% GM % 78% 78% 78% 78% 78% CAPEX (% of Sales) 13% 13% 13% 13% 13% Stress Case 2 Sales Growth % -6% 3% 3% 3% 5% GM % 75% 75% 76% 77% 78% CAPEX (% of Sales) 13% 13% 13% 13% 13% Debt Schedule 2009 Adj. 2009PF 2010E 2011E 2012E 2013E 2014E Prime Rate 2% 2% 2% 2% 2% Cash Flow from Operating Activities 6.49 7.31 8.36 9.52 10.75 Cash Flow from Investing Activities 4.41- 4.63- 4.86- 5.10- 5.35- Cash Available for Debt Repayment 2.08 2.68 3.50 4.42 5.40 Total Mandatory Repayments - 3.00- 3.00- 3.00- 3.00- Cash From Balance Sheet 0.00 0.00 0.00- 0.00 1.07 Cash Available for Optional Debt Repayment 2.08 0.32- 0.50 1.42 3.47 Revolver Beginning Revolver Balance 3.38 1.29 1.61 1.11 - (Paydown) / Drawdown 2.08- 0.32 0.50- 1.11- - Ending Revolver Balance 1.29 1.61 1.11 - - Interest Expense 0.23 0.15 0.14 0.06 - Senior Debt Senior Debt Beginning Balance 13.64 13.64 10.64 7.64 4.33 Mandatory Payment 3.00- 3.00- 3.00- 3.00- Optional Payment - - - 0.31- 1.33- Senior Ending Balance 13.64 10.64 7.64 4.33 - Interest Expense 1.64 1.46 1.10 0.72 0.26 Subordinated Debt Subordinated Debt Beginning Balance 4.25 4.25 4.25 4.25 4.25 (Paydown) / Drawdown - - - 0.31- 3.00- Subordinated Debt Ending Balance 4.25 4.25 4.25 4.25 4.25 Interest Rate 12% 12% 12% 12% 12% Interest Expense 0.51 0.51 0.51 0.51 0.51
- 4. 4 Appendix 4: Base Case High Leverage – Cash Flow Analysis & Debt Schedule Appendix 5: Leverage Analysis & Covenant Stress Test Debt Schedule 2009 Adj. 2009PF 2010E 2011E 2012E 2013E 2014E Prime Rate 2% 2% 2% 2% 2% Cash Flow from Operating Activities 4.09 4.77 5.73 6.78 8.16 Cash Flow from Investing Activities 4.41- 4.63- 4.86- 5.10- 5.35- Cash Available for Debt Repayment 0.32- 0.15 0.88 1.68 2.80 Total Mandatory Repayments - 3.00- 3.00- 3.00- 13.14- Cash From Balance Sheet 0.00- 0.00 0.00 0.00- 0.00- Cash Available for Optional Debt Repayment 0.32- 2.85- 2.12- 1.32- 10.34- Revolver Beginning Revolver Balance 3.38 3.69 6.55 8.67 9.99 (Paydown) / Drawdown 0.32 2.85 2.12 1.32 10.34 Ending Revolver Balance 3.69 6.55 8.67 9.99 20.33 Interest Expense 0.35 0.51 0.76 0.93 1.52 Senior Debt Senior Debt Beginning Balance 22.14 22.14 19.14 16.14 13.14 Mandatory Payment 3.00- 3.00- 3.00- 13.14- Optional Payment - - - - - Senior Ending Balance 22.14 19.14 16.14 13.14 - Interest Expense 3.54 3.30 2.82 2.34 1.05 Subordinated Debt Subordinated Debt Beginning Balance 12.76 12.76 12.76 12.76 12.76 (Paydown) / Drawdown - - - - - Subordinated Debt Ending Balance 12.76 12.76 12.76 12.76 12.76 Interest Rate 15% 15% 15% 15% 15% Interest Expense 1.91 1.91 1.91 1.91 1.91 Cash Flow Analysis 2010E 2011E 2012E 2013E 2014E Operating Activities Net Income 0.83 1.46 2.23 3.09 4.25 Depreciation 3.33 3.53 3.73 3.94 4.15 Chg Net WC 0.08- 0.22- 0.23- 0.24- 0.25- Cash from Ops 4.09 4.77 5.73 6.78 8.16 Investing Activities CAPEX 4.41- 4.63- 4.86- 5.10- 5.35- Financing Activities Change in Revolver 0.32 2.85 2.12 1.32 10.34 Change in Senior Debt - 3.00- 3.00- 3.00- 13.14- Change in Subordinated Debt Cash Flow from Financing 0.32 0.15- 0.88- 1.68- 2.80- Beg Cash - 0.00- 0.00- 0.00 0.00 Net Change 0.00 0.00- 0.00- 0.00 0.00 Ending Cash 0.00 0.00- 0.00- 0.00 0.00 Base Case - Moderate Leverage Scenario Stress Case - Moderate Leverage Scenario Key Statistics Key Statistics 2010 2011 2012 2013 2014 2010 2011 2012 2013 2014 Summary Statistics Summary Statistics Debt/EBITDA 1.86x 1.45x 1.05x 0.63x 0.29x Debt/EBITDA 2.84x 2.56x 2.15x 1.74x 1.25x Not to be above 2.4x 2.2x 2.0x 1.8x 1.6x Not to be above 2.4x 2.2x 2.0x 1.8x 1.6x ok ok ok ok ok no no no ok ok Senior Debt + Revolver/EBITDA 1.45x 1.08x 0.70x 0.32x 0.00x Senior Debt + Revolver/EBITDA 2.25x 2.02x 1.66x 1.29x 0.86x Not to be above 2.4x 2.2x 2.0x 1.8x 1.6x Not to be above 2.4x 2.2x 2.0x 1.8x 1.6x ok ok ok ok ok ok ok ok ok ok EBITDA/Interest 4.34x 5.37x 7.12x 10.55x 19.11x EBITDA/Interest 2.97x 3.31x 3.94x 4.85x 6.56x Not to be less than 2.00x 2.00x 2.00x 2.00x 2.00x Not to be less than 2.00x 2.00x 2.00x 2.00x 2.00x ok ok ok ok ok ok ok ok ok ok Internal Rate of Return Internal Rate of Return at a 6.0x exit in 2014 23.4% at a 6.0x exit in 2014 11.7% Base Case - High Leverage Scenario Stress Case - High Leverage Scenario Key Statistics Key Statistics 2010 2011 2012 2013 2014 2010 2011 2012 2013 2014 Summary Statistics Summary Statistics Debt/EBITDA 3.7x 3.4x 3.0x 2.7x 2.2x Debt/EBITDA 5.5x 5.4x 5.0x 4.6x 4.0x Not to be above 4.2x 4.0x 3.8x 3.6x 3.4x Not to be above 4.2x 4.0x 3.8x 3.6x 3.4x ok ok ok ok ok no no no no no Senior Debt + Revolver/EBITDA 2.5x 2.3x 2.0x 1.7x 1.4x Senior Debt + Revolver/EBITDA 3.7x 3.7x 3.5x 3.3x 2.8x Not to be above 4.2x 4.0x 3.8x 3.6x 3.4x Not to be above 4.2x 4.0x 3.8x 3.6x 3.4x ok ok ok ok ok ok ok ok ok ok EBITDA/Interest 1.78x 1.98x 2.26x 2.61x 3.28x EBITDA/Interest 1.24x 1.31x 1.46x 1.63x 2.01x Not to be less than 2.00x 2.00x 2.00x 2.00x 2.00x Not to be less than 2.00x 2.00x 2.00x 2.00x 2.00x no no ok ok ok no no no no ok Internal Rate of Return Internal Rate of Return at a 6.0x exit in 2014 34.0% at a 6.0x exit in 2014 11.2%
- 5. 5 Appendix 6: Base Case – Summary of Relevant Financial Statistics & IRR Calculations Moderate Leverage Income Statement Statistics 2010 2011 2012 2013 2014 Revenue $33.9 $35.6 $37.4 $39.2 $41.2 EBITDA 10.3 11.3 12.4 13.5 14.7 Net Income 3.2 4.0 4.9 5.8 6.9 Interest Expense 2.4 2.1 1.7 1.3 0.8 Taxes 1.4 1.7 2.1 2.5 2.9 Revenue Growth 5.0% 5.0% 5.0% 5.0% 5.0% EBITDA Margin 30.5% 31.9% 33.2% 34.5% 35.7% EBITDA Growth 21.5% 9.8% 9.4% 9.0% 8.7% Balance Sheet / Cash Flow Statistics Cash $0.0 $0.0 ($0.0) ($0.0) $1.1 Total Debt 19.2 16.5 13.0 8.6 4.3 Revolver 1.3 1.6 1.1 0.0 0.0 Senior Debt 13.6 10.6 7.6 4.3 0.0 Subordinated Loan 4.3 4.3 4.3 4.3 4.3 Capex (4.4) (4.6) (4.9) (5.1) (5.4) (Increase) Decrease in W/C (0.1) (0.2) (0.2) (0.2) (0.3) Leverage Ratios Total Debt / EBITDA 1.86x 1.5x 1.0x 0.6x 0.3x Revolver / EBITDA 0.1x 0.1x 0.1x 0.0x 0.0x Senior Debt / EBITDA 1.3x 0.9x 0.6x 0.3x 0.0x Subordinated Loan / EBITDA 0.4x 0.4x 0.3x 0.3x 0.3x Interest Coverage Statistics EBITDA / Interest Expense 4.3x 5.4x 7.1x 10.5x 19.1x EBITDA - Capex / Interest Expense 2.5x 3.2x 4.3x 6.6x 12.2x EBITDA - Capex - ∆ W/C / Interest Expense 2.5x 3.1x 4.2x 6.4x 11.8x SALE OF COMPANY IN 2014 Closing Date 31-Oct-14 IRR to Financial Sponsor 2009 2010 2011 2012 2013 2014 Initial Equity Investment ($29.8) $0.0 $0.0 $0.0 $0.0 $0.0 2014 EBITDA $14.7 Dividends 0.0 0.0 0.0 0.0 0.0 0.0 EBITDA Multiple 6.0x Proceeds at Sale 0.0 0.0 0.0 0.0 0.0 85.1 Transaction Value $88.3 Total Cash Flows to Sponsor ($29.8) $0.0 $0.0 $0.0 $0.0 $85.1 Less: Total Debt (4.3) IRR Calculation 23.4% Plus: Cash Balance 1.1 Equity Value $85.1 High Leverage Income Statement Statistics 2010 2011 2012 2013 2014 Revenue $33.9 $35.6 $37.4 $39.2 $41.2 EBITDA 10.3 11.3 12.4 13.5 14.7 Net Income 0.8 1.5 2.2 3.1 4.3 Interest Expense 5.8 5.7 5.5 5.2 4.5 Taxes 0.4 0.6 1.0 1.3 1.8 Revenue Growth 5.0% 5.0% 5.0% 5.0% 5.0% EBITDA Margin 30.5% 31.9% 33.2% 34.5% 35.7% EBITDA Growth 21.5% 9.8% 9.4% 9.0% 8.7% Balance Sheet / Cash Flow Statistics Cash ($0.0) ($0.0) $0.0 $0.0 ($0.0) Total Debt 38.6 38.4 37.6 35.9 33.1 Revolver 3.7 6.5 8.7 10.0 20.3 Senior Debt 22.1 19.1 16.1 13.1 0.0 Subordinated Loan 12.8 12.8 12.8 12.8 12.8 Capex (4.4) (4.6) (4.9) (5.1) (5.4) (Increase) Decrease in W/C (0.1) (0.2) (0.2) (0.2) (0.3) Leverage Ratios Total Debt / EBITDA 3.74x 3.4x 3.0x 2.7x 2.2x Revolver / EBITDA 0.4x 0.6x 0.7x 0.7x 1.4x Senior Debt / EBITDA 2.1x 1.7x 1.3x 1.0x 0.0x Subordinated Loan / EBITDA 1.2x 1.1x 1.0x 0.9x 0.9x Interest Coverage Statistics EBITDA / Interest Expense 1.8x 2.0x 2.3x 2.6x 3.3x EBITDA - Capex / Interest Expense 1.0x 1.2x 1.4x 1.6x 2.1x EBITDA - Capex - ∆ W/C / Interest Expense 1.0x 1.1x 1.3x 1.6x 2.0x SALE OF COMPANY IN 2014 Closing Date 31-Oct-14 IRR to Financial Sponsor 2009 2010 2011 2012 2013 2014 Initial Equity Investment ($12.8) $0.0 $0.0 $0.0 $0.0 $0.0 2014 EBITDA $14.7 Dividends 0.0 0.0 0.0 0.0 0.0 0.0 EBITDA Multiple 6.0x Proceeds at Sale 0.0 0.0 0.0 0.0 0.0 55.2 Transaction Value $88.3 Total Cash Flows to Sponsor ($12.8) $0.0 $0.0 $0.0 $0.0 $55.2 Less: Total Debt (33.1) IRR Calculation 34.0% Plus: Cash Balance (0.0) Equity Value $55.2 IRR Analysis IRR Analysis
- 6. 6 Appendix 7: Stress Case – Summary of Relevant Financial Statistics & IRR Calculations Moderate Leverage Income Statement Statistics 2010 2011 2012 2013 2014 Revenue $30.3 $31.2 $32.2 $33.1 $34.8 EBITDA 7.3 7.8 8.7 9.6 10.9 Net Income 1.1 1.4 2.0 2.7 3.8 Interest Expense 2.5 2.4 2.2 2.0 1.7 Taxes 0.5 0.6 0.9 1.2 1.6 Revenue Growth -6.0% 3.0% 3.0% 3.0% 5.0% EBITDA Margin 24.0% 25.0% 26.9% 28.8% 31.3% EBITDA Growth -14.3% 7.1% 11.0% 10.3% 13.9% Balance Sheet / Cash Flow Statistics Cash ($0.0) $0.0 $0.0 ($0.0) ($0.0) Total Debt 20.7 20.0 18.7 16.6 13.7 Revolver 2.8 5.1 6.8 7.7 7.8 Senior Debt 13.6 10.6 7.6 4.6 1.6 Subordinated Loan 4.3 4.3 4.3 4.3 4.3 Capex (3.9) (4.1) (4.2) (4.3) (4.5) (Increase) Decrease in W/C 0.1 (0.1) (0.0) (0.0) (0.1) Leverage Ratios Total Debt / EBITDA 2.84x 2.6x 2.2x 1.7x 1.3x Revolver / EBITDA 0.4x 0.7x 0.8x 0.8x 0.7x Senior Debt / EBITDA 1.9x 1.4x 0.9x 0.5x 0.2x Subordinated Loan / EBITDA 0.6x 0.5x 0.5x 0.4x 0.4x Interest Coverage Statistics EBITDA / Interest Expense 3.0x 3.3x 3.9x 4.9x 6.6x EBITDA - Capex / Interest Expense 1.4x 1.6x 2.0x 2.7x 3.8x EBITDA - Capex - ∆ W/C / Interest Expense 1.4x 1.5x 2.0x 2.6x 3.8x SALE OF COMPANY IN 2014 Closing Date 31-Oct-14 IRR to Financial Sponsor 2009 2010 2011 2012 2013 2014 Initial Equity Investment ($29.8) $0.0 $0.0 $0.0 $0.0 $0.0 2014 EBITDA $10.9 Dividends 0.0 0.0 0.0 0.0 0.0 0.0 EBITDA Multiple 6.0x Proceeds at Sale 0.0 0.0 0.0 0.0 0.0 51.6 Transaction Value $65.3 Total Cash Flows to Sponsor ($29.8) $0.0 $0.0 $0.0 $0.0 $51.6 Less: Total Debt (13.7) IRR Calculation 11.7% Plus: Cash Balance 0.0 Equity Value $51.6 High Leverage Income Statement Statistics 2010 2011 2012 2013 2014 Revenue $30.3 $31.2 $32.2 $33.1 $34.8 EBITDA 7.3 7.8 8.7 9.6 10.9 Net Income (1.3) (1.1) (0.6) 0.0 1.2 Interest Expense 5.9 6.0 6.0 5.9 5.4 Taxes (0.6) (0.5) (0.3) 0.0 0.5 Revenue Growth -6.0% 3.0% 3.0% 3.0% 5.0% EBITDA Margin 24.0% 25.0% 26.9% 28.8% 31.3% EBITDA Growth -14.3% 7.1% 11.0% 10.3% 13.9% Balance Sheet / Cash Flow Statistics Cash ($0.0) $0.0 $0.0 ($0.0) ($0.0) Total Debt 40.1 42.0 43.2 43.9 43.6 Revolver 5.2 10.1 14.3 18.0 30.8 Senior Debt 22.1 19.1 16.1 13.1 0.0 Subordinated Loan 12.8 12.8 12.8 12.8 12.8 Capex (3.9) (4.1) (4.2) (4.3) (4.5) (Increase) Decrease in W/C 0.1 (0.1) (0.0) (0.0) (0.1) Leverage Ratios Total Debt / EBITDA 5.50x 5.4x 5.0x 4.6x 4.0x Revolver / EBITDA 0.7x 1.3x 1.7x 1.9x 2.8x Senior Debt / EBITDA 3.0x 2.5x 1.9x 1.4x 0.0x Subordinated Loan / EBITDA 1.7x 1.6x 1.5x 1.3x 1.2x Interest Coverage Statistics EBITDA / Interest Expense 1.2x 1.3x 1.5x 1.6x 2.0x EBITDA - Capex / Interest Expense 0.6x 0.6x 0.8x 0.9x 1.2x EBITDA - Capex - ∆ W/C / Interest Expense 0.6x 0.6x 0.7x 0.9x 1.2x SALE OF COMPANY IN 2014 Closing Date 31-Oct-14 IRR to Financial Sponsor 2009 2010 2011 2012 2013 2014 Initial Equity Investment ($12.8) $0.0 $0.0 $0.0 $0.0 $0.0 2014 EBITDA $10.9 Dividends 0.0 0.0 0.0 0.0 0.0 0.0 EBITDA Multiple 6.0x Proceeds at Sale 0.0 0.0 0.0 0.0 0.0 21.7 Transaction Value $65.3 Total Cash Flows to Sponsor ($12.8) $0.0 $0.0 $0.0 $0.0 $21.7 Less: Total Debt (43.6) IRR Calculation 11.2% Plus: Cash Balance (0.0) Equity Value $21.7 IRR Analysis IRR Analysis