Download to read offline
![International Research Journal of Engineering and Technology (IRJET) e-ISSN: 2395 -0056
Volume: 03 Issue: 02 | Feb-2016 www.irjet.net p-ISSN: 2395-0072
© 2016, IRJET | Impact Factor value: 4.45 | ISO 9001:2008 Certified Journal | Page 1230
REFERENCES
[1] Abel Rodrigue de la Concepcion, Riccardo stefanelli,
Daniele Trinchero, “A wireless Sensor Network
Platform Optimized for Assisted Sustainable
Agriculture”, IEEE 2014 Global Humanitarian
Technology Conference.
[2] BernhardHofle,”RadiometricCorrectionofTerrestrial
LiDAR Point Cloud Data for Individual Maize Plant
Detection”, 2013 IEEE.
[3] Sarika Datir,Sanjeev Wagh,”MonitoringandDetection
of Agricultural Disease using Wireless Sensor
Network”,International journal of Computer
Applications, 2014.
[4] Dheeb Al Bashish, Malik Braik, and Sulieman Bani-
Ahmad,”A Framework forDetectionandClassification
of Plant Leaf and Stem Diseases”, International
Conference on Signal and Image Processing, 2010.
[5] M.Seetha, I.V.Muralikrishna,
B.L.Deekshatulu,”Artificial Neural Networkks and
Other Methods of Image Classification”, Journal of
Theoretical and Applied Information Technology,
2005-2008.
[6] Sonal Verma, Nikhil Chug, Dhananjay V.
Gadre,”Wireless Sensor Network for Crop Field
Monitoring”, International Conference on Recent
Trends in Information, Telecommunication and
Computing, 2010.
[7] Yunseop (James) Kim, Robert G.Evans, and William
M.Iversen,”Remote Sensing and Control of an
irrigation System Using a DistributedWirelessSensor
Network”, IEEE Transactions onIntruementationand
Measurement, July 2008.](https://image.slidesharecdn.com/irjet-v3i2216-171028110828/75/Low-Complexity-Design-for-WSN-Based-Plant-Monitoring-System-5-2048.jpg)

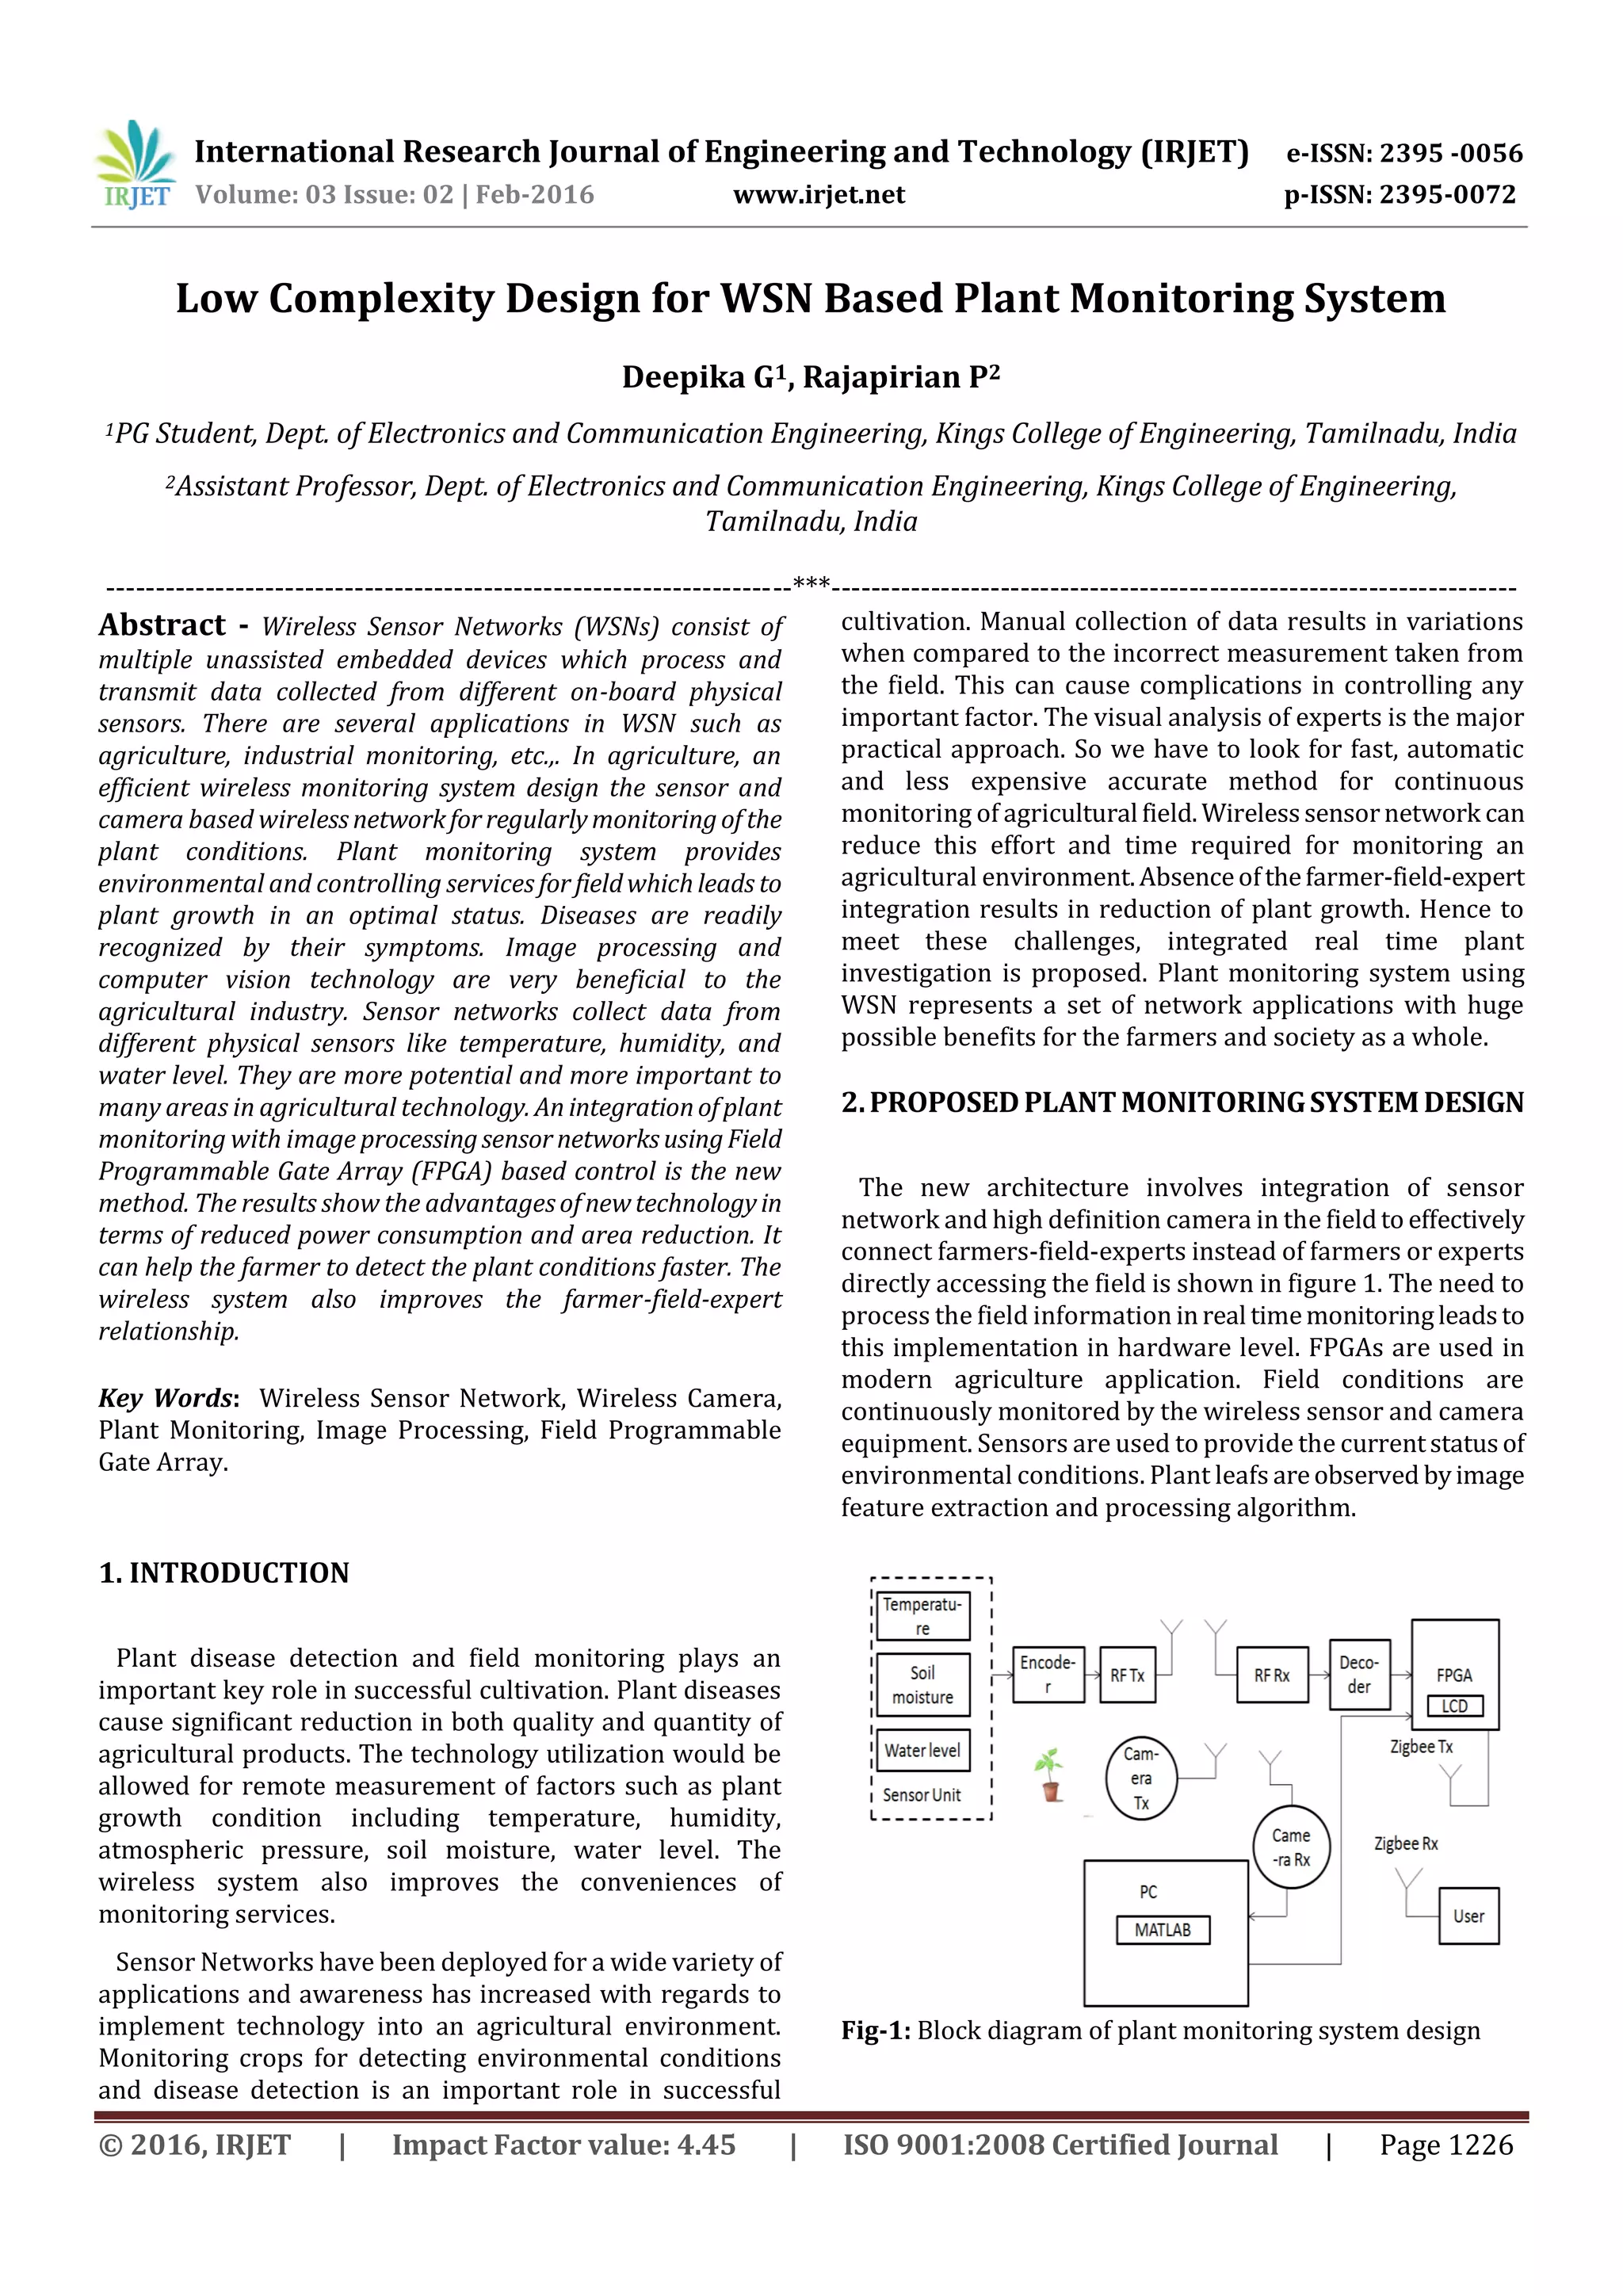
1) The document proposes a low complexity design for a wireless sensor network-based plant monitoring system that integrates image processing and sensor networks using an FPGA-based control. 2) The system uses sensors to monitor environmental conditions and a wireless camera to capture plant images, which are processed using algorithms like K-means clustering and SVM to detect diseases like anthracnose and black spot. 3) Feature extraction is performed on the images to identify texture, size, and shape using techniques like gray-level co-occurrence matrix. The system then calculates the percentage of affected plant area to diagnose disease grading.


![[71]a counting algorithm for tangerine yield estimation](https://cdn.slidesharecdn.com/ss_thumbnails/71acountingalgorithmfortangerineyieldestimation-140212234920-phpapp02-thumbnail.jpg?width=640&height=640&fit=bounds)