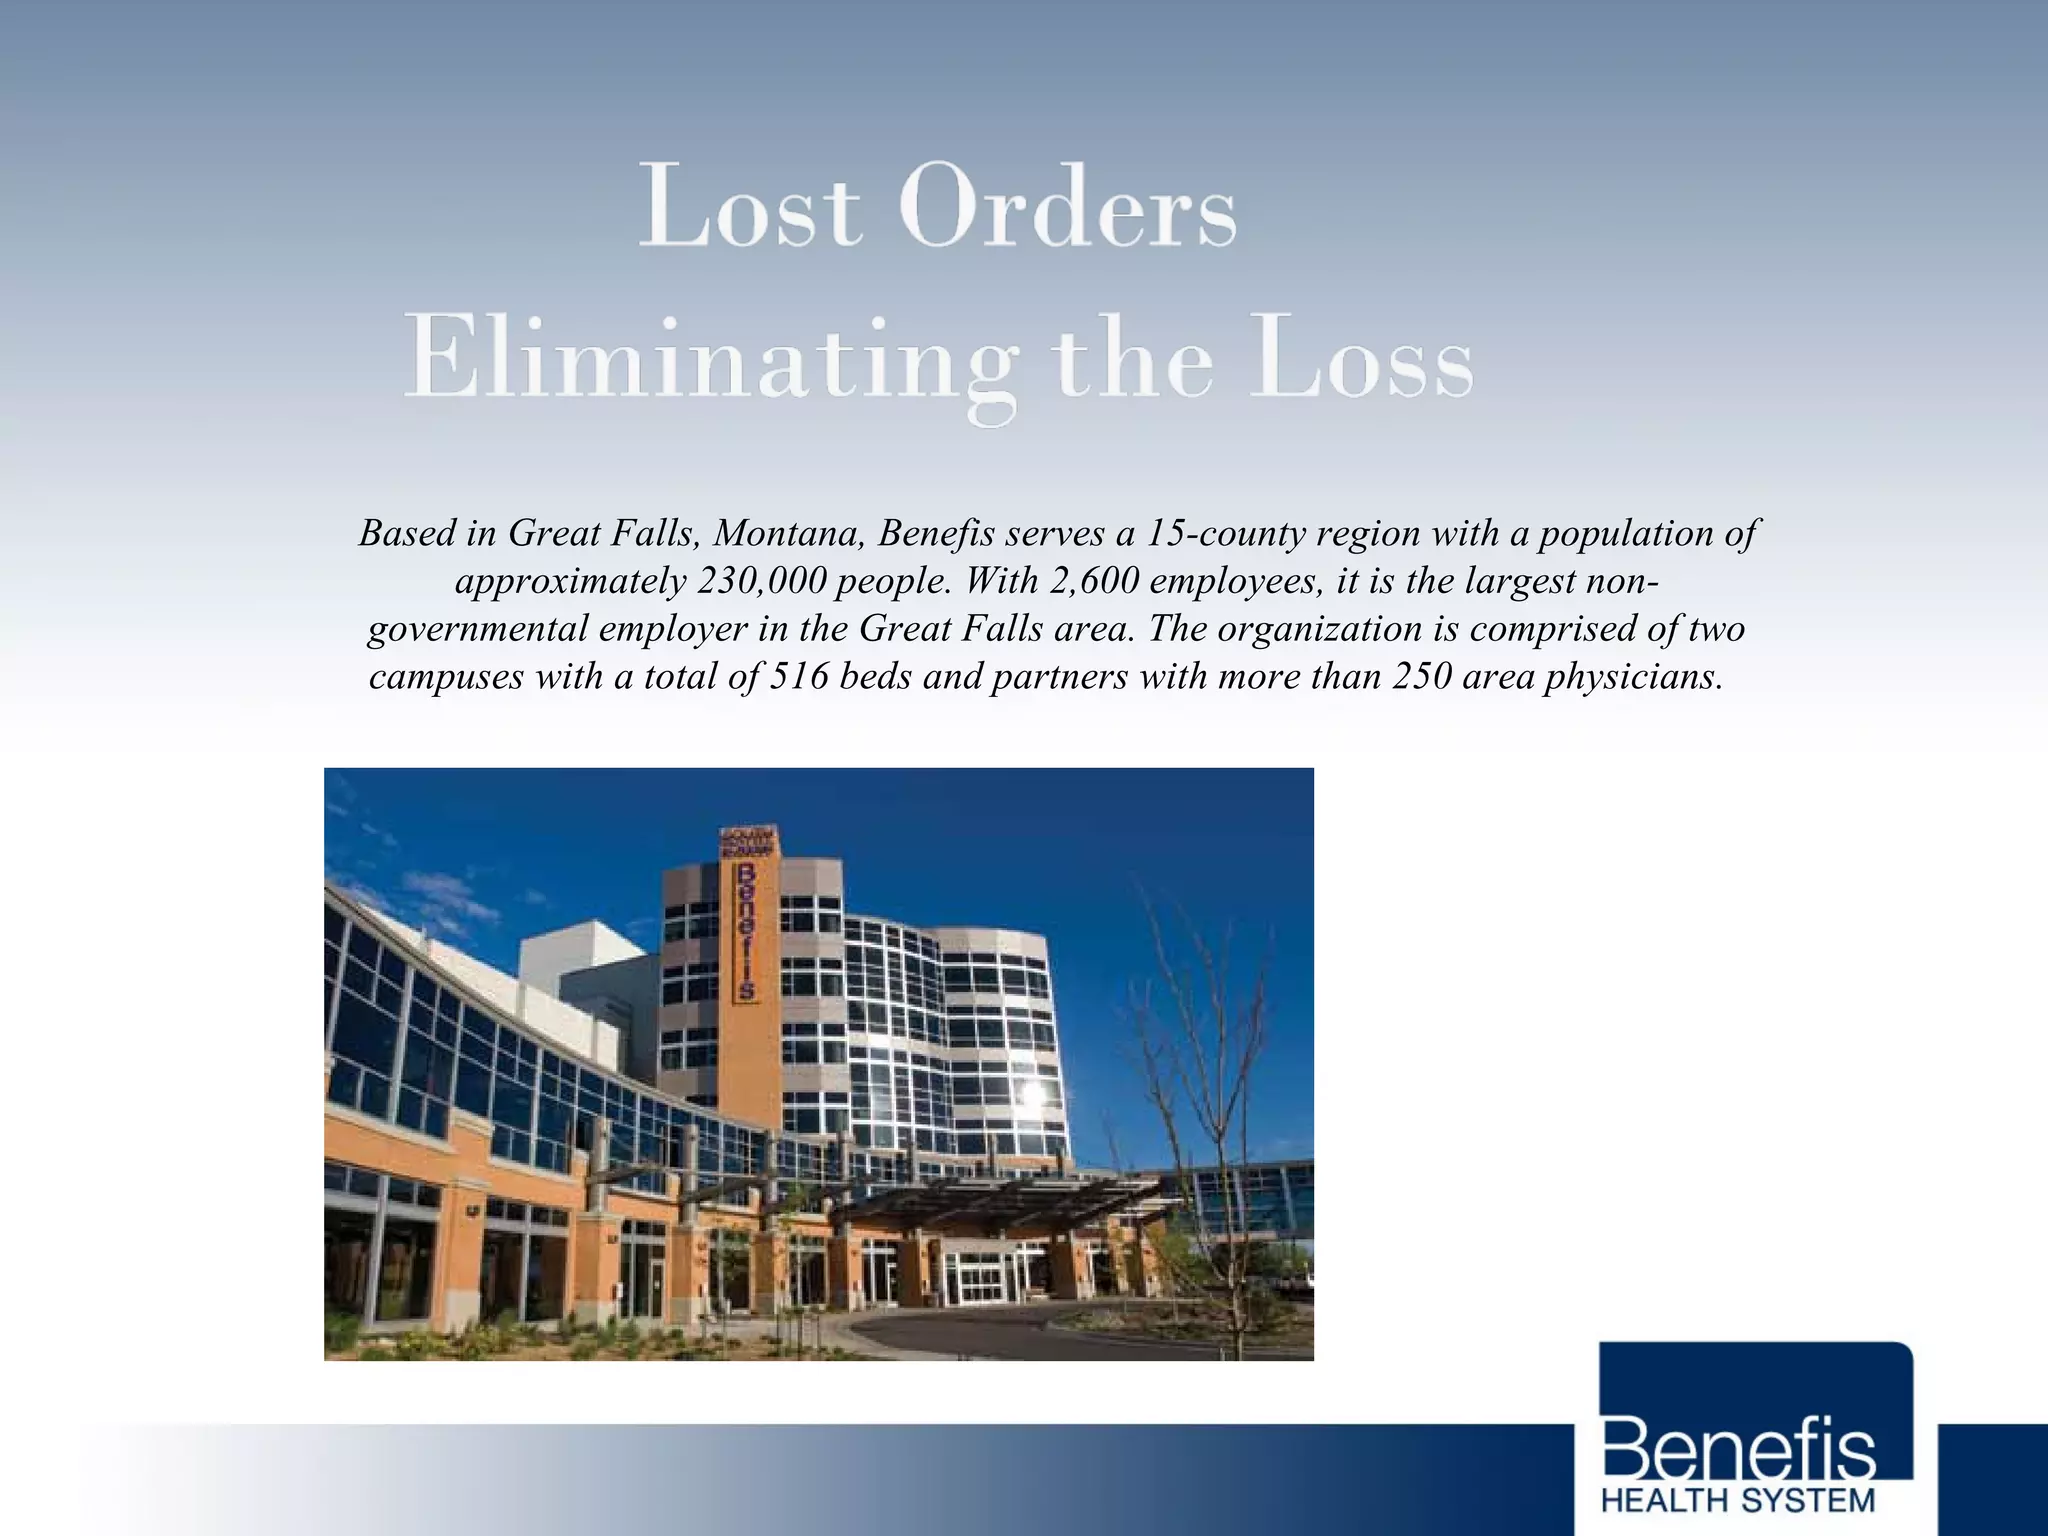
Based in Great Falls, Montana, Benefis Health System serves over 230,000 people across a 15-county region. With over 2,600 employees, Benefis is the largest non-governmental employer in the Great Falls area. The organization operates two campuses with a total of 516 beds and partners with more than 250 local physicians.
Acusera 24.7 Interlaboratory Data Management - June 17 LT244Randox
Acusera 24.7 Live Online version 2.0 is here! Faster, smarter and more efficient than ever before, this interlaboratory data management program will be sure to help streamline internal QC in all laboratories regardless of size.
RIQAS is the largest international External Quality Assessment (EQA)/ Proficiency Testing (PT) scheme, there are currently more than 45,000 participants in 133 countries.
Basic QC Statistics - Improving Laboratory Performance Through Quality Contro...Randox
Randox Quality Control's latest educational guide examines Internal Quality Control, External Quality Assessment, Why laboratories should run QC, How often laboratories should run QC, Basic QC statistics and the quality control process.
The laboratory shall determine measurement uncertainty for each measurement procedure,
in the examination phases used to report measured quantity values on patients’ samples. The
laboratory shall define the performance requirements for the measurement uncertainty of each
measurement procedure and regularly review estimates of measurement uncertainty.
Acusera 24.7 Interlaboratory Data Management Randox
Acusera 24•7 Live Online is an interlaboratory data management package designed to complement the Acusera range of Internal Quality Controls. Created to help laboratories effectively manage and interpret their QC results, the analytical capabilities of Acusera 24•7 Live Online, coupled with the superior quality and flexibility of our Acusera control range, will revolutionise your laboratory's workflow enabling early identification of any trends or system errors.
Acusera 24.7 Live Online will automatically calculate internal QC statistics including mean, standard deviation and CV. The ability to apply user defined QC multi-rules will help to reduce false rejections and maintain a high level of error detection.
Online access anytime, anywhere
Peer group data from over 20,000 participants
Peer group statistics updated daily
Unique dashboard highlights poor performance
Interactive charts combining multiple analytes, lots and instruments
Comprehensive reports including audit trail reports to aid accreditation
Automated QC result entry via Acusera 24•7 Connect
Improving Laboratory Performance Through Quality Control - The role of EQA in...Randox
Randox Quality Control's five simple steps to QC success. The second education guide from Randox QC for clinical laboratory staff. The guide will examine how EQA works, benefits of EQA and what a laboratory should look for when choosing an EQA scheme.
Troubleshooting QC Problems: Your QC has failed, what do you do next?Randox
Randox Quality Control's next 'Improving Laboratory Performance Through Quality Control' educational guide has been published with helpful tips that your laboratory can use in order to ensure it has effective troubleshooting procedures in place.
So you ran QC this morning and realised that one of your analytes has been flagged as 'out-of-control', what do you do next? Do you ignore the warning and continue patient testing, repeat the control until it's within range or do you halt patient testing and investigate the source of the error?
When it comes to troubleshooting QC errors, unfortunately there is no easy path to take. However, it's important that you have standard operating procedures in place, outlining what to do in the event of an out-of control error. Errors occur in laboratories all over the world. A lab with effective troubleshooting procedures in place will still have errors but will be able to detect them, quickly reducing their impact and reducing the risk of wasting both time and money.
QC Multi rules - Improving Laboratory Performance Through Quality ControlRandox
Randox Quality Control's latest educational guide examines and explains what QC Multi-Rules are, How to identify an out of control event with QC rules, How to use QC Multi-Rules, The different types of analytical errors, The tools to assist labs and how a lab can troubleshoot QC errors.
Randox QC offer an extensive range of third party quality controls. Manufactured independently, the Acusera range delivers unbiased performance assessment with any instrument or method, helping to meet ISO 15189:2012 requirements whilst simultaneously eliminating the need for multiple instrument dedicated controls.
The Effectiveness of the Hazard and Operability Study Methodology in Process ...PECB
HAZOP is the acronym for HAZard and OPerability study. It is a structured and systematic examination of a planned or existing product, process, procedure or system. It is used to identify risks to people, equipment, environment and/or organizational objectives, focusing primarily on the design intent of the particular system.
The presentation introduces best practice approaches in conducting a HAZOP Study based on IEC Standard- 61882.
In this webinar, the presenter speaks freely of his experience in leading an actual HAZOP Study and highlights the advantages of this risk assessment technique.
Main points covered:
• How to create awareness of the use of the Hazard and Operability (HAZOP) Methodology in process Hazard Analysis (PHA)?
• How to familiarize Potential HAZOP Team Members with their Roles and Responsibilities in the HAZOP Examination of a Typical Facility?
A Case Summary Study Approach will be used based on the presenter’s own experience of leading an actual HAZOP Study.
Presenter:
This session was presented by PECB Trainer Jacob McLean, Principal Consultant and Managing Director of Kaizen Training & Management Consultants Limited.
Link of the recorded session published on YouTube: https://youtu.be/IvsrlHFADTo
Educational presentation for medical laboratory technologists on how to create a lean culture in their workplace to improve the healthcare service by minimizing waste and enhancing work effeciency. An example in this presentation is about minimizing patient's wait time in the laboratory reception area.
Sharing a New Ideal: How Tomorrow’s Understaffed, Multi-Site Lab Organization...mhartman1309
This presentation was presented by Chris Christopher at the Lab Quality Confab Conference on Nov 2, 2010. It shows how medical laboratories are using automation, technology and lean sigma improvement methodologies to meet organizational needs.
Speaker Presentation from U.S. News Healthcare of Tomorrow leadership summit, Nov. 1-3, 2017 in Washington, DC. Find out more about this forum at www.usnewshot.com.
Process mining - a case by ING Belgium and Python PredictionsPython Predictions
On Monday April 11 2016, we have demonstrated how we applied Process Mining to improve the customer experience in a crucial customer-facing process at ING Belgium. In this case we compare traditional (six sigma-style) approaches with more modern techniques to help ING Belgium serve its clients better. We will illustrate the benefits, milestones, requirements and potential pitfalls we encountered. Presentation held on the INFORMS conference on Business Analytics and Operations Research in Orlando (USA).
Overview of Lean Manufacturing and Six Sigma tools, comaprison between Lean Speed and Six Sigma Quality combining Lean with Six Sigma
Overview of DMAIC and SIX SIGMA FORMULA
ReferenceManaging Quality Integrating the Supply Chain, 4th Ed.docxdebishakespeare
Reference:Managing Quality: Integrating the Supply Chain, 4th Ed. By S. ThomasFoster
1. Interpret the following charts to determine if the processes are stable.
2. A production process for JMF Semicon is monitored using the x-bar and R charts. Ten samples of n=15 observations have been gathered with the following results:
Sample
Mean
Range
1
282
35
2
290
54
3
262
43
4
309
30
5
263
42
6
325
24
7
288
4
8
298
23
9
277
17
10
363
55
a. Develop a control chart and plot the means.
b. Is the process in control? Explain.
3. A finishing process packages assemblies into boxes. You have noticed variability in the boxes and desire to improve the process to fix the problem because some products fit too tightly into the boxes and others fit too loosely. Following are width measurements for the boxes. Using x-bar and R charts, plot and interpret the process.
Sample
1
2
3
4
5
6
7
8
82.21
82.73
82.39
82.19
82.37
82.01
82.79
82.70
82.15
81.84
82.13
82.73
82.36
82.10
82.73
82.69
82.25
82.25
82.26
82.27
82.34
82.79
82.74
82.76
82.01
82.27
82.52
82.34
81.98
81.62
82.74
82.72
82.15
82.44
82.44
82.43
82.01
81.64
82.73
82.75
82.15
82.44
82.37
82.27
81.89
82.16
82.76
82.74
4. A Rochester, New York firm produces grommets that have to fit into a slot in an assembly. Following are dimensions of grommets (in millimeters):
Sample
x
1
69
50
81
69
96
2
78
68
81
113
96
3
51
96
54
69
95
4
51
68
71
56
93
5
69
96
113
83
24
a. Using x-bar and R charts, determine if the process is in control.
Management 2070Y - Fall 2013 - Assignment #1 Page 2 of 5
1. “Leave Without Treatment” Analysis (10 marks)
Periodically, an individual will check-in at a walk-in-clinic, but leave without ever
receiving treatment. Employees notice this when they call the individual’s name, but the
individual is no longer in the waiting area. It is thought that some of this behaviour can
be explained by the individual “feeling better” and deciding to leave, though
management fears that individuals are leaving because they have waited too long. These
cases are of concern because the individual did not receive treatment which may lead to
more extensive health problems, but also because the individual may “bounce around”
to various walk-in-clinics creating increased demands on health care staff.
In an effort to reduce the frequency of individuals “leaving without treatment”, the local
health region has sampled data from the registration system at their walk-in clinics.
They selected data from 150 registrations each day for 15 days that they defined as
“normal operations” and thus they would like quality control chart(s) to be prepared
with control limits based on that data. Furthermore, management would like to see
recent sample data (150 registrations per day for the last 15 days) plotted against these
control limits. If an out-of-control condition is found, registratio ...
A 10-page response is required for the combination of Parts A,.docxransayo
A 10-page response is required for the combination of Parts A, B, C, D, and E.
Instructions: As the new Director of Information Management, you have been tasked with implementing a new clinical information system for pharmacy services at the hospital. The hospital would like to purchase a pharmacy system that will enable physicians to automate orders through Computerized Physician Order Entry (CPOE) in hopes of reducing order delays, improving the legibility of orders, streamlining operations, and ultimately improving patient safety by reducing medication errors. In spite of previous efforts, there has been little movement towards the implementation of the CPOE, and selecting and putting the CPOE into operation are main reasons that you have been hired.
The organization has competent and dedicated hospital leaders who are strongly supportive of the CPOE concept, demonstrating a sound commitment to its implementation. There are also physician champions dedicated to implementing the CPOE and actively involved in influencing other staff physicians to accept the CPOE. These physicians are also ready to facilitate workflow issues involved in using the new system.
This project is comprised of five (5) parts. Refer to the following guidelines, notes, and summaries as you prepare your response. Your Stand-Alone Project responses should be both grammatically and mechanically correct and formatted in the same fashion as the project itself. If there is a Part A, your response should identify a Part A, etc. In addition, you must appropriately cite all resources used in your response and document them in a bibliography using APA style. (3 graphical displays, a 15-slide presentation, and a 10-page response are required for the combinations of parts A, B, C, D, and E.)
Part A SWOT Analysis
You begin your selection and implementation process by calling a project planning meeting. You take scrupulous notes during the meeting. (A copy of your notes is located at the end of these instructions).
1. Based on the discussion during the meeting, perform a SWOT Analysis to define organizational efforts and needs. Create a SWOT matrix.
2. Next, provide a written summary of the SWOT results; be sure to address areas that could pose as risk issues for a successful implementation.
Part B Request for Proposal
The hospital requirements and needs were also discussed during the meeting. Your next step will be to create a generic request for proposal (RFP) that will be sent to all the vendors. Your RFP should consist of the following information.
1. Cover Letter
2. Proposal Information
3. A list of questions for vendors. Make sure to include the following topics.
a. Functional Specifications
b. Technical Requirements
c. Implementation Requirements
d. Systems Costs
Part C Vendor Comparison
You have now received information from several vendors. You have selected the two top vendors, and a summary of their information is provided at the end of .
In this webinar we cover the new and exciting product innovations from the Centricity EDI team. We also share how our customers have improved their A/R and collection rates with the use of these solutions.
How to improve patient flow in emergency and ambulatory care, pop up uni, 10a...NHS England
Expo is the most significant annual health and social care event in the calendar, uniting more NHS and care leaders, commissioners, clinicians, voluntary sector partners, innovators and media than any other health and care event.
Expo 15 returned to Manchester and was hosted once again by NHS England. Around 5000 people a day from health and care, the voluntary sector, local government, and industry joined together at Manchester Central Convention Centre for two packed days of speakers, workshops, exhibitions and professional development.
This year, Expo was more relevant and engaging than ever before, happening within the first 100 days of the new Government, and almost 12 months after the publication of the NHS Five Year Forward View. It was also a great opportunity to check on and learn from the progress of Greater Manchester as the area prepares to take over a £6 billion devolved health and social care budget, pledging to integrate hospital, community, primary and social care and vastly improve health and well-being.
More information is available online: www.expo.nhs.uk
Lost Orders Project_System Operations Presentation July 2013
1. Based in Great Falls, Montana, Benefis serves a 15-county region with a population of
approximately 230,000 people. With 2,600 employees, it is the largest non-
governmental employer in the Great Falls area. The organization is comprised of two
campuses with a total of 516 beds and partners with more than 250 area physicians.
2. Why This Project
A significant number
of charges are going
to be written off
secondary to missing
orders or invalid
orders exists.
3. Process Name and Purpose: Lost Physician Orders
There are a significant number of medical record charts that are going to being written off,
versus billed, secondary to missing physician orders. In trying to find missing orders, there is
waste in search, duplication, and over processing, that is producing caregiver and provider
frustration. There is a need to identify process root causes to ensure efficient and effective
solutions are identified.
Problem Statement:
1.Multiple requests for re-work/finding lost orders to ancillary services and physician offices
2.There are currently 648 invalid physician orders ($184,809)
3.There are currently 1216 missing physician orders ($635,274)
Process Sponsor: Steve Ballock,CFO
Process Boundaries:
Starting Point: Patient presents for Procedure at Benefis Health System after outpatient
physician care referral.
Stopping Point: Order is scanned and available in medical record to code and drop bill timely
(within 4 days)
Process Owner: Julie Wall
Team Lead: Laura Merchant
Team Members: Joe LoDuca, Judy Rosales, Patty Harris, Sarah Hall, Greg Hilpert, Marci
Huntsinger, Ingrid Dieudonne, Vicki LeBrun, Amy Linder, Shellie Curtis, Eric Peterson,
Nathan Hough, Kristen Rowen, Hasim Turhan, Laura Merchant, Peter Gray, Julie Wall
Team Leaders: Laura Merchant
Key Customers: Patients, Physicians,
Internally – Accounting, PBS, HIMSS Dept, Ancillary Services Departments, Quality
Improvement
Project Start Date: 10 December 2012
Proposed End Date: 15 June 2013
Project Vision Statement:
All charts, following outpatient procedures will have a valid order 4 days post DOS, available for coding and billing on the electronic medical record.
Project Deliverables:
1. A reliable and capable process.
2.Reduction of charts with missing orders by 50% by June 2013
3.Reduction of charts with missing orders by 80% by Sept. 2013.
Resource Representatives: Coding, Billing, Radiology, Laboratory, BMG offices, Quality Improvement -SCIP Coordinator
Project Charter 2012:133 Missing Outpatient
Physician Orders
4. The Vision
• All charts, following outpatient
procedures will have a valid order
available for coding and billing on
the electronic medical record within
4 days of service
• CTQ- Order on chart within 4 days
from date of service on right patient
D number
13. 5 Why Analysis
• WHY #1:How service departments manage orders and paperwork –
unorganized, multiple paper charts are collected in baskets
WHY #2: The process for getting charts to medical records varies from daily pick
up by medical records staff to departments delivering when big enough batch
(can be 2 weeks from DOS before gets to medical records)
• WHY #3 Silos - departments and functions.
– Coders are only looking for orders in Meditech 4 days after service, faster than medical records gets
charts processed and scanned into Meditech
– Service area do not know the process of how orders get scanned into Meditech -- they have to be
scanned to patient’s D number so that coders can find order (they are off site)
– Charts with non-valid orders are sent back to review without any communication of what is missing.
14. 5 Why Analysis (Continued)
WHY #4 Training and access to systems is lacking.
•Not all services being coded "no orders" require an order (a physician is providing the service)
•Not all orders for services are in the Meditech documentation system (many providers are in Next
Gen).
•Coders do not have access to systems they need - only Meditech
WHY #5 Lack of standard process for capturing orders where needed and education
HOW: TEMPORARY COUNTERMEASURE
1. Training - what is a valid order, what services have orders in what system,
2. Provide coders access to systems needed
FINAL COUNTERMEASURE- A standard process with reduced handoffs and batching, capturing the
power of technology
16. Importance Cost to Feasibility Cost Leverage Total
Project to Customer Implement (Likelihood Reduction (Positive Impact Project
of Success) On Other Processes) Priority
Rate 1 to 5 Rate 1 to 5 Rate 1 to 5 Rate 1 to 5 Rate 1 to 5
High = 5 High = 1 High = 5 High = 5 High = 5
Low = 1 Low = 5 Low = 1 Low = 1 Low = 1
POS Scanner 3 X 5 x 5 x 3 x 4 = 900
Central Repository 5 x 4 x 5 x 3 x 3 = 900
Coder Training 5 x 3 x 3 x 3 x 4 = 540
Eliminate Time Stamping 1 x 5 x 5 x 2 x 3 = 150
Eliminate Triplicate order sheett 1 x 2 x 3 x 5 x 3 = 90
Coder Access to Next Gen 4 x 2 x 5 x 4 x 5 = 800
Coder Access to Manager of
clinic 4 x 5 x 5 x 1 x 3 = 300
Barcode on 90% of documents 1 x 1 x 4 x 1 x 3 = 12
Project Prioritizer
17. FMEA
FMEA
Process Name: Central Repository and POS Scanning
Process Number: SBT 445
Date: 1/1/2001 Revision Level: 1.3
FAILURE MODE
A) SEVERITY
B) OCCURRE
NCE
Probability
C) DETECTIO
N Probability
RISK PRIORITY
NUMBER ACTION TO IMPROVE
REVISED VALUESRate 1-10 Rate 1-10 Rate 1-10 RPN
10=Most Severe
10=Highest
Probability
10=Lowest
Probability AxBxC A B C RPN
1) Long list to search though to find
order -increase staff time 3 4 1 12 Auto delete established 3 1 1 3
2) Select right patient but wrong order
9 2 8 144
When scanning have to
enter test ordered 9 1 4 36
3) Scan order to wrong D number
10 5 6 300
Have to match date of
service during entry 10 2 3 60
4) Order scanned into wrong category
into Meditech 3 3 5 45
Made only access is to
order category 3 1 5 15
5) Scan an order that is not "valid" 10 6 10 600
Training, written reference
document provided at
desktop. MR random audit 10 4 8 320
19. Go Live
• 31 Departments
• Built access for 441 in Repository
• Set Up 8 Kodak Scanners and 30 All in
One Scanners and access for 200
• 33 G drive folders built
• Set up 190 with new Meditech access
• Employees Trained in all 31
departments
26. Go Live with New Process Date April 9, 2013
Go Live with Pilot (SCI and S.Tower Radiology)
27. Average Days to Bill All
Orders
2013 YTD
Jan 12.72
Feb 11.15
Mar 12.68
April 9.19
May 10.63
2012 Days to Bill
Jan 20.22
Feb 18.12
Mar 16.67
Apr 17.25
May 23.34
Jun 24.82
28. Financial Impact
• Coders have to final code to be able to
bill for services
• Prevented Write off of $635,274 (at 40%
reimbursement rate = $254,109.60
revenue )
Days to Final Abstract Status by Coding:
2012 = 23.97 Days
2013 YTD=11.25 Days
Increased cash flow in one time collections
by $705,177
Total Missing
Orders ( areas
impacted by project)
Ave Days to
Bill these
Encounters
Sum of
Charges
2012 3290 95.45 DAYS $1,845,984.00
29. Lessons Learned
• Test Pilot Invaluable
• Struggled with being able to ID go live date
• 4/15/13 IM 318 orders email- attaching before deleting (no attached order document in CR)
• Communication Opportunities
• Standardization – How search; enter provider
names, how year entered
• Remembering where training resources are
• How to and Valid Order
• Once Live – need to still hear about issues -
continue to improve
• DOB
• Education Opportunities- ongoing
30. Project Closure
• Team Celebration
– Recognition with Sponsor
• Project Owner in place with
accountabilities
• Project Sponsor- seeing the results
• Departments impacted love the new
process
Editor's Notes
The process currently is out of control. To get to a process in control, we determined the significant inputs that would have the greatest impact on achieving control in the process and improvements in capability. We identified a trial solution to see if we could achieve an improved process - the trial solution focuses on eliminating variation in valid order understanding, and handoffs and travel of orders. The trial solution involved POS Scanning of order from electronic holding tank or upon receipt from patient walking in- the order at time of service is scanned to patient ID, real time. The hypothesized result would be improvement – an order in the EMR within customer required time.
Because it is a process that is discrete data, capability analysis beyond the control chart is not appropriate. ( in addition to the fact it is not in control)
In our attempt to quantify the significant inputs and relationships between the input of how much variability there is in our current process of getting orders to Medical records with the orders, we completed a scatter plot and regression analysis comparing the days to get to medical records (variation on how departments get charts with orders to medical records) and to the number of charts missing orders. This demonstrates a high correlation to the longer it takes to get the charts to medical records, the higher chance of missing orders. This demonstrates correlation but not causation. We completed our trial process with standardization of process, and our hypothesis test (slide 32) discussed our results.
The trial solution achieved 0 defects, no missing orders. All orders by the SCI providers to the radiology areas (CT, PET, MRI, RAD, RADMOB) were present in the system. The above graph demonstrates over the 4 week period, we had a total of 103 orders with 100% achieving valid orders in place for coders to code. (the coders were the individuals who measured/determined if valid order was present or not)
During this trial on five separate dates, this individual went to the radiology department and randomly selected 20 patients names that received services on that date, at the end of day shift. Of the randomly selected charts, all had valid orders in place. This was another method to test the capability of the process – valid order for every test in the chart. ( A significant process step, prior to going to Medical Records)
SCI control chart – pre and post new process in pilot (Week 1 - corresponds to the first week in January 2012. Week 58 corresponds the first week in February 2013 when the new process (pilot location) went live)
The p value went from 0.0429 to 0.0075.
Control chart of pilot area since go live date 2/1/2013
All orders to missing orders since the first week in January 2012 through June 1, 2013.
This is all orders to missing orders by week. Week 1 corresponds to the first week in January 2012. Week 67 is the first week we went live with the process to all impacted departments. The trend at week 58 is when we started the pilot in our SCI area (this was an area with a large volume of missing orders).
We have reduced our missing orders rate to 0.74% of all orders since our April 9, 2013 go live date. This is compared to the 6.3% performance rate in 2012. Our baseline sigma level performance was 1.9, our new process since go live on April 9, 2013 has a sigma level performance at 2.4. (This is not quite 2 months into the new process – we learned CVS area training gap, MOBLAB challenges with variation in patient processes and not all providers are able to use Central Repository (only employed or internal areas) at this time.
Due to a greater percentage of patient encounters having the orders in the chart the first time coders enter the chart, average days to bill is improving. Capturing 41% of total charges on encounters that initially were indicated as missing orders, secondary to the actions in place to dig into reason missing/find and get coded. In 2012, we only captured 11% reimbursement rate of the total charges on all encounters with missing orders.
Increase in one time collections ($561 * 1257.10 = 705,177.00).
External provider offices are asking to be able to be a part of this process. We are looking into trying to make this possible.