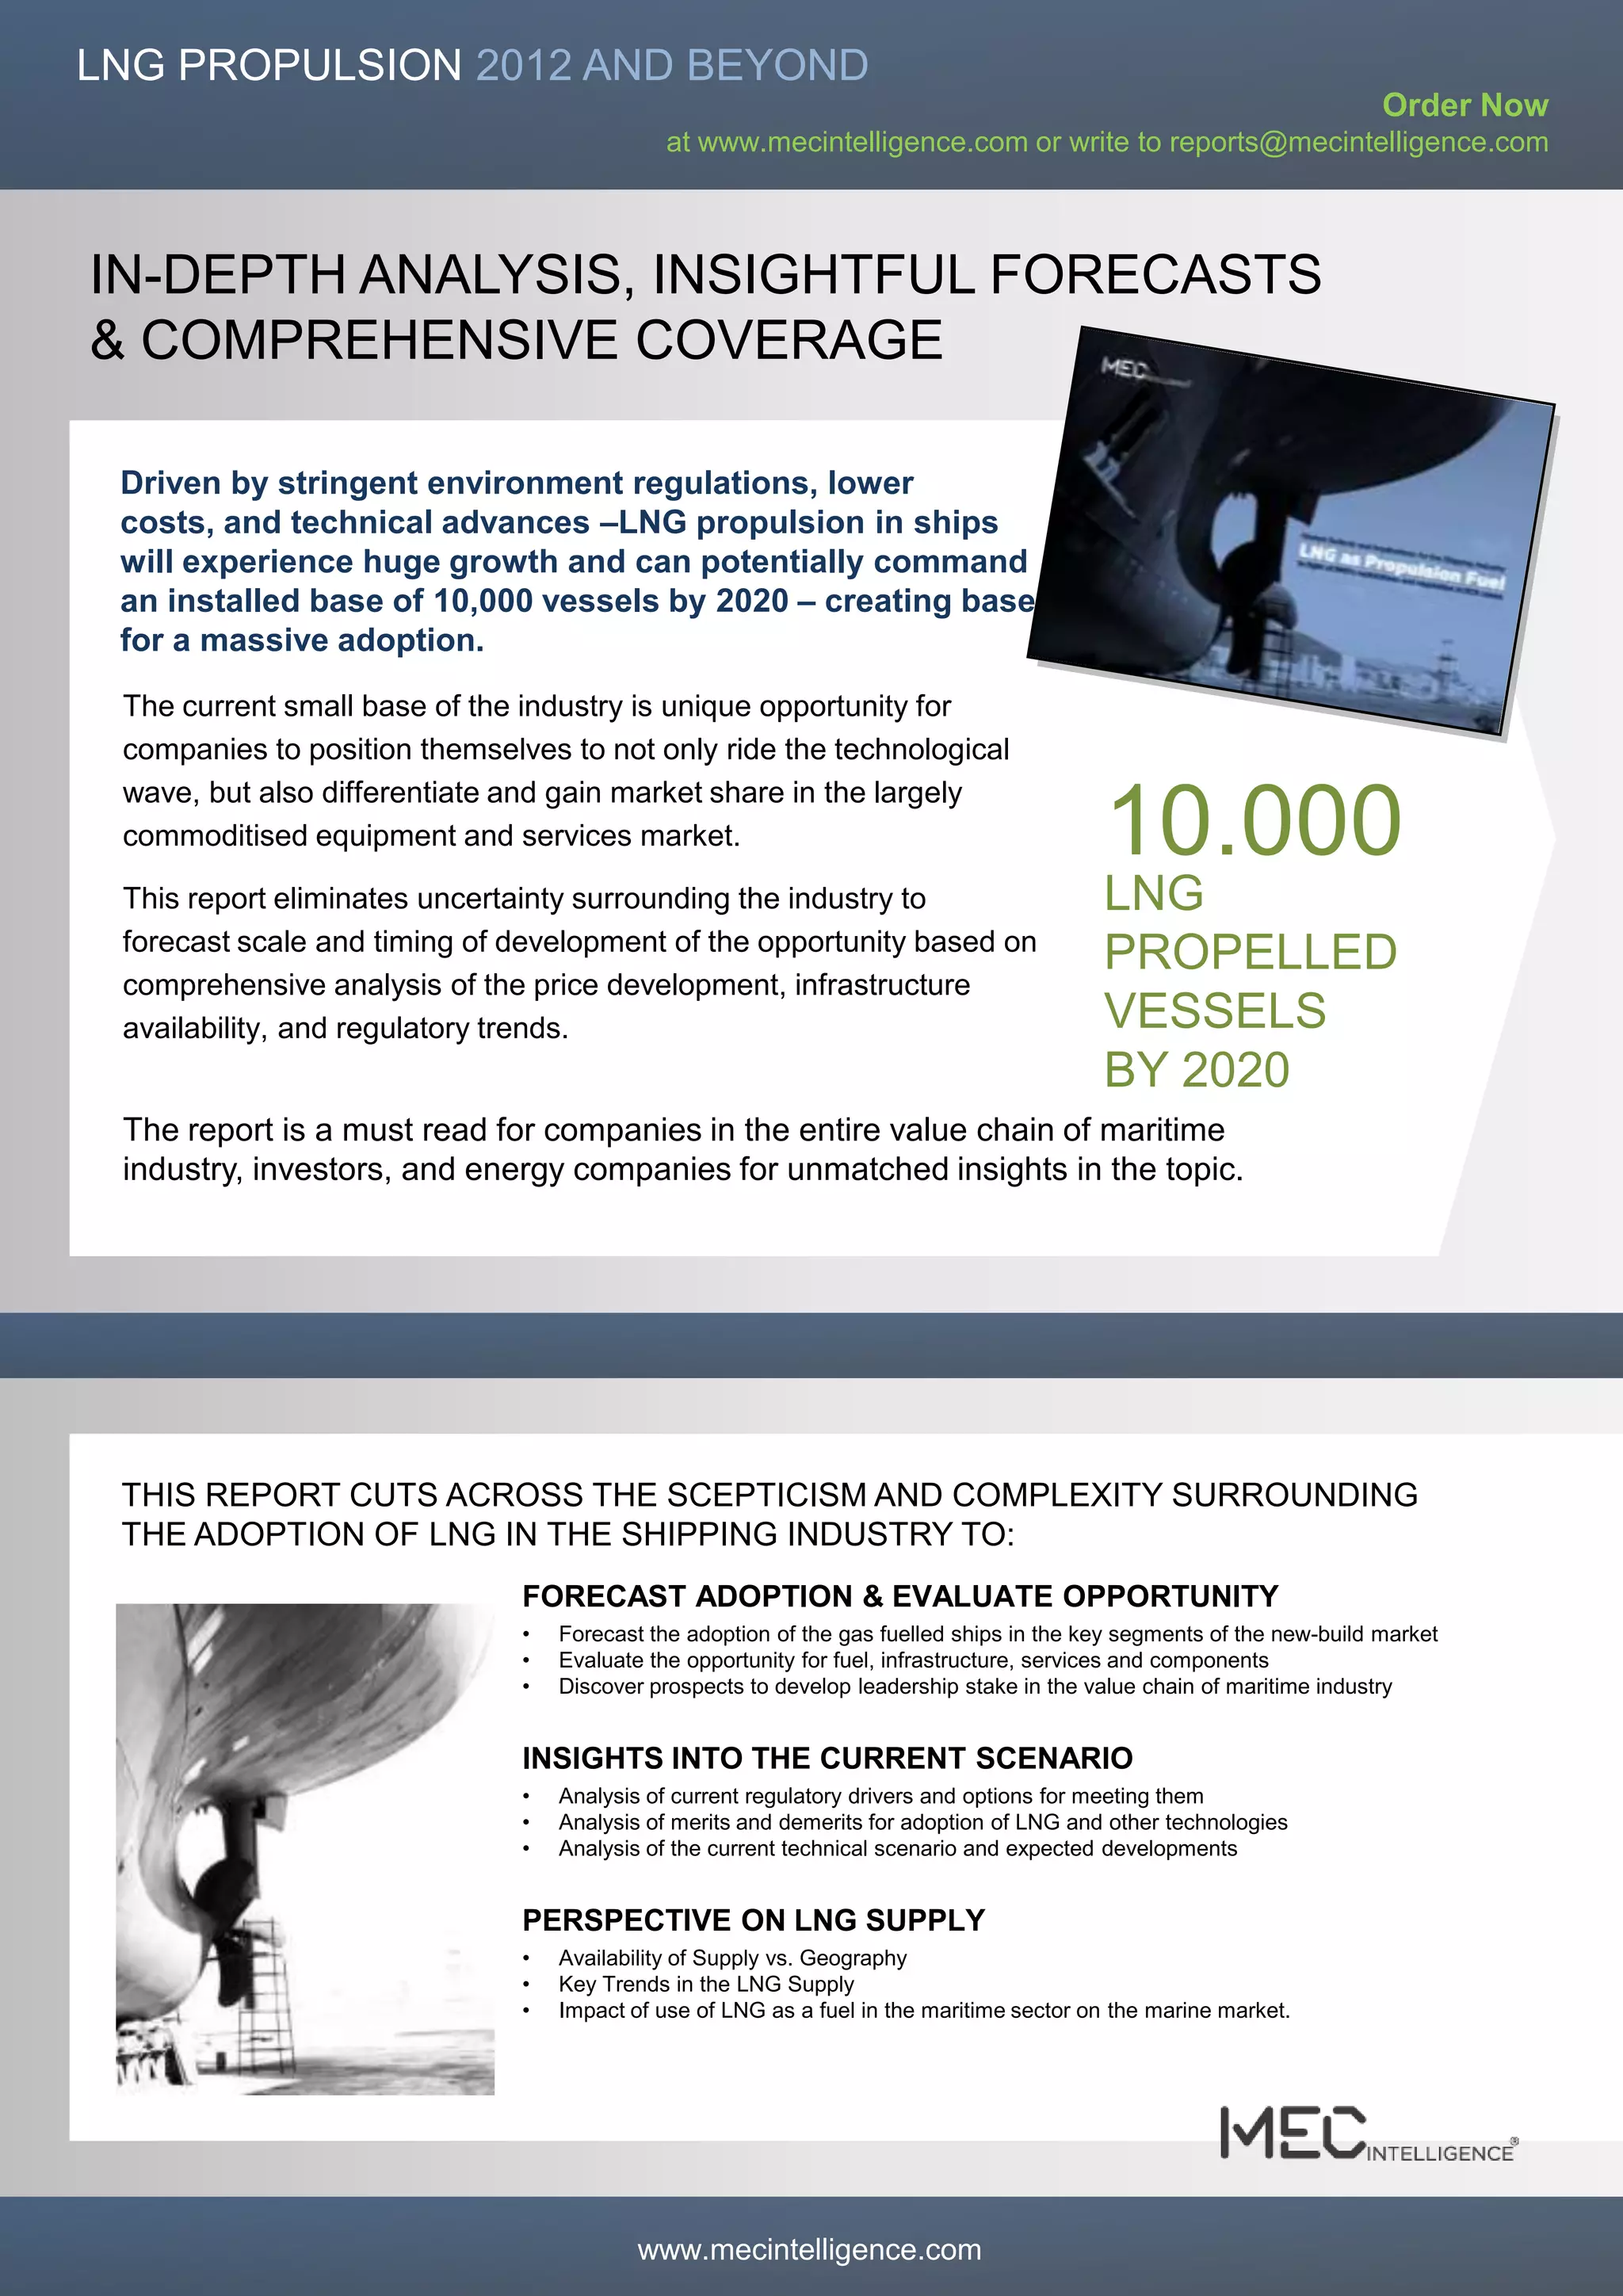
LNG PROPULSION 2012 AND BEYOND
A MEC INTELLIGENCE INSIGHT REPORT ON
LNG AS A MARITIME FUEL                    Order on www.mecintelligence.com


                                    THIS REPORT CUTS
                              ACROSS THE SCEPTICISM
                       AND COMPLEXITY SURROUNDING
                        THE ADOPTION OF LNG AS FUEL
                            IN THE SHIPPING INDUSTRY


  OPEN NOW TO SEE THE HEADLINES IN THE GROUNDBREAKING STUDY
LNG PROPULSION 2012 AND BEYOND
                                                                                                                       Order Now
                                              at www.mecintelligence.com or write to reports@mecintelligence.com


IN-DEPTH ANALYSIS, INSIGHTFUL FORECASTS
& COMPREHENSIVE COVERAGE

 Driven by stringent environment regulations, lower
 costs, and technical advances –LNG propulsion in ships
 will experience huge growth and can potentially command
 an installed base of 10,000 vessels by 2020 – creating base
 for a massive adoption.
 The current small base of the industry is unique opportunity for
 companies to position themselves to not only ride the technological
 wave, but also differentiate and gain market share in the largely
 commoditised equipment and services market.                                              10.000
 This report eliminates uncertainty surrounding the industry to                           LNG
 forecast scale and timing of development of the opportunity based on
                                                                                          PROPELLED
 comprehensive analysis of the price development, infrastructure
 availability, and regulatory trends.                                                     VESSELS
                                                                                          BY 2020
 The report is a must read for companies in the entire value chain of maritime
 industry, investors, and energy companies for unmatched insights in the topic.


 THIS REPORT CUTS ACROSS THE SCEPTICISM AND COMPLEXITY SURROUNDING
 THE ADOPTION OF LNG IN THE SHIPPING INDUSTRY TO:
                               FORECAST ADOPTION & EVALUATE OPPORTUNITY
                               •   Forecast the adoption of the gas fuelled ships in the key segments of the new-build market
                               •   Evaluate the opportunity for fuel, infrastructure, services and components
                               •   Discover prospects to develop leadership stake in the value chain of maritime industry


                               INSIGHTS INTO THE CURRENT SCENARIO
                               •   Analysis of current regulatory drivers and options for meeting them
                               •   Analysis of merits and demerits for adoption of LNG and other technologies
                               •   Analysis of the current technical scenario and expected developments


                               PERSPECTIVE ON LNG SUPPLY
                               •   Availability of Supply vs. Geography
                               •   Key Trends in the LNG Supply
                               •   Impact of use of LNG as a fuel in the maritime sector on the marine market.


                                           www.mecintelligence.com
LNG PROPULSION 2012 AND BEYOND
                                                                                                                        Order Now
                                                at www.mecintelligence.com or write to reports@mecintelligence.com


HEADLINES OF THE REPORT ON LNG AS MARITIME
FUEL
  CONTENTS                                                     LIST OF FIGURES
                                                               Figure 1: IMO Sulphur limits for ship exhaust
                                                               Figure 2: Northern European ECA Zones
  01 EXECUTIVE SUMMARY                                         Figure 3: US ECA Zones
                                                               Figure 4: EU ECA Zones
                                                               Figure 5: North American ECA Zones
  02 BACKGROUND                                                Figure 6: ECA Zones Timeline
                                                               Figure 7: Compliance Options
  •   SOX, NOX and ECA Zones                                   Figure 8: Low Sulphur Overview
  •   Future technology options                                Figure 9: Fuel Overview
  •   Low sulphur fuels                                        Figure 10: Scrubber technology cost assessment
                                                               Figure 11: Historic and Forecast on Fuel Cost Development
  •   Scrubbers                                                Figure 12: Index of Historic and Forecast on Fuel Cost Development
  •   LNG propulsion                                           Figure 13: Trends
  •   Fuel price forecast                                      Figure 14: Emissions across engine type
                                                               Figure 15: Retro-fit overview
                                                               Figure 16: Generic SS Feeder Scenario: Retro-fit Pay-back vs. Cost of
  03 LNG PROPULSION                                            using MGO
                                                               Figure 17: Retro-fit Cost
  •   Trends                                                   Figure 18: Overview of selected vessel segments
  •   Environmental impact vs competing                        Figure 19: Feedermax annual cost (opex plus yearly capex share)
                                                               Figure 20: Post Panamax annual cost (opex plus yearly capex share)
      technologies
                                                               Figure 21: Handymax annual cost (opex plus yearly capex share)
  •   Retrofit vs New-Build                                    Figure 22: Offshore Supply annual cost (opex plus yearly capex share)
  •   Vessel segments                                          Figure 23: Panamax annual cost (opex plus yearly capex share)
  •   Economic perspective to compliance options               Figure 24: Vessel attractiveness matrix
  •   Infrastructure and bunkering processes                   Figure 25: Truck to hip bunkering
                                                               Figure 26: Fixed / Terminal bunkering
                                                               Figure 27: Barge to ship bunkering
  04 LNG MARINE MARKET FORECAST                                Figure 28: Challenges in Infrastructure and bunkering processes
                                                               Figure 29: Current Infrastructure and bunkering facilities in Europe
                                                               Figure 30: Planned Infrastructure and bunkering facilities in Europe
  •   LNG Penetration at current
                                                               Figure 31: LNG bunkering process and flow
  •   LNG Propulsion forecast 2020                             Figure 32: Current SS
  •   LNG Propulsion forecast by segment                       Figure 33: Current DS
  •   LNG Propulsion forecast by regions                       Figure 34: Snapshot of current pure LNG fleet
  •   LNG Fuel market forecast                                 Figure 35: LNG Propelled Vessels [Ratification not delayed]
                                                               Figure 36: LNG Propelled Vessels [Ratification delayed]
                                                               Figure 37: World LNG installed base by Segment
  05 GLOBAL LNG MARKET AND                                     Figure 38: World LNG installed base by Region
  SUPPLY                                                       Figure 39: Annual LNG Fuel Consumption in Fleet
                                                               Figure 40: LNG trade patterns
     PERSPECTIVE                                               Figure 41: Top trade routes
                                                               Figure 42: Top suppliers
  •   LNG trade patterns                                       Figure 43: Top consumers
  •   Current and planned infrastructure by region             Figure 44: EMEA Plants and terminals
                                                               Figure 45: EMEA Top Liquefaction plant owners
  •   Key trends and tendencies in the LNG market
                                                               Figure 46: EMEA Top regasification plant owners
  •   LNG fuel market vs traditional LNG market                Figure 47: NA Plants and terminals
                                                               Figure 48: NA Top Liquefaction plant owners
  06 IMPACT ASSESSMENT                                         Figure 49: NA Top regasification plant owners
                                                               Figure 50: APAC Plants and terminals
                                                               Figure 51: APAC Top Liquefaction plant owners
  •   LNG Eco-System                                           Figure 52: APAC Top regasification plant owners
  •   Development among yards                                  Figure 53: Key trends and tendencies in the LNG market
  •   Future vessel deliveries                                 Figure 54: Impact of LNG as a Fuel relative to the traditional LNG
  •   Marine propulsion development                            market
                                                               Figure 55: LNG Eco-System
  •   Fuel flexibility
                                                               Figure 56: Yard development Europe
                                                               Figure 57: Yard development Asia
                                                               Figure 58: Future vessel deliveries
                                                               Figure 59: Propulsion development
                                                               Figure 60: Key engine Manufacturers
                                                               Figure 61: Fuel flexibility


                                                                                                                                       Page 3

                                             www.mecintelligence.com
ORDER DETAILS
Please order your LNG Propulsion report online at www.mecintelligence.com
or send an e-mail to reports@mecintelligence.com


MEC INTELLIGENCE
MEC Intelligence is a focused market insight company supporting growth by
providing high quality actionable insights for the maritime, energy and cleantech
sectors .


MEC INTELLIGENCE INDIA                        MEC INTELLIGENCE DENMARK
MEC Consulting Pvt. Ltd.                      Nordre Fasanvej 113,2;
Levels 5, 6 and 7 - JMD Regent Square         2000 Frederiksberg.
Mehrauli-Gurgaon Road, Gurgaon                Copenhagen
India                                         Denmark

Tel: +91 9810 53 3550                         Tel: +45 3543 3277
Email: India@mecintelligence.com              Email: Europe@mecintelligence.com

Lng flyer04 final

  • 1.
    LNG PROPULSION 2012AND BEYOND A MEC INTELLIGENCE INSIGHT REPORT ON LNG AS A MARITIME FUEL Order on www.mecintelligence.com THIS REPORT CUTS ACROSS THE SCEPTICISM AND COMPLEXITY SURROUNDING THE ADOPTION OF LNG AS FUEL IN THE SHIPPING INDUSTRY OPEN NOW TO SEE THE HEADLINES IN THE GROUNDBREAKING STUDY
  • 2.
    LNG PROPULSION 2012AND BEYOND Order Now at www.mecintelligence.com or write to reports@mecintelligence.com IN-DEPTH ANALYSIS, INSIGHTFUL FORECASTS & COMPREHENSIVE COVERAGE Driven by stringent environment regulations, lower costs, and technical advances –LNG propulsion in ships will experience huge growth and can potentially command an installed base of 10,000 vessels by 2020 – creating base for a massive adoption. The current small base of the industry is unique opportunity for companies to position themselves to not only ride the technological wave, but also differentiate and gain market share in the largely commoditised equipment and services market. 10.000 This report eliminates uncertainty surrounding the industry to LNG forecast scale and timing of development of the opportunity based on PROPELLED comprehensive analysis of the price development, infrastructure availability, and regulatory trends. VESSELS BY 2020 The report is a must read for companies in the entire value chain of maritime industry, investors, and energy companies for unmatched insights in the topic. THIS REPORT CUTS ACROSS THE SCEPTICISM AND COMPLEXITY SURROUNDING THE ADOPTION OF LNG IN THE SHIPPING INDUSTRY TO: FORECAST ADOPTION & EVALUATE OPPORTUNITY • Forecast the adoption of the gas fuelled ships in the key segments of the new-build market • Evaluate the opportunity for fuel, infrastructure, services and components • Discover prospects to develop leadership stake in the value chain of maritime industry INSIGHTS INTO THE CURRENT SCENARIO • Analysis of current regulatory drivers and options for meeting them • Analysis of merits and demerits for adoption of LNG and other technologies • Analysis of the current technical scenario and expected developments PERSPECTIVE ON LNG SUPPLY • Availability of Supply vs. Geography • Key Trends in the LNG Supply • Impact of use of LNG as a fuel in the maritime sector on the marine market. www.mecintelligence.com
  • 3.
    LNG PROPULSION 2012AND BEYOND Order Now at www.mecintelligence.com or write to reports@mecintelligence.com HEADLINES OF THE REPORT ON LNG AS MARITIME FUEL CONTENTS LIST OF FIGURES Figure 1: IMO Sulphur limits for ship exhaust Figure 2: Northern European ECA Zones 01 EXECUTIVE SUMMARY Figure 3: US ECA Zones Figure 4: EU ECA Zones Figure 5: North American ECA Zones 02 BACKGROUND Figure 6: ECA Zones Timeline Figure 7: Compliance Options • SOX, NOX and ECA Zones Figure 8: Low Sulphur Overview • Future technology options Figure 9: Fuel Overview • Low sulphur fuels Figure 10: Scrubber technology cost assessment Figure 11: Historic and Forecast on Fuel Cost Development • Scrubbers Figure 12: Index of Historic and Forecast on Fuel Cost Development • LNG propulsion Figure 13: Trends • Fuel price forecast Figure 14: Emissions across engine type Figure 15: Retro-fit overview Figure 16: Generic SS Feeder Scenario: Retro-fit Pay-back vs. Cost of 03 LNG PROPULSION using MGO Figure 17: Retro-fit Cost • Trends Figure 18: Overview of selected vessel segments • Environmental impact vs competing Figure 19: Feedermax annual cost (opex plus yearly capex share) Figure 20: Post Panamax annual cost (opex plus yearly capex share) technologies Figure 21: Handymax annual cost (opex plus yearly capex share) • Retrofit vs New-Build Figure 22: Offshore Supply annual cost (opex plus yearly capex share) • Vessel segments Figure 23: Panamax annual cost (opex plus yearly capex share) • Economic perspective to compliance options Figure 24: Vessel attractiveness matrix • Infrastructure and bunkering processes Figure 25: Truck to hip bunkering Figure 26: Fixed / Terminal bunkering Figure 27: Barge to ship bunkering 04 LNG MARINE MARKET FORECAST Figure 28: Challenges in Infrastructure and bunkering processes Figure 29: Current Infrastructure and bunkering facilities in Europe Figure 30: Planned Infrastructure and bunkering facilities in Europe • LNG Penetration at current Figure 31: LNG bunkering process and flow • LNG Propulsion forecast 2020 Figure 32: Current SS • LNG Propulsion forecast by segment Figure 33: Current DS • LNG Propulsion forecast by regions Figure 34: Snapshot of current pure LNG fleet • LNG Fuel market forecast Figure 35: LNG Propelled Vessels [Ratification not delayed] Figure 36: LNG Propelled Vessels [Ratification delayed] Figure 37: World LNG installed base by Segment 05 GLOBAL LNG MARKET AND Figure 38: World LNG installed base by Region SUPPLY Figure 39: Annual LNG Fuel Consumption in Fleet Figure 40: LNG trade patterns PERSPECTIVE Figure 41: Top trade routes Figure 42: Top suppliers • LNG trade patterns Figure 43: Top consumers • Current and planned infrastructure by region Figure 44: EMEA Plants and terminals Figure 45: EMEA Top Liquefaction plant owners • Key trends and tendencies in the LNG market Figure 46: EMEA Top regasification plant owners • LNG fuel market vs traditional LNG market Figure 47: NA Plants and terminals Figure 48: NA Top Liquefaction plant owners 06 IMPACT ASSESSMENT Figure 49: NA Top regasification plant owners Figure 50: APAC Plants and terminals Figure 51: APAC Top Liquefaction plant owners • LNG Eco-System Figure 52: APAC Top regasification plant owners • Development among yards Figure 53: Key trends and tendencies in the LNG market • Future vessel deliveries Figure 54: Impact of LNG as a Fuel relative to the traditional LNG • Marine propulsion development market Figure 55: LNG Eco-System • Fuel flexibility Figure 56: Yard development Europe Figure 57: Yard development Asia Figure 58: Future vessel deliveries Figure 59: Propulsion development Figure 60: Key engine Manufacturers Figure 61: Fuel flexibility Page 3 www.mecintelligence.com
  • 4.
    ORDER DETAILS Please orderyour LNG Propulsion report online at www.mecintelligence.com or send an e-mail to reports@mecintelligence.com MEC INTELLIGENCE MEC Intelligence is a focused market insight company supporting growth by providing high quality actionable insights for the maritime, energy and cleantech sectors . MEC INTELLIGENCE INDIA MEC INTELLIGENCE DENMARK MEC Consulting Pvt. Ltd. Nordre Fasanvej 113,2; Levels 5, 6 and 7 - JMD Regent Square 2000 Frederiksberg. Mehrauli-Gurgaon Road, Gurgaon Copenhagen India Denmark Tel: +91 9810 53 3550 Tel: +45 3543 3277 Email: India@mecintelligence.com Email: Europe@mecintelligence.com