Download to read offline
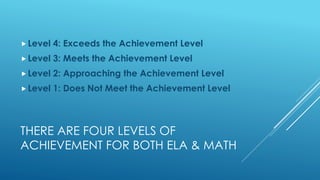
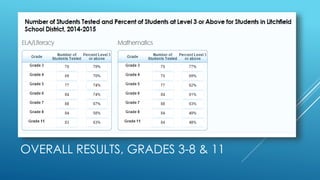
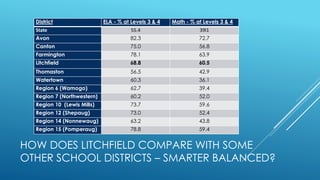

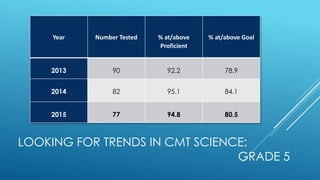
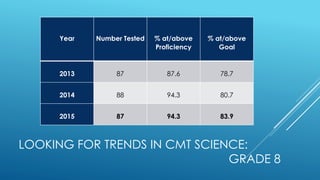

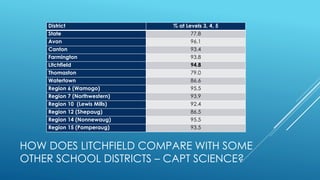
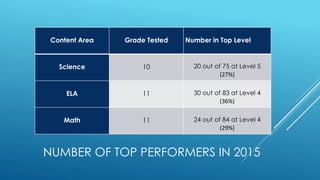

The Smarter Balanced test results for 2015 provide baseline data for student performance in English Language Arts (ELA) and mathematics, with distinct claims and achievement levels. Litchfield's performance is compared to other school districts, showing strengths in ELA at 68.8% and math at 60.5% at levels 3 and 4. Additionally, trends in CMT and CAPT science results indicate consistent proficiency among grades 5, 8, and 10, with Litchfield achieving a 94.8% proficiency rate in science.


![Spring 2011 state assessment results_12.13.11[1]](https://cdn.slidesharecdn.com/ss_thumbnails/spring2011stateassessmentresults12-13-111-120116110011-phpapp01-thumbnail.jpg?width=640&height=640&fit=bounds)


