Liquid Silica trial for greens speed
•
0 likes•88 views

Liquid SC formulation trial to review impact on greens speed

Recommended
Recommended
More Related Content
More from Gilba Solutions Pty Ltd
More from Gilba Solutions Pty Ltd (20)
Recently uploaded
Recently uploaded (20)
Liquid Silica trial for greens speed
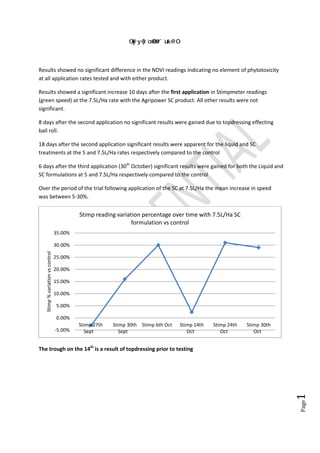
- 1. Page1 Results showed no significant difference in the NDVI readings indicating no element of phytotoxicity at all application rates tested and with either product. Results showed a significant increase 10 days after the first application in Stimpmeter readings (green speed) at the 7.5L/Ha rate with the Agripower SC product. All other results were not significant. 8 days after the second application no significant results were gained due to topdressing effecting ball roll. 18 days after the second application significant results were apparent for the liquid and SC treatments at the 5 and 7.5L/Ha rates respectively compared to the control 6 days after the third application (30th October) significant results were gained for both the Liquid and SC formulations at 5 and 7.5L/Ha respectively compared to the control Over the period of the trial following application of the SC at 7.5L/Ha the mean increase in speed was between 5-30%. The trough on the 14th is a result of topdressing prior to testing -5.00% 0.00% 5.00% 10.00% 15.00% 20.00% 25.00% 30.00% 35.00% Stimp 27th Sept Stimp 30th Sept Stimp 6th Oct Stimp 14th Oct Stimp 24th Oct Stimp 30th Oct Stimp%variationvscontrol Stimp reading variation percentage over time with 7.5L/Ha SC formulation vs control
- 2. Page2 Trial Establishment: 27TH September 2016 Mowing regime: morning of measurements Layout: 8 x 4m x 1m blocks; 50mm buffer between treatments
- 3. Page3 Control Agripower Liquid 5 Agripower Liquid 7.5 Agripower SC 5 Agripower Liquid 5 Agripower Liquid 7.5 Agripower Liquid 2.5 Agripower Liquid 7.5 Agripower SC 2.5 Agripower Liquid 2.5 Agripower SC 2.5 Control Agripower SC 7.5 Agripower SC 7.5 Agripower SC 2.5 Agripower Liquid 5 3000 Agripower SC 5 Control Agripower Liquid 2.5 Agripower SC 2.5 Agripower Liquid 5 2650 Agripower SC 7.5 Agripower Liquid 2.5 2900 Agripower SC 5 Agripower SC 7.5 Agripower SC 5 2100 Agripower Liquid 7.5 Control Products were initially applied on 27th September with follow up applications on 6th October and the 24th October Stimpmeter readings were taken on the 27thth , 30th September and then subsequently on 6th , 14th , 24th and 30th October.
- 4. Page4
- 5. Page5 NDVI Pre application NDVI readings by proposed treatment 0.6 0.62 0.64 0.66 0.68 0.7 0.72 NDVI Pre application turf NDVI readings 0.64 0.65 0.66 0.67 0.68 0.69 Control Agripower SC 2.5 Agripower SC 5 Agripower SC 7.5 Agripower Liquid 2.5 Agripower Liquid 5 Agripower Liquid 7.5 Other 0.67 0.66 0.68 0.69 0.67 0.66 0.68 0.67 Pre treatment Mean NDVI Readings
- 6. Page6 Stimp Readings 0 500 1000 1500 2000 2500 3000 3500 Pre application Stimp readings 0 1000 2000 3000 2373.5 2312.5 2212.5 2306.25 2212.5 2590 2550 2662.5 Pre application Stimpmeter readings cm by proposed treatment
- 7. Page7
- 8. Page8 3 day Post application NDVI Readings 0.68 0.69 0.7 0.71 0.72 Control Agripower SC 2.5 Agripower SC 5 Agripower SC 7.5 Agripower Liquid 2.5 Agripower Liquid 5 Agripower Liquid 7.5 Other 0.70 0.70 0.71 0.70 0.71 0.70 0.69 0.70 Pre treatment Mean NDVI Readings
- 9. Page9 3 day Post application Stimpmeter Readings 1500 1700 1900 2100 2300 2500 2700 2900 Control Agripower SC 2.5 Agripower SC 5 Agripower SC 7.5 Agripower Liquid 2.5 Agripower Liquid 5 Agripower Liquid 7.5 Other Stimpmeter readings cm by treatment pre and 3 day post application
- 10. Page10 0 500 1000 1500 2000 2500 3000 6th April Stimp readings (10 days after initial application) 0 500 1000 1500 2000 2500 3000 Control Agripower SC 2.5 Agripower SC 5 Agripower SC 7.5 Agripower Liquid 2.5 Agripower Liquid 5 Agripower Liquid 7.5 Other Stimpmeter readings cm by treatment pre, 3 day post application and 6th October (10 days post application) Stimp 27th September Stimp 30th September Stimp 6th October
- 11. Page11 0 500 1000 1500 2000 2500 3000 3500 4000 Control Agripower SC 2.5 Agripower SC 5 Agripower SC 7.5 Agripower Liquid 2.5 Agripower Liquid 5 Agripower Liquid 7.5 Box Plot 6th April 0 500 1000 1500 2000 2500 3000 Control Agripower SC 2.5 Agripower SC 5 Agripower SC 7.5 Agripower Liquid 2.5 Agripower Liquid 5 Agripower Liquid 7.5 Chart of means with 1 standard error
- 12. Page12 ANOVA Table: Single Factor Source of Variation: d.f. Sum Squares Mean Squares F Statistic F Critical p-Value Treatments: 1 646,668.78 646,668.78 7.3430 5.9874 0.0351 Error: 6 528,398.94 88,066.49 Total: 7 1,175,067.7 2 Null Hypothesis: The Means of all of the Treatments are Equal. Alternative Hypothesis: Not all of the Means of the Treatments are Equal. F(1,6) Statistic: 7.3430 Critical Value: 5.9874 Alpha: 0.05 p-Value: 0.0351 Decision Rule: Reject the Null Hypothesis if F Statistic > 5.9874 or p-Value < 0.05 Conclusion: Reject the Null Hypothesis Pairwise Test Results: Test Type = Fisher LSD Null Hypothesis: There is no Significant Difference between the Means of each of the Pairs. Alternative Hypothesis: There is a Significant Difference between the Means of each of the Pairs. Pairwise Alpha: 0.05 Differenc e Critical Value Reject Null? Control and Agripower_SC_7.5 568.63 513.4624 Yes
- 13. Page13 14th April - day after topdressing and 8 days post second application 0 500 1000 1500 2000 2500 14th October Stimp readings 0 500 1000 1500 2000 2500 3000 Control Agripower SC 2.5 Agripower SC 5 Agripower SC 7.5 Agripower Liquid 2.5 Agripower Liquid 5 Agripower Liquid 7.5 Other Stimpmeter readings cm by treatment pre, 3 day post application, 6th October (10 days post application) and 14th October (8 days post 2nd application) Stimp 27th September Stimp 30th September Stimp 6th October Stimp 14th October
- 14. Page14 0 500 1000 1500 2000 2500 Control Agripower SC 2.5 Agripower SC 5 Agripower SC 7.5 Agripower Liquid 2.5 Agripower Liquid 5 Agripower Liquid 7.5 Box Plot 14th October post topdressing and 8 days post second application 0 500 1000 1500 2000 2500 Control Agripower SC 2.5 Agripower SC 5 Agripower SC 7.5 Agripower Liquid 2.5 Agripower Liquid 5 Agripower Liquid 7.5 Chart of means with 1 standard error
- 15. Page15 ANOVA Table: Single Factor Source of Variation: d.f. Sum Squares Mean Squares F Statisti c F Critical p- Value Treatments: 6 231,042.86 38,507.14 0.2512 2.5727 0.9533 Error: 21 3,218,781.2 5 153,275.3 0 Total: 27 3,449,824.1 1 Null Hypothesis: The Means of all of the Treatments are Equal. Alternative Hypothesis: Not all of the Means of the Treatments are Equal. F(6,21) Statistic: 0.2512 Critical Value: 2.5727 Alpha: 0.05 p-Value: 0.9533 Decision Rule: Reject the Null Hypothesis if F Statistic > 2.5727 or p- Value < 0.05 Conclusion: Do Not Reject the Null Hypothesis Pairwise Test Results: Test Type = Fisher LSD Null Hypothesis: Their is no Significant Difference between the Means of each of the Pairs. Alternative Hypothesis: Their is a Significant Difference between the Means of each of the Pairs. Pairwise Alpha: 0.05 Differenc e Critical Value Reject Null? Control and Agripower_SC_2.5 206.25 575.7100 No Control and Agripower_SC_5 47.50 575.7100 No Control and Agripower_SC_7.5 46.25 575.7100 No Control and Agripower_Liquid_2.5 66.25 575.7100 No Control and Agripower_Liquid_5 135.00 575.7100 No Control and Agripower_Liquid_7.5 68.75 575.7100 No Agripower_SC_2.5 and Agripower_SC_5 158.75 575.7100 No Agripower_SC_2.5 and Agripower_SC_7.5 252.50 575.7100 No Agripower_SC_2.5 and Agripower_Liquid_2.5 140.00 575.7100 No Agripower_SC_2.5 and Agripower_Liquid_5 71.25 575.7100 No
- 16. Page16 Agripower_SC_2.5 and Agripower_Liquid_7.5 275.00 575.7100 No Agripower_SC_5 and Agripower_SC_7.5 93.75 575.7100 No Agripower_SC_5 and Agripower_Liquid_2.5 18.75 575.7100 No Agripower_SC_5 and Agripower_Liquid_5 87.50 575.7100 No Agripower_SC_5 and Agripower_Liquid_7.5 116.25 575.7100 No Agripower_SC_7.5 and Agripower_Liquid_2.5 112.50 575.7100 No Agripower_SC_7.5 and Agripower_Liquid_5 181.25 575.7100 No Agripower_SC_7.5 and Agripower_Liquid_7.5 22.50 575.7100 No Agripower_Liquid_2.5 and Agripower_Liquid_5 68.75 575.7100 No Agripower_Liquid_2.5 and Agripower_Liquid_7.5 135.00 575.7100 No Agripower_Liquid_5 and Agripower_Liquid_7.5 203.75 575.7100 No
- 17. Page17 24th October – 18 days post second application 0 500 1000 1500 2000 2500 24th October Stimp readings 1500 1700 1900 2100 2300 2500 2700 2900 Control Agripower SC 2.5 Agripower SC 5 Agripower SC 7.5 Agripower Liquid 2.5 Agripower Liquid 5 Agripower Liquid 7.5 Other Stimpmeter readings cm by treatment pre, 3 day post application, 6th October (10 days post application), 14th October (8 days post 2nd application) and 24th October (18 days post second applciation) Stimp 27th Sept Stimp 30th Sept Stimp 6th Oct Stimp 14th Oct Stimp 24th Oct
- 18. Page18 0 500 1000 1500 2000 2500 3000 Control Agripower SC 2.5 Agripower SC 5 Agripower SC 7.5 Agripower Liquid 2.5 Agripower Liquid 5 Agripower Liquid 7.5 Box Plot 24th October - 18 days post second application
- 19. Page19 ANOVA Table: Single Factor Source of Variation: d.f. Sum Squares Mean Squares F Statisti c F Critical p- Value Treatments: 6 1,387,401 .38 231,233.5 6 2.4909 2.5727 0.0559 Error: 21 1,949,422 .94 92,829.66 Total: 27 3,336,824 .31 Null Hypothesis: The Means of all of the Treatments are Equal. Alternative Hypothesis: Not all of the Means of the Treatments are Equal. F(6,21) Statistic: 2.4909 Critical Value: 2.5727 Alpha: 0.05 p-Value: 0.0559 Decision Rule: Reject the Null Hypothesis if F Statistic > 2.5727 or p- Value < 0.05 Conclusion: Do Not Reject the Null Hypothesis Pairwise Test Results: Test Type = Fisher LSD Null Hypothesis: Their is no Significant Difference between the Means of each of the Pairs. Alternative Hypothesis: Their is a Significant Difference between the Means of each of the Pairs. Pairwise Alpha: 0.05 Differe nce Critical Value Reject Null? Control and Agripower_SC_2.5 263.75 448.0341 No Control and Agripower_SC_5 698.75 448.0341 Yes Control and Agripower_SC_7.5 463.75 448.0341 Yes Control and Agripower_Liquid_2.5 227.13 448.0341 No Control and Agripower_Liquid_5 578.75 448.0341 Yes Control and Agripower_Liquid_7.5 516.25 448.0341 Yes Agripower_SC_2.5 and Agripower_SC_5 435.00 448.0341 No Agripower_SC_2.5 and Agripower_SC_7.5 200.00 448.0341 No Agripower_SC_2.5 and Agripower_Liquid_2.5 36.63 448.0341 No Agripower_SC_2.5 and 315.00 448.0341 No
- 20. Page20 Agripower_Liquid_5 Agripower_SC_2.5 and Agripower_Liquid_7.5 252.50 448.0341 No Agripower_SC_5 and Agripower_SC_7.5 235.00 448.0341 No Agripower_SC_5 and Agripower_Liquid_2.5 471.63 448.0341 Yes Agripower_SC_5 and Agripower_Liquid_5 120.00 448.0341 No Agripower_SC_5 and Agripower_Liquid_7.5 182.50 448.0341 No Agripower_SC_7.5 and Agripower_Liquid_2.5 236.63 448.0341 No Agripower_SC_7.5 and Agripower_Liquid_5 115.00 448.0341 No Agripower_SC_7.5 and Agripower_Liquid_7.5 52.50 448.0341 No Agripower_Liquid_2.5 and Agripower_Liquid_5 351.63 448.0341 No Agripower_Liquid_2.5 and Agripower_Liquid_7.5 289.13 448.0341 No Agripower_Liquid_5 and Agripower_Liquid_7.5 62.50 448.0341 No
- 21. Page21 30th October – 6 days post third application 0 500 1000 1500 2000 2500 30th October Stimp readings - 6 days post third applciation 0 500 1000 1500 2000 2500 3000 Control Agripower SC 2.5 Agripower SC 5 Agripower SC 7.5 Agripower Liquid 2.5 Agripower Liquid 5 Agripower Liquid 7.5 Other Stimpreadingmm Stimp reading variation over time Stimp 27th Sept Stimp 30th Sept Stimp 6th Oct Stimp 14th Oct Stimp 24th Oct Stimp 30th Oct
- 22. Page22 0 500 1000 1500 2000 2500 Control Agripower SC 2.5 Agripower SC 5 Agripower SC 7.5 Agripower Liquid 2.5 Agripower Liquid 5 Agripower Liquid 7.5 Box Plot 30th Oct- 6 days post third application
- 23. Page23 ANOVA Table: Single Factor Source of Variation: d.f. Sum Squares Mean Squares F Statisti c F Critical p- Value Treatments: 6 1,146,230 .36 191,038.3 9 2.4577 2.5727 0.0586 Error: 21 1,632,343 .75 77,730.65 Total: 27 2,778,574 .11 Null Hypothesis: The Means of all of the Treatments are Equal. Alternative Hypothesis: Not all of the Means of the Treatments are Equal. F(6,21) Statistic: 2.4577 Critical Value: 2.5727 Alpha: 0.05 p-Value: 0.0586 Decision Rule: Reject the Null Hypothesis if F Statistic > 2.5727 or p- Value < 0.05 Conclusion: Do Not Reject the Null Hypothesis Pairwise Test Results: Test Type = Fisher LSD Null Hypothesis: Their is no Significant Difference between the Means of each of the Pairs. Alternative Hypothesis: Their is a Significant Difference between the Means of each of the Pairs. Pairwise Alpha: 0.05 Differe nce Critical Value Reject Null? Control and Agripower_SC_2.5 260.00 409.9811 No Control and Agripower_SC_5 635.00 409.9811 Yes Control and Agripower_SC_7.5 417.50 409.9811 Yes Control and Agripower_Liquid_2.5 225.00 409.9811 No Control and Agripower_Liquid_5 538.75 409.9811 Yes Control and Agripower_Liquid_7.5 495.00 409.9811 Yes Agripower_SC_2.5 and Agripower_SC_5 375.00 409.9811 No Agripower_SC_2.5 and Agripower_SC_7.5 157.50 409.9811 No Agripower_SC_2.5 and Agripower_Liquid_2.5 35.00 409.9811 No Agripower_SC_2.5 and 278.75 409.9811 No
- 24. Page24 Agripower_Liquid_5 Agripower_SC_2.5 and Agripower_Liquid_7.5 235.00 409.9811 No Agripower_SC_5 and Agripower_SC_7.5 217.50 409.9811 No Agripower_SC_5 and Agripower_Liquid_2.5 410.00 409.9811 Yes Agripower_SC_5 and Agripower_Liquid_5 96.25 409.9811 No Agripower_SC_5 and Agripower_Liquid_7.5 140.00 409.9811 No Agripower_SC_7.5 and Agripower_Liquid_2.5 192.50 409.9811 No Agripower_SC_7.5 and Agripower_Liquid_5 121.25 409.9811 No Agripower_SC_7.5 and Agripower_Liquid_7.5 77.50 409.9811 No Agripower_Liquid_2.5 and Agripower_Liquid_5 313.75 409.9811 No Agripower_Liquid_2.5 and Agripower_Liquid_7.5 270.00 409.9811 No Agripower_Liquid_5 and Agripower_Liquid_7.5 43.75 409.9811 No