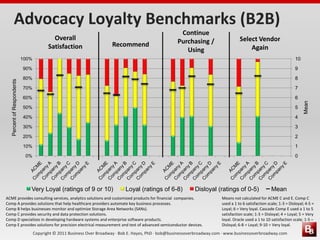
CUSTOMER RELATIONSHIP
DIAGNOSTIC (CRD)
SUMMARY RESULTS FOR ACME COMPANY
BOB E. HAYES, PHD
BUSINESS OVER BROADWAY
Copyright © 2011 Business Over Broadway · Bob E. Hayes, PhD · bob@businessoverbroadway.com · www.businessoverbroadway.com
Overview
 Executive Summary
 Respondent Profile
 Customer Loyalty Dashboard
 Customer Loyalty
 Customer Experience
 Driver Matrix
 Advocacy, Purchasing, Retention
 Revenue
 At risk
 Potential revenue growth
 Product Quality
 Benchmarks
 Advocacy, Purchasing, Retention
Copyright © 2011 Business Over Broadway · Bob E. Hayes, PhD · bob@businessoverbroadway.com · www.businessoverbroadway.com
Executive Summary - Method
 ACME’s customers were surveyed from Jan 20 through Feb 3,
2011 (400 Accounts with 4500 Contacts)
 Web-based survey with email invitation and two reminder
emails
 Response rate:
 540 Contacts responded (12% response rate)
 272 Accounts responded (68% response rate)
 Survey Content:
 RAPID loyalty questions and customer experience
questions
 Decision status, Job level
 Compared to competition
Copyright © 2011 Business Over Broadway · Bob E. Hayes, PhD · bob@businessoverbroadway.com · www.businessoverbroadway.com
Executive Summary - Conclusions
 ACME customers are not extremely loyal to
ACME
 Much room for improvement across all components of
customer loyalty (Advocacy, Purchasing, Retention)
 80% are satisfied but less than half will buy different/new
product (41%) or expand their usage of ACME products in
the company (44%)
 Customer Loyalty Impacts Revenue
 Annual revenue growth through word-of-mouth is
$272,500.00
 Annual revenue growth through up/cross-selling is
$168,000.00
 Annual revenue at risk due to churn is $488,000.00
Copyright © 2011 Business Over Broadway · Bob E. Hayes, PhD · bob@businessoverbroadway.com · www.businessoverbroadway.com
Executive Summary - Conclusions
 Improving revenue starts with improving these areas of the
customer experience
 Overall Product Quality, Future Product/Company Direction and
Communication from Company
 Large ROI and net revenue is expected if company improves
future product/company direction
 40% of customers say products do not have enough
functionality
 Product A is rated better than Product B and Product C
Product Quality
Future Product/
Company Direction
Communication
from Company
Saved/Additional Revenue $ (52,771.88) $263,624.35 $98,396.10
Cost to correct (goal of 0% dissatisfaction) $45,000.00 $50,000.00 $15,000.00
Net Revenue (Saved/Add Rev - Cost) $(97,771.88) $213,624.35 $83,396.10
ROI (Saved/Add Rev / Cost) -217% 427% 556%
Copyright © 2011 Business Over Broadway · Bob E. Hayes, PhD · bob@businessoverbroadway.com · www.businessoverbroadway.com
Executive Summary - Conclusions
 ACME’s overall performance is considered typical by
their customers
 Industry Percentile Rank is estimated to be 54th percentile
 Compared to companies in other industries, ACME
tends to fall at the low end of the distribution with
respect to advocacy loyalty and purchasing loyalty
Copyright © 2011 Business Over Broadway · Bob E. Hayes, PhD · bob@businessoverbroadway.com · www.businessoverbroadway.com
Respondent Profile
Primary
Decision
Maker
12%
Decision
Influencer
66%
No Influence
22%
Executive (C-
level, VP, Man
aging
Director)
22%
Director
11%
Manager
(with direct
reports)
35%
Individual
Contributor
(no direct
reports)
32%
1. Most of the respondents have an influence
in buying decisions (decision influencers =
66%; primary decision makers = 12%);
2. Only difference across three groups is
respondents with “no influence” reported
higher advocacy loyalty
1. Most of the survey respondents are
Managers and Individual Contributors
(67%). Director and Executive level
respondents make up 33% of the sample.
2. No statistically significant difference on any
key metrics.
Copyright © 2011 Business Over Broadway · Bob E. Hayes, PhD · bob@businessoverbroadway.com · www.businessoverbroadway.com
Customer Loyalty Dashboard
Customer Loyalty Metrics1
Advocacy Loyalty Percent Positive
Satisfied 79%
Select vendor again 71%
Recommend 72%
Continue using 76%
Purchasing Loyalty Percent Positive
Purchase different or new 41%
Expand usage 44%
Retention Loyalty Percent Positive
Not leave / Stop using2 69%
1 Customer Loyalty measured by RAPID loyalty approach. Please see Business Over Broadway for details. Percent Positive ratings reflect
percent of customers who gave ratings of 6 or greater (on a 0-10 scale).
2 Percent positive reflect percent of respondents reporting they are unlikely to stop using ACME.
1. Retention: Most
customers did not indicate
they would stop using
ACME (69%)
2. Advocacy: Most customers
said they are satisfied
(79%) and will likely
recommend ACME (72%)
3. Purchasing: Less than 50%
of customers said they will
likely purchase
different/new services
(41%) and expand usage of
ACME (44% ).
ACME Loyalty Summary
Copyright © 2011 Business Over Broadway · Bob E. Hayes, PhD · bob@businessoverbroadway.com · www.businessoverbroadway.com
0
1
2
3
4
5
6
7
8
9
10
0%
10%
20%
30%
40%
50%
60%
70%
80%
90%
100%
Overall
Satisfaction
Choose again Recommend Continue using Purchase
different or new
Expand usage Stop using*
Average
PercentofRespondents
Ratings of 9 or 10 Ratings of 6-8 Ratings of 0-5 Average
Ratings are on a 0 (Not at all likely) to 10 (Extremely likely) scale; For Overall Satisfaction, ratings are on a 0 (Extremely Dissatisfied) to 10
(Extremely Satisfied) scale. Results based on 540 completed surveys. * Reverse scores so higher scores mean higher retention loyalty.
 Customers report higher advocacy and retention loyalty than
purchasing loyalty
Customer Loyalty
Advocacy
Loyalty
Purchasing
Loyalty
Retention
Loyalty
Copyright © 2011 Business Over Broadway · Bob E. Hayes, PhD · bob@businessoverbroadway.com · www.businessoverbroadway.com
0
1
2
3
4
5
6
7
8
9
10
0%
10%
20%
30%
40%
50%
60%
70%
80%
90%
100%
Ease of doing
business
Overall Product
Quality
Responsiveness to
Service Needs
Responsiveness to
Technical Problems
Ability to Resolve
Technical Problems
Communications
from the Company
Future
Product/Company
Direction
Average
PercentofRespondents
Ratings of 9 or 10 Ratings of 6-8 Ratings of 0-5 Average
Ratings are on a 0 (Extremely Dissatisfied) to 10 (Extremely Satisfied) scale. Results based on 257 completed surveys.
 Around 70-80% of customers are satisfied with the customer
experience
 Except for Communication and Future Product/Company Direction
Customer Experience
Copyright © 2011 Business Over Broadway · Bob E. Hayes, PhD · bob@businessoverbroadway.com · www.businessoverbroadway.com
Examine each business area’s
performance and impact on
loyalty simultaneously.
1. Key Drivers – Invest in areas
to increase Customer
Loyalty.
2. Hidden Drivers – Use
features in marketing to
grow customer base.
3. Visible Drivers – Consider
features in marketing to
grow customer base.
4. Weak Drivers – Monitor as
lowest priority for
investment.
Driver Matrix
Copyright © 2011 Business Over Broadway · Bob E. Hayes, PhD · bob@businessoverbroadway.com · www.businessoverbroadway.com
 Predicting Advocacy Loyalty
0.50
0.55
0.60
0.65
0.70
0.75
0.80
0.85
5.25 5.75 6.25 6.75 7.25 7.75
ImpactonAdvocacyLoyalty
(correlationbetweenbusinessattributes
andAdvocacyLoyaltyIndex)
Performance on Business Attribute
(Customer Rating)
Advocacy Loyalty Index is the average of the following four questions (Overall, Satisfaction, Recommend, Select vendor again, Continue using).
To improve advocacy
loyalty, you may consider
focusing on following
areas:
1. Overall Product
Quality
Driver Matrix: Improvement Areas
Copyright © 2011 Business Over Broadway · Bob E. Hayes, PhD · bob@businessoverbroadway.com · www.businessoverbroadway.com
 Predicting Advocacy Loyalty
To focus marketing
message, you may
consider leveraging
following areas:
1. Ease of doing
business
2. Responsiveness to
technical problems
3. Responsiveness to
service needs
4. Ability to resolve
technical problems0.50
0.55
0.60
0.65
0.70
0.75
0.80
0.85
5.25 5.75 6.25 6.75 7.25 7.75
ImpactonAdvocacyLoyalty
(correlationbetweenbusinessattributes
andAdvocacyLoyaltyIndex)
Performance on Business Attribute
(Customer Rating)
Advocacy Loyalty Index is the average of the following four questions (Overall, Satisfaction, Recommend, Select vendor again, Continue using).
Driver Matrix: Marketing Messages
Copyright © 2011 Business Over Broadway · Bob E. Hayes, PhD · bob@businessoverbroadway.com · www.businessoverbroadway.com
Business Attribute
Performance1
(Average
Rating)
Impact2 on
Advocacy
Loyalty
Ease of doing business 6.90 .72
Overall Product Quality 6.65 .83
Responsiveness to Service Needs 7.08 .62
Responsiveness to Technical Problems 7.19 .62
Ability to Resolve Technical Problems 7.03 .59
Communications from the Company 6.68 .64
Future Product/Company Direction 5.69 .64
ImproveLeverage Consider
1 Performance of each attribute is the average rating for each attribute across all respondents. Possible scores range from 0 (Extremely Dissatisfied)
to 10 (Extremely Satisfied); 2 Impact is the correlation between specific Business Attribute sand Advocacy Loyalty Index.
 Improving Advocacy Loyalty
Improving and Marketing ACME
Copyright © 2011 Business Over Broadway · Bob E. Hayes, PhD · bob@businessoverbroadway.com · www.businessoverbroadway.com
 Predicting Purchasing Loyalty
Purchasing Loyalty Index is the average of the following two questions (Purchase different or new, Expand usage).
0.20
0.25
0.30
0.35
0.40
0.45
0.50
5.25 5.75 6.25 6.75 7.25 7.75
ImpactonPurchasingLoyalty
(correlationbetweenbusinessattributes
andPurchasingLoyaltyIndex)
Performance on Business Attribute
(Customer Rating)
To improve purchasing
loyalty, you may consider
focusing on following
areas:
1. Communications from
the Company
2. Overall Product
Quality
3. Future Product/
Company Direction
Driver Matrix: Improvement Areas
Copyright © 2011 Business Over Broadway · Bob E. Hayes, PhD · bob@businessoverbroadway.com · www.businessoverbroadway.com
 Predicting Purchasing Loyalty
To focus marketing
message, you may consider
leveraging following areas:
1. Ability to resolve
technical problems
2. Responsiveness to
Technical Problems
3. Ease of doing business
4. Responsiveness to
Service Needs
0.20
0.25
0.30
0.35
0.40
0.45
0.50
5.25 5.75 6.25 6.75 7.25 7.75
ImpactonPurchasingLoyalty
(correlationbetweenbusinessattributes
andPurchasingLoyaltyIndex)
Performance on Business Attribute
(Customer Rating)
Purchasing Loyalty Index is the average of the following two questions (Purchase different or new, Expand usage).
Driver Matrix: Marketing Messages
Copyright © 2011 Business Over Broadway · Bob E. Hayes, PhD · bob@businessoverbroadway.com · www.businessoverbroadway.com
Business Attribute
Performance1
(Average
Rating)
Impact2 on
Purchasing
Loyalty
Ease of doing business 6.90 .29
Overall Product Quality 6.65 .44
Responsiveness to Service Needs 7.08 .25
Responsiveness to Technical Problems 7.19 .33
Ability to Resolve Technical Problems 7.03 .35
Communications from the Company 6.68 .40
Future Product/Company Direction 5.69 .39
ImproveLeverage Consider
1 Performance of each attribute is the average rating for each attribute across all respondents. Possible scores range from 0 (Extremely Dissatisfied)
to 10 (Extremely Satisfied); 2 Impact is the correlation between specific Business Attribute sand Purchasing Loyalty Index.
 Improving Purchasing Loyalty
Improving and Marketing ACME
Copyright © 2011 Business Over Broadway · Bob E. Hayes, PhD · bob@businessoverbroadway.com · www.businessoverbroadway.com
 Predicting Retention Loyalty
To improve retention
loyalty, you may consider
focusing on following
areas:
1. Overall Product
Quality
2. Future Product/
Company Direction
Retention Loyalty Index is the average of the following question (Stop using)
0.00
0.05
0.10
0.15
0.20
0.25
0.30
0.35
0.40
5.25 5.75 6.25 6.75 7.25 7.75
ImpactonRetentionLoyalty
(correlationbetweenbusinessattributes
andRetentionLoyaltyIndex)
Performance on Business Attribute
(Customer Rating)
Driver Matrix: Improvement Areas
Copyright © 2011 Business Over Broadway · Bob E. Hayes, PhD · bob@businessoverbroadway.com · www.businessoverbroadway.com
To focus marketing
message, you may consider
leveraging following areas:
1. Ability to Resolve
Technical Problems
2. Responsiveness to
Technical Problems
3. Responsiveness to
Service Needs
4. Ease of doing business
 Predicting Retention Loyalty
Retention Loyalty Index is the average of the following question (Stop using)
0.00
0.05
0.10
0.15
0.20
0.25
0.30
0.35
0.40
5.25 5.75 6.25 6.75 7.25 7.75
ImpactonRetentionLoyalty
(correlationbetweenbusinessattributes
andRetentionLoyaltyIndex)
Performance on Business Attribute
(Customer Rating)
Driver Matrix: Marketing Messages
Copyright © 2011 Business Over Broadway · Bob E. Hayes, PhD · bob@businessoverbroadway.com · www.businessoverbroadway.com
1 Performance of each attribute is the average rating for each attribute across all respondents. Possible scores range from 1 (Extremely Dissatisfied)
to 10 (Extremely Satisfied); 2 Impact is the correlation between specific Business Attribute sand Customer Loyalty.
 Improving Retention Loyalty
Business Attribute
Performance1
(Average
Rating)
Impact2 on
Retention
Loyalty
Ease of doing business 6.90 .19
Overall Product Quality 6.65 .26
Responsiveness to Service Needs 7.08 .19
Responsiveness to Technical Problems 7.19 .27
Ability to Resolve Technical Problems 7.03 .27
Communications from the Company 6.68 .17
Future Product/Company Direction 5.69 .30
ImproveLeverage Consider
Improving and Marketing ACME
Copyright © 2011 Business Over Broadway · Bob E. Hayes, PhD · bob@businessoverbroadway.com · www.businessoverbroadway.com
Loyalty Impacts Expected Revenue
 Revenue growth through word-of-mouth
(new customers)
 $272,500.001
 Revenue at risk due to churn
 $448,000.002
 Revenue growth through up/cross-sell
(existing customers)
 $168,000.003
1 Expected revenue from new customers is based on 14.2% of customers recommending ACME, on average, to 7.5 friends/colleagues and a
conversion rate of 2% with an annual average revenue per new customer of $10,000.
2 Expected annual revenue loss is based on 2.8% estimated churn rate and an annual average revenue per customer of $40,000.
3 Expected annual revenue growth from current customers is based on a 4.2% estimated up/cross-sell rate and an annual up/cross-sell
estimate of $10,000.
Copyright © 2011 Business Over Broadway · Bob E. Hayes, PhD · bob@businessoverbroadway.com · www.businessoverbroadway.com
Impact of Improvement Efforts
 Improvements start with key drivers of customer
loyalty
 Product Quality, Future Product/ACME Direction, ACME
Communication
 Large ROI and net revenue is expected if company
improves future product/company direction
Product Quality
Future Product/
ACME Direction
Communication
from ACME
Saved/Additional Revenue $ (52,771.88) $263,624.35 $98,396.10
Cost to correct (goal of 0% dissat) $45,000.00 $50,000.00 $15,000.00
Net Revenue (Saved/Add Rev - Cost) $(97,771.88) $213,624.35 $83,396.10
ROI (Saved/Add Rev / Cost) -217% 427% 556%
Copyright © 2011 Business Over Broadway · Bob E. Hayes, PhD · bob@businessoverbroadway.com · www.businessoverbroadway.com
1 Importance measured by correlation between business attribute and customer loyalty metric. Ranking conducted within a specific loyalty metric.
Drivers of Customer Loyalty
 Customer experience has a much greater impact on advocacy
loyalty than on purchasing or retention loyalty
.00
.10
.20
.30
.40
.50
.60
.70
.80
.90
Ease of doing
business
Overall Product
Quality
Responsiveness to
Service Needs
Responsiveness to
Technical
Problems
Ability to Resolve
Technical
Problems
Communications
from the Company
Future
Product/Company
Direction
ImpactonLoyaltyMetric
(correlationbetweenbusinessattributes
andloyaltymetric)
Advocacy Loyalty
Purchasing Loyalty
Retention Loyalty
Copyright © 2011 Business Over Broadway · Bob E. Hayes, PhD · bob@businessoverbroadway.com · www.businessoverbroadway.com
Top Drivers of Loyalty
Business Attribute (BA)
Advocacy
Loyalty
Purchasing
Loyalty
Retention
Loyalty
Ease of doing business 2 6 5
Overall Product Quality 1 1 4
Responsiveness to Service Needs 5 7 6
Responsiveness to Technical Problems 5 4 3
Ability to Resolve Technical Problems 7 5 2
Communications from the Company 3 2 7
Future Product/Company Direction 4 3 1
1 Rank is based on correlation between business attribute and customer loyalty metric. Ranking conducted within a specific loyalty metric. Ranking of
1 indicates highest correlation between that business attribute and the measure of customer loyalty.
Top Drivers of Customer Loyalty
 Business attributes impact customer loyalty
components differently
Copyright © 2011 Business Over Broadway · Bob E. Hayes, PhD · bob@businessoverbroadway.com · www.businessoverbroadway.com
Product Functionality
 About 40% of respondents indicated ACME products do not
have enough functionality
 About 14% indicated ACME products have too much
functionality
0%
5%
10%
15%
20%
25%
30%
35%
40%
45%
50%
1 - Not enough
functionality
2 3 4 - Right amount
of functionality
5 6 7 - Too much
functionality
PercentofCustomers
Copyright © 2011 Business Over Broadway · Bob E. Hayes, PhD · bob@businessoverbroadway.com · www.businessoverbroadway.com
Product Functionality
 Too little product functionality has a deleterious effect on key customer
metrics. Too much functionality does not adversely impact key customer
metrics
0
1
2
3
4
5
6
7
8
9
ALI PLI RLI Ease of doing
business
Overall Product
Quality
Responsiveness to
Service Needs
Responsiveness to
Technical Problems
Ability to Resolve
Technical Problems
Communications
from the Company
Future
Product/Company
Direction
Loyalty/Satisfaction
Not enough (ratings of 1-2)
Right amount (ratings of 3-5)
Too much (ratings of 6-7)
Product functionality measured on a 1-7 scale; where 1 = Not enough functionality; 4 = Right amount of functionality, 7 = Too much functionality.
Copyright © 2011 Business Over Broadway · Bob E. Hayes, PhD · bob@businessoverbroadway.com · www.businessoverbroadway.com
Product Quality and Combinations
 Have enough data to assess three products
 Prod A, Prod B, and Prod C
 Prod C receives higher ratings than Prod A or Prod B
7.01
6.03
8.30
6.54
6.26
7.30
4.0
5.0
6.0
7.0
8.0
9.0
10.0
Product A
Only
Product B
Only
Product C
Only
Product A
with B
Product A
with C
Product B
with C
Satisfactionwith
ProductQuality
Copyright © 2011 Business Over Broadway · Bob E. Hayes, PhD · bob@businessoverbroadway.com · www.businessoverbroadway.com
Competitors used by Customers
 Nearly half (49%) of ACME customers say they use
competitor’s products in their organization
0%
10%
20%
30%
40%
50%
60%
70%
80%
A B C D E F G H Other
PercentofCustomers1
Competitor
1 Percent based on only those respondents who indicated they use competitor’s products in their company.
Copyright © 2011 Business Over Broadway · Bob E. Hayes, PhD · bob@businessoverbroadway.com · www.businessoverbroadway.com
ACME Compared to Competitors
6%
16%
37%
40%
2%
0%
5%
10%
15%
20%
25%
30%
35%
40%
45%
Worse than allBetter than someAbout the same as othersBetter than mostBetter than all
PercentofRespondents
What best describes our performance
compared to the competitors you use?
(0 + 400 + 1850 + 3000
+ 200) / 100 = 54.5
Percentile
Value
% of
Customers
0 6
25 16
50 37
75 40
100 2
ACME’s Percentile
Performance Rank
50% < 54%< 58%
Copyright © 2011 Business Over Broadway · Bob E. Hayes, PhD · bob@businessoverbroadway.com · www.businessoverbroadway.com
Competitive Ranking Estimates
36%
50%
51%
52%
54%
55%
55%
56%
62%
0% 20% 40% 60% 80%
Competitor H*
Competitor G
Competitor F
Competitor E
ALL COMPETITORS
Competitor D
Competitor C
Competitor B
Competitor A
Customer Estimate of ACME’s Percentile Rank
ACME’s percentile
ranking is not adversely
impacted by presence
of most competitors –
ACME’s ranking is
comparable to most
competitors.
Competitor H’s
presence in ACME’s
Accounts has significant
negative impact on
customers’ perception
of ACME’s
performance.
ACME’s Percentile Rank
when competitors are present
* Statistically significant difference between ACME customers who are using Competitor H and those who are not using Competitor H.
Copyright © 2011 Business Over Broadway · Bob E. Hayes, PhD · bob@businessoverbroadway.com · www.businessoverbroadway.com
Advocacy Loyalty Benchmarks (B2B)
0
1
2
3
4
5
6
7
8
9
10
0%
10%
20%
30%
40%
50%
60%
70%
80%
90%
100%
Mean
PercentofRespondents
Very Loyal (ratings of 9 or 10) Loyal (ratings of 6-8) Disloyal (ratings of 0-5) Mean
Overall
Satisfaction Recommend
Continue
Purchasing /
Using
Select Vendor
Again
Means not calculated for ACME C and E. Comp C
used a 1 to 6 satisfaction scale; 1-3 = Disloyal; 4-5 =
Loyal; 6 = Very loyal. Cascade Comp E used a 1 to 5
satisfaction scale; 1-3 = Disloyal; 4 = Loyal; 5 = Very
loyal. Oracle used a 1 to 10 satisfaction scale; 1-5 –
Disloyal; 6-8 = Loyal; 9-10 = Very loyal.
ACME provides consulting services, analytics solutions and customized products for financial companies.
Comp A provides solutions that help healthcare providers automate key business processes.
Comp B helps businesses monitor and optimize Storage Area Networks (SANs).
Comp C provides security and data protection solutions.
Comp D specializes in developing hardware systems and enterprise software products.
Comp E provides solutions for precision electrical measurement and test of advanced semiconductor devices.
Copyright © 2011 Business Over Broadway · Bob E. Hayes, PhD · bob@businessoverbroadway.com · www.businessoverbroadway.com
Purchasing Loyalty
0
1
2
3
4
5
6
7
8
9
10
0%
10%
20%
30%
40%
50%
60%
70%
80%
90%
100%
ACME Company A Company B
Mean
PercentofRespondents
Very Loyal (ratings of 9 or 10) Loyal (ratings of 6-8) Disloyal (ratings of 0-5) Mean
Purchase additional/different types of services
ACME provides consulting services, analytics solutions and customized products for financial companies.
Comp A provides solutions that help healthcare providers automate key business processes.
Comp B helps businesses monitor and optimize Storage Area Networks (SANs).
Copyright © 2011 Business Over Broadway · Bob E. Hayes, PhD · bob@businessoverbroadway.com · www.businessoverbroadway.com
Retention Loyalty
*For this question, ratings are reverse coded to facilitate presentation: green indicates ratings of 0 thru 1 (highly unlikely to leave); yellow indicates
ratings of 2 thru 4 (unlikely to leave); red indicates ratings of 5 thru 10.
0
1
2
3
4
5
6
7
8
9
10
0%
10%
20%
30%
40%
50%
60%
70%
80%
90%
100%
ACME Company A
Mean
PercentofRespondents
Very Loyal (ratings of 9 or 10) Loyal (ratings of 6-8) Disloyal (ratings of 0-5) Mean
Not Leave / Stop Using*
ACME provides consulting services, analytics solutions and customized products for financial companies.
Comp A provides solutions that help healthcare providers automate key business processes.
Copyright © 2011 Business Over Broadway · Bob E. Hayes, PhD · bob@businessoverbroadway.com · www.businessoverbroadway.com
For More Information
Bob E. Hayes, Ph.D.
Email: bob@businessoverbroadway.com
Web: www.businessoverbroadway.com
Blog: www.businessoverbroadway.com/blog
Twitter: www.twitter.com/bobehayes

Customer Relationship Diagnostic: Sample Report

  • 1.
    CUSTOMER RELATIONSHIP DIAGNOSTIC (CRD) SUMMARYRESULTS FOR ACME COMPANY BOB E. HAYES, PHD BUSINESS OVER BROADWAY
  • 2.
    Copyright © 2011Business Over Broadway · Bob E. Hayes, PhD · bob@businessoverbroadway.com · www.businessoverbroadway.com Overview  Executive Summary  Respondent Profile  Customer Loyalty Dashboard  Customer Loyalty  Customer Experience  Driver Matrix  Advocacy, Purchasing, Retention  Revenue  At risk  Potential revenue growth  Product Quality  Benchmarks  Advocacy, Purchasing, Retention
  • 3.
    Copyright © 2011Business Over Broadway · Bob E. Hayes, PhD · bob@businessoverbroadway.com · www.businessoverbroadway.com Executive Summary - Method  ACME’s customers were surveyed from Jan 20 through Feb 3, 2011 (400 Accounts with 4500 Contacts)  Web-based survey with email invitation and two reminder emails  Response rate:  540 Contacts responded (12% response rate)  272 Accounts responded (68% response rate)  Survey Content:  RAPID loyalty questions and customer experience questions  Decision status, Job level  Compared to competition
  • 4.
    Copyright © 2011Business Over Broadway · Bob E. Hayes, PhD · bob@businessoverbroadway.com · www.businessoverbroadway.com Executive Summary - Conclusions  ACME customers are not extremely loyal to ACME  Much room for improvement across all components of customer loyalty (Advocacy, Purchasing, Retention)  80% are satisfied but less than half will buy different/new product (41%) or expand their usage of ACME products in the company (44%)  Customer Loyalty Impacts Revenue  Annual revenue growth through word-of-mouth is $272,500.00  Annual revenue growth through up/cross-selling is $168,000.00  Annual revenue at risk due to churn is $488,000.00
  • 5.
    Copyright © 2011Business Over Broadway · Bob E. Hayes, PhD · bob@businessoverbroadway.com · www.businessoverbroadway.com Executive Summary - Conclusions  Improving revenue starts with improving these areas of the customer experience  Overall Product Quality, Future Product/Company Direction and Communication from Company  Large ROI and net revenue is expected if company improves future product/company direction  40% of customers say products do not have enough functionality  Product A is rated better than Product B and Product C Product Quality Future Product/ Company Direction Communication from Company Saved/Additional Revenue $ (52,771.88) $263,624.35 $98,396.10 Cost to correct (goal of 0% dissatisfaction) $45,000.00 $50,000.00 $15,000.00 Net Revenue (Saved/Add Rev - Cost) $(97,771.88) $213,624.35 $83,396.10 ROI (Saved/Add Rev / Cost) -217% 427% 556%
  • 6.
    Copyright © 2011Business Over Broadway · Bob E. Hayes, PhD · bob@businessoverbroadway.com · www.businessoverbroadway.com Executive Summary - Conclusions  ACME’s overall performance is considered typical by their customers  Industry Percentile Rank is estimated to be 54th percentile  Compared to companies in other industries, ACME tends to fall at the low end of the distribution with respect to advocacy loyalty and purchasing loyalty
  • 7.
    Copyright © 2011Business Over Broadway · Bob E. Hayes, PhD · bob@businessoverbroadway.com · www.businessoverbroadway.com Respondent Profile Primary Decision Maker 12% Decision Influencer 66% No Influence 22% Executive (C- level, VP, Man aging Director) 22% Director 11% Manager (with direct reports) 35% Individual Contributor (no direct reports) 32% 1. Most of the respondents have an influence in buying decisions (decision influencers = 66%; primary decision makers = 12%); 2. Only difference across three groups is respondents with “no influence” reported higher advocacy loyalty 1. Most of the survey respondents are Managers and Individual Contributors (67%). Director and Executive level respondents make up 33% of the sample. 2. No statistically significant difference on any key metrics.
  • 8.
    Copyright © 2011Business Over Broadway · Bob E. Hayes, PhD · bob@businessoverbroadway.com · www.businessoverbroadway.com Customer Loyalty Dashboard Customer Loyalty Metrics1 Advocacy Loyalty Percent Positive Satisfied 79% Select vendor again 71% Recommend 72% Continue using 76% Purchasing Loyalty Percent Positive Purchase different or new 41% Expand usage 44% Retention Loyalty Percent Positive Not leave / Stop using2 69% 1 Customer Loyalty measured by RAPID loyalty approach. Please see Business Over Broadway for details. Percent Positive ratings reflect percent of customers who gave ratings of 6 or greater (on a 0-10 scale). 2 Percent positive reflect percent of respondents reporting they are unlikely to stop using ACME. 1. Retention: Most customers did not indicate they would stop using ACME (69%) 2. Advocacy: Most customers said they are satisfied (79%) and will likely recommend ACME (72%) 3. Purchasing: Less than 50% of customers said they will likely purchase different/new services (41%) and expand usage of ACME (44% ). ACME Loyalty Summary
  • 9.
    Copyright © 2011Business Over Broadway · Bob E. Hayes, PhD · bob@businessoverbroadway.com · www.businessoverbroadway.com 0 1 2 3 4 5 6 7 8 9 10 0% 10% 20% 30% 40% 50% 60% 70% 80% 90% 100% Overall Satisfaction Choose again Recommend Continue using Purchase different or new Expand usage Stop using* Average PercentofRespondents Ratings of 9 or 10 Ratings of 6-8 Ratings of 0-5 Average Ratings are on a 0 (Not at all likely) to 10 (Extremely likely) scale; For Overall Satisfaction, ratings are on a 0 (Extremely Dissatisfied) to 10 (Extremely Satisfied) scale. Results based on 540 completed surveys. * Reverse scores so higher scores mean higher retention loyalty.  Customers report higher advocacy and retention loyalty than purchasing loyalty Customer Loyalty Advocacy Loyalty Purchasing Loyalty Retention Loyalty
  • 10.
    Copyright © 2011Business Over Broadway · Bob E. Hayes, PhD · bob@businessoverbroadway.com · www.businessoverbroadway.com 0 1 2 3 4 5 6 7 8 9 10 0% 10% 20% 30% 40% 50% 60% 70% 80% 90% 100% Ease of doing business Overall Product Quality Responsiveness to Service Needs Responsiveness to Technical Problems Ability to Resolve Technical Problems Communications from the Company Future Product/Company Direction Average PercentofRespondents Ratings of 9 or 10 Ratings of 6-8 Ratings of 0-5 Average Ratings are on a 0 (Extremely Dissatisfied) to 10 (Extremely Satisfied) scale. Results based on 257 completed surveys.  Around 70-80% of customers are satisfied with the customer experience  Except for Communication and Future Product/Company Direction Customer Experience
  • 11.
    Copyright © 2011Business Over Broadway · Bob E. Hayes, PhD · bob@businessoverbroadway.com · www.businessoverbroadway.com Examine each business area’s performance and impact on loyalty simultaneously. 1. Key Drivers – Invest in areas to increase Customer Loyalty. 2. Hidden Drivers – Use features in marketing to grow customer base. 3. Visible Drivers – Consider features in marketing to grow customer base. 4. Weak Drivers – Monitor as lowest priority for investment. Driver Matrix
  • 12.
    Copyright © 2011Business Over Broadway · Bob E. Hayes, PhD · bob@businessoverbroadway.com · www.businessoverbroadway.com  Predicting Advocacy Loyalty 0.50 0.55 0.60 0.65 0.70 0.75 0.80 0.85 5.25 5.75 6.25 6.75 7.25 7.75 ImpactonAdvocacyLoyalty (correlationbetweenbusinessattributes andAdvocacyLoyaltyIndex) Performance on Business Attribute (Customer Rating) Advocacy Loyalty Index is the average of the following four questions (Overall, Satisfaction, Recommend, Select vendor again, Continue using). To improve advocacy loyalty, you may consider focusing on following areas: 1. Overall Product Quality Driver Matrix: Improvement Areas
  • 13.
    Copyright © 2011Business Over Broadway · Bob E. Hayes, PhD · bob@businessoverbroadway.com · www.businessoverbroadway.com  Predicting Advocacy Loyalty To focus marketing message, you may consider leveraging following areas: 1. Ease of doing business 2. Responsiveness to technical problems 3. Responsiveness to service needs 4. Ability to resolve technical problems0.50 0.55 0.60 0.65 0.70 0.75 0.80 0.85 5.25 5.75 6.25 6.75 7.25 7.75 ImpactonAdvocacyLoyalty (correlationbetweenbusinessattributes andAdvocacyLoyaltyIndex) Performance on Business Attribute (Customer Rating) Advocacy Loyalty Index is the average of the following four questions (Overall, Satisfaction, Recommend, Select vendor again, Continue using). Driver Matrix: Marketing Messages
  • 14.
    Copyright © 2011Business Over Broadway · Bob E. Hayes, PhD · bob@businessoverbroadway.com · www.businessoverbroadway.com Business Attribute Performance1 (Average Rating) Impact2 on Advocacy Loyalty Ease of doing business 6.90 .72 Overall Product Quality 6.65 .83 Responsiveness to Service Needs 7.08 .62 Responsiveness to Technical Problems 7.19 .62 Ability to Resolve Technical Problems 7.03 .59 Communications from the Company 6.68 .64 Future Product/Company Direction 5.69 .64 ImproveLeverage Consider 1 Performance of each attribute is the average rating for each attribute across all respondents. Possible scores range from 0 (Extremely Dissatisfied) to 10 (Extremely Satisfied); 2 Impact is the correlation between specific Business Attribute sand Advocacy Loyalty Index.  Improving Advocacy Loyalty Improving and Marketing ACME
  • 15.
    Copyright © 2011Business Over Broadway · Bob E. Hayes, PhD · bob@businessoverbroadway.com · www.businessoverbroadway.com  Predicting Purchasing Loyalty Purchasing Loyalty Index is the average of the following two questions (Purchase different or new, Expand usage). 0.20 0.25 0.30 0.35 0.40 0.45 0.50 5.25 5.75 6.25 6.75 7.25 7.75 ImpactonPurchasingLoyalty (correlationbetweenbusinessattributes andPurchasingLoyaltyIndex) Performance on Business Attribute (Customer Rating) To improve purchasing loyalty, you may consider focusing on following areas: 1. Communications from the Company 2. Overall Product Quality 3. Future Product/ Company Direction Driver Matrix: Improvement Areas
  • 16.
    Copyright © 2011Business Over Broadway · Bob E. Hayes, PhD · bob@businessoverbroadway.com · www.businessoverbroadway.com  Predicting Purchasing Loyalty To focus marketing message, you may consider leveraging following areas: 1. Ability to resolve technical problems 2. Responsiveness to Technical Problems 3. Ease of doing business 4. Responsiveness to Service Needs 0.20 0.25 0.30 0.35 0.40 0.45 0.50 5.25 5.75 6.25 6.75 7.25 7.75 ImpactonPurchasingLoyalty (correlationbetweenbusinessattributes andPurchasingLoyaltyIndex) Performance on Business Attribute (Customer Rating) Purchasing Loyalty Index is the average of the following two questions (Purchase different or new, Expand usage). Driver Matrix: Marketing Messages
  • 17.
    Copyright © 2011Business Over Broadway · Bob E. Hayes, PhD · bob@businessoverbroadway.com · www.businessoverbroadway.com Business Attribute Performance1 (Average Rating) Impact2 on Purchasing Loyalty Ease of doing business 6.90 .29 Overall Product Quality 6.65 .44 Responsiveness to Service Needs 7.08 .25 Responsiveness to Technical Problems 7.19 .33 Ability to Resolve Technical Problems 7.03 .35 Communications from the Company 6.68 .40 Future Product/Company Direction 5.69 .39 ImproveLeverage Consider 1 Performance of each attribute is the average rating for each attribute across all respondents. Possible scores range from 0 (Extremely Dissatisfied) to 10 (Extremely Satisfied); 2 Impact is the correlation between specific Business Attribute sand Purchasing Loyalty Index.  Improving Purchasing Loyalty Improving and Marketing ACME
  • 18.
    Copyright © 2011Business Over Broadway · Bob E. Hayes, PhD · bob@businessoverbroadway.com · www.businessoverbroadway.com  Predicting Retention Loyalty To improve retention loyalty, you may consider focusing on following areas: 1. Overall Product Quality 2. Future Product/ Company Direction Retention Loyalty Index is the average of the following question (Stop using) 0.00 0.05 0.10 0.15 0.20 0.25 0.30 0.35 0.40 5.25 5.75 6.25 6.75 7.25 7.75 ImpactonRetentionLoyalty (correlationbetweenbusinessattributes andRetentionLoyaltyIndex) Performance on Business Attribute (Customer Rating) Driver Matrix: Improvement Areas
  • 19.
    Copyright © 2011Business Over Broadway · Bob E. Hayes, PhD · bob@businessoverbroadway.com · www.businessoverbroadway.com To focus marketing message, you may consider leveraging following areas: 1. Ability to Resolve Technical Problems 2. Responsiveness to Technical Problems 3. Responsiveness to Service Needs 4. Ease of doing business  Predicting Retention Loyalty Retention Loyalty Index is the average of the following question (Stop using) 0.00 0.05 0.10 0.15 0.20 0.25 0.30 0.35 0.40 5.25 5.75 6.25 6.75 7.25 7.75 ImpactonRetentionLoyalty (correlationbetweenbusinessattributes andRetentionLoyaltyIndex) Performance on Business Attribute (Customer Rating) Driver Matrix: Marketing Messages
  • 20.
    Copyright © 2011Business Over Broadway · Bob E. Hayes, PhD · bob@businessoverbroadway.com · www.businessoverbroadway.com 1 Performance of each attribute is the average rating for each attribute across all respondents. Possible scores range from 1 (Extremely Dissatisfied) to 10 (Extremely Satisfied); 2 Impact is the correlation between specific Business Attribute sand Customer Loyalty.  Improving Retention Loyalty Business Attribute Performance1 (Average Rating) Impact2 on Retention Loyalty Ease of doing business 6.90 .19 Overall Product Quality 6.65 .26 Responsiveness to Service Needs 7.08 .19 Responsiveness to Technical Problems 7.19 .27 Ability to Resolve Technical Problems 7.03 .27 Communications from the Company 6.68 .17 Future Product/Company Direction 5.69 .30 ImproveLeverage Consider Improving and Marketing ACME
  • 21.
    Copyright © 2011Business Over Broadway · Bob E. Hayes, PhD · bob@businessoverbroadway.com · www.businessoverbroadway.com Loyalty Impacts Expected Revenue  Revenue growth through word-of-mouth (new customers)  $272,500.001  Revenue at risk due to churn  $448,000.002  Revenue growth through up/cross-sell (existing customers)  $168,000.003 1 Expected revenue from new customers is based on 14.2% of customers recommending ACME, on average, to 7.5 friends/colleagues and a conversion rate of 2% with an annual average revenue per new customer of $10,000. 2 Expected annual revenue loss is based on 2.8% estimated churn rate and an annual average revenue per customer of $40,000. 3 Expected annual revenue growth from current customers is based on a 4.2% estimated up/cross-sell rate and an annual up/cross-sell estimate of $10,000.
  • 22.
    Copyright © 2011Business Over Broadway · Bob E. Hayes, PhD · bob@businessoverbroadway.com · www.businessoverbroadway.com Impact of Improvement Efforts  Improvements start with key drivers of customer loyalty  Product Quality, Future Product/ACME Direction, ACME Communication  Large ROI and net revenue is expected if company improves future product/company direction Product Quality Future Product/ ACME Direction Communication from ACME Saved/Additional Revenue $ (52,771.88) $263,624.35 $98,396.10 Cost to correct (goal of 0% dissat) $45,000.00 $50,000.00 $15,000.00 Net Revenue (Saved/Add Rev - Cost) $(97,771.88) $213,624.35 $83,396.10 ROI (Saved/Add Rev / Cost) -217% 427% 556%
  • 23.
    Copyright © 2011Business Over Broadway · Bob E. Hayes, PhD · bob@businessoverbroadway.com · www.businessoverbroadway.com 1 Importance measured by correlation between business attribute and customer loyalty metric. Ranking conducted within a specific loyalty metric. Drivers of Customer Loyalty  Customer experience has a much greater impact on advocacy loyalty than on purchasing or retention loyalty .00 .10 .20 .30 .40 .50 .60 .70 .80 .90 Ease of doing business Overall Product Quality Responsiveness to Service Needs Responsiveness to Technical Problems Ability to Resolve Technical Problems Communications from the Company Future Product/Company Direction ImpactonLoyaltyMetric (correlationbetweenbusinessattributes andloyaltymetric) Advocacy Loyalty Purchasing Loyalty Retention Loyalty
  • 24.
    Copyright © 2011Business Over Broadway · Bob E. Hayes, PhD · bob@businessoverbroadway.com · www.businessoverbroadway.com Top Drivers of Loyalty Business Attribute (BA) Advocacy Loyalty Purchasing Loyalty Retention Loyalty Ease of doing business 2 6 5 Overall Product Quality 1 1 4 Responsiveness to Service Needs 5 7 6 Responsiveness to Technical Problems 5 4 3 Ability to Resolve Technical Problems 7 5 2 Communications from the Company 3 2 7 Future Product/Company Direction 4 3 1 1 Rank is based on correlation between business attribute and customer loyalty metric. Ranking conducted within a specific loyalty metric. Ranking of 1 indicates highest correlation between that business attribute and the measure of customer loyalty. Top Drivers of Customer Loyalty  Business attributes impact customer loyalty components differently
  • 25.
    Copyright © 2011Business Over Broadway · Bob E. Hayes, PhD · bob@businessoverbroadway.com · www.businessoverbroadway.com Product Functionality  About 40% of respondents indicated ACME products do not have enough functionality  About 14% indicated ACME products have too much functionality 0% 5% 10% 15% 20% 25% 30% 35% 40% 45% 50% 1 - Not enough functionality 2 3 4 - Right amount of functionality 5 6 7 - Too much functionality PercentofCustomers
  • 26.
    Copyright © 2011Business Over Broadway · Bob E. Hayes, PhD · bob@businessoverbroadway.com · www.businessoverbroadway.com Product Functionality  Too little product functionality has a deleterious effect on key customer metrics. Too much functionality does not adversely impact key customer metrics 0 1 2 3 4 5 6 7 8 9 ALI PLI RLI Ease of doing business Overall Product Quality Responsiveness to Service Needs Responsiveness to Technical Problems Ability to Resolve Technical Problems Communications from the Company Future Product/Company Direction Loyalty/Satisfaction Not enough (ratings of 1-2) Right amount (ratings of 3-5) Too much (ratings of 6-7) Product functionality measured on a 1-7 scale; where 1 = Not enough functionality; 4 = Right amount of functionality, 7 = Too much functionality.
  • 27.
    Copyright © 2011Business Over Broadway · Bob E. Hayes, PhD · bob@businessoverbroadway.com · www.businessoverbroadway.com Product Quality and Combinations  Have enough data to assess three products  Prod A, Prod B, and Prod C  Prod C receives higher ratings than Prod A or Prod B 7.01 6.03 8.30 6.54 6.26 7.30 4.0 5.0 6.0 7.0 8.0 9.0 10.0 Product A Only Product B Only Product C Only Product A with B Product A with C Product B with C Satisfactionwith ProductQuality
  • 28.
    Copyright © 2011Business Over Broadway · Bob E. Hayes, PhD · bob@businessoverbroadway.com · www.businessoverbroadway.com Competitors used by Customers  Nearly half (49%) of ACME customers say they use competitor’s products in their organization 0% 10% 20% 30% 40% 50% 60% 70% 80% A B C D E F G H Other PercentofCustomers1 Competitor 1 Percent based on only those respondents who indicated they use competitor’s products in their company.
  • 29.
    Copyright © 2011Business Over Broadway · Bob E. Hayes, PhD · bob@businessoverbroadway.com · www.businessoverbroadway.com ACME Compared to Competitors 6% 16% 37% 40% 2% 0% 5% 10% 15% 20% 25% 30% 35% 40% 45% Worse than allBetter than someAbout the same as othersBetter than mostBetter than all PercentofRespondents What best describes our performance compared to the competitors you use? (0 + 400 + 1850 + 3000 + 200) / 100 = 54.5 Percentile Value % of Customers 0 6 25 16 50 37 75 40 100 2 ACME’s Percentile Performance Rank 50% < 54%< 58%
  • 30.
    Copyright © 2011Business Over Broadway · Bob E. Hayes, PhD · bob@businessoverbroadway.com · www.businessoverbroadway.com Competitive Ranking Estimates 36% 50% 51% 52% 54% 55% 55% 56% 62% 0% 20% 40% 60% 80% Competitor H* Competitor G Competitor F Competitor E ALL COMPETITORS Competitor D Competitor C Competitor B Competitor A Customer Estimate of ACME’s Percentile Rank ACME’s percentile ranking is not adversely impacted by presence of most competitors – ACME’s ranking is comparable to most competitors. Competitor H’s presence in ACME’s Accounts has significant negative impact on customers’ perception of ACME’s performance. ACME’s Percentile Rank when competitors are present * Statistically significant difference between ACME customers who are using Competitor H and those who are not using Competitor H.
  • 31.
    Copyright © 2011Business Over Broadway · Bob E. Hayes, PhD · bob@businessoverbroadway.com · www.businessoverbroadway.com Advocacy Loyalty Benchmarks (B2B) 0 1 2 3 4 5 6 7 8 9 10 0% 10% 20% 30% 40% 50% 60% 70% 80% 90% 100% Mean PercentofRespondents Very Loyal (ratings of 9 or 10) Loyal (ratings of 6-8) Disloyal (ratings of 0-5) Mean Overall Satisfaction Recommend Continue Purchasing / Using Select Vendor Again Means not calculated for ACME C and E. Comp C used a 1 to 6 satisfaction scale; 1-3 = Disloyal; 4-5 = Loyal; 6 = Very loyal. Cascade Comp E used a 1 to 5 satisfaction scale; 1-3 = Disloyal; 4 = Loyal; 5 = Very loyal. Oracle used a 1 to 10 satisfaction scale; 1-5 – Disloyal; 6-8 = Loyal; 9-10 = Very loyal. ACME provides consulting services, analytics solutions and customized products for financial companies. Comp A provides solutions that help healthcare providers automate key business processes. Comp B helps businesses monitor and optimize Storage Area Networks (SANs). Comp C provides security and data protection solutions. Comp D specializes in developing hardware systems and enterprise software products. Comp E provides solutions for precision electrical measurement and test of advanced semiconductor devices.
  • 32.
    Copyright © 2011Business Over Broadway · Bob E. Hayes, PhD · bob@businessoverbroadway.com · www.businessoverbroadway.com Purchasing Loyalty 0 1 2 3 4 5 6 7 8 9 10 0% 10% 20% 30% 40% 50% 60% 70% 80% 90% 100% ACME Company A Company B Mean PercentofRespondents Very Loyal (ratings of 9 or 10) Loyal (ratings of 6-8) Disloyal (ratings of 0-5) Mean Purchase additional/different types of services ACME provides consulting services, analytics solutions and customized products for financial companies. Comp A provides solutions that help healthcare providers automate key business processes. Comp B helps businesses monitor and optimize Storage Area Networks (SANs).
  • 33.
    Copyright © 2011Business Over Broadway · Bob E. Hayes, PhD · bob@businessoverbroadway.com · www.businessoverbroadway.com Retention Loyalty *For this question, ratings are reverse coded to facilitate presentation: green indicates ratings of 0 thru 1 (highly unlikely to leave); yellow indicates ratings of 2 thru 4 (unlikely to leave); red indicates ratings of 5 thru 10. 0 1 2 3 4 5 6 7 8 9 10 0% 10% 20% 30% 40% 50% 60% 70% 80% 90% 100% ACME Company A Mean PercentofRespondents Very Loyal (ratings of 9 or 10) Loyal (ratings of 6-8) Disloyal (ratings of 0-5) Mean Not Leave / Stop Using* ACME provides consulting services, analytics solutions and customized products for financial companies. Comp A provides solutions that help healthcare providers automate key business processes.
  • 34.
    Copyright © 2011Business Over Broadway · Bob E. Hayes, PhD · bob@businessoverbroadway.com · www.businessoverbroadway.com For More Information Bob E. Hayes, Ph.D. Email: bob@businessoverbroadway.com Web: www.businessoverbroadway.com Blog: www.businessoverbroadway.com/blog Twitter: www.twitter.com/bobehayes