Download as PDF, PPTX

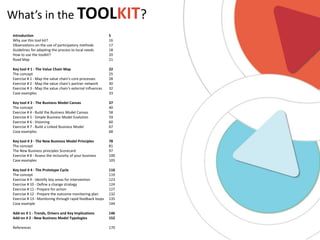
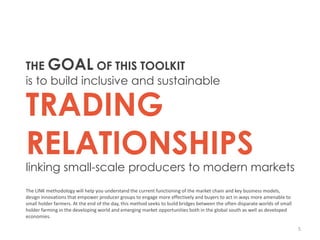
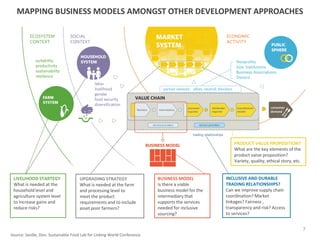
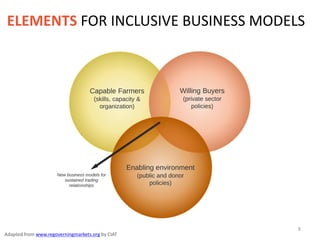
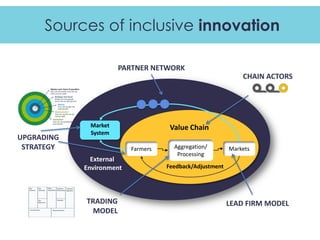
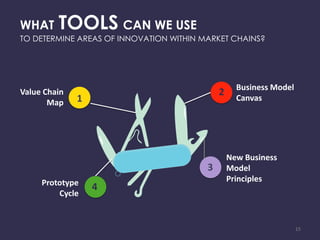
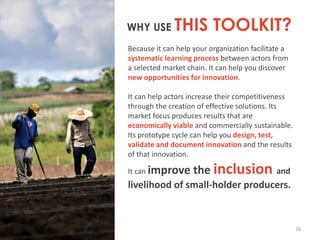
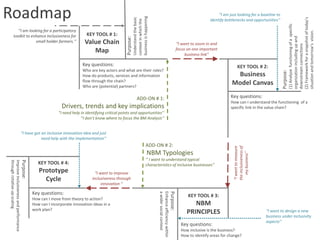
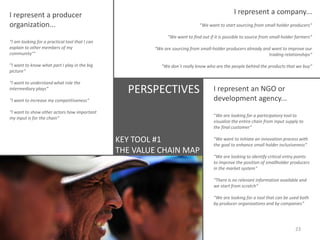
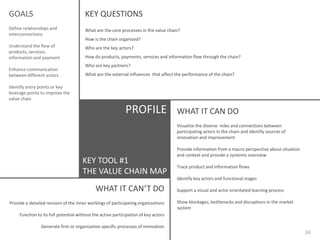


This document provides an introduction and overview of a participatory guide for designing business models that link smallholder farmers to markets. It was created by the International Center for Tropical Agriculture to help strengthen inclusive and sustainable trading relationships. The guide contains tools and exercises to map value chains, design business models using a business model canvas, assess business models against principles of inclusiveness, and test business models through a prototype cycle. The goal is to help smallholder farmers engage more effectively with markets and ensure their needs and voices are recognized in business relationships. The document emphasizes how agriculture can significantly reduce poverty by creating livelihoods and jobs for many in rural areas worldwide.


