SRI KRISHNA COLLEGEOF TECHNOLOGY
SCHOOL OF MANAGEMENT
21PNC211– QUANTITATIVE
TECHNIQUES
Mr. SARAVANAN
Assistant Professor
2.
Definition:
Operations Research isa scientific method of providing executive departments with a
quantitative basis for decisions regarding the operations under their control.
-Morse and Kimbal (1946)
Operations Research
3.
1.1Formulation of LPP
1.2Applicationin Business environment
1.3Graphical Solution to LPP
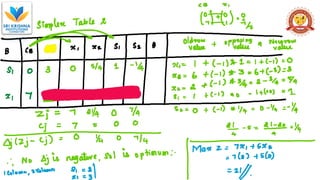
1.4Simplex Method
1.5Big M Method
1.6Duality in linear programming
1.7Sensitivity Analysis
Unit -1
4.
Simple linear programmingproblems with two decision variables can be easily solved by
graphical method.
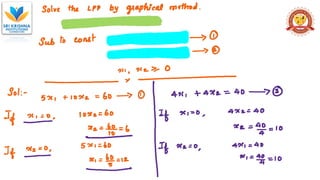
Procedure for solving LPP by Graphical Method:
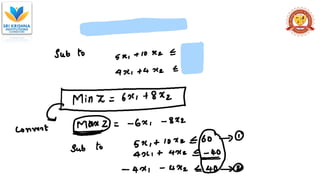
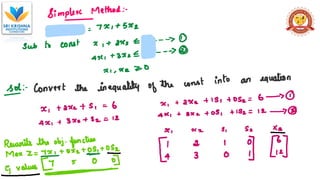
Step 1: Consider each inequality constraint as an equation.
Step 2: Plot each equation on the graph, as each will geometrically represent a straight
line.
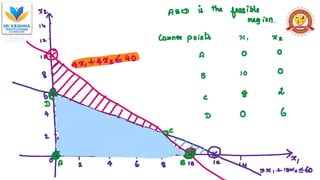
Step 3: Mark the region. If the inequality constraints corresponding to that line is ≤, then
region below the line lying in the first quadrant (due to non-negativity of variable) is
shaded. For the inequality constraint ≥ sign, the region above the line in the first quadrant
is shaded. The points lying in the common region will satisfy all the constraints
simultaneously. The common region thus obtained is called the ‘feasible region’.
Graphical Method
5.
Simple linear programmingproblems with two decision variables can be easily solved
by graphical method.
Procedure for solving LPP by Graphical Method:
Step 1: Consider each inequality constraint as an equation.
Step 2: Plot each equation on the graph, as each will geometrically represent a
straight line.
Step 3: Mark the region. If the inequality constraints corresponding to that line is ≤,
then region below the line lying in the first quadrant (due to non-negativity of variable)
is shaded. For the inequality constraint ≥ sign, the region above the line in the first
quadrant is shaded. The points lying in the common region will satisfy all the
constraints simultaneously. The common region thus obtained is called the ‘feasible
region’.
6.
Step 4:Assign anarbitrary value, say zero, to the objective function.
Step 5: Draw the straight line to represent the objective function with the value ( ie.,
a straight line through the origin).
Step 6:Stretch the objective function line till the extreme points of the feasible
region. In the maximization case, this line will stop far the set from the origin,
passing through at least one from the origin, passing through at least one corner of
the feasible region. In the minimization case, this line will stop nearest to the origin,
passing through at least one corner of the feasible region.
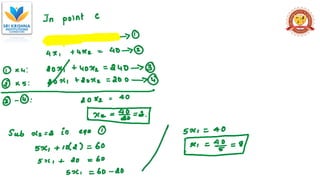
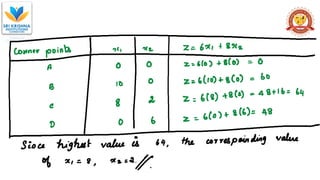
Step 7: find the co-ordinates of the extreme points selected in step 6 and the
maximum or minimum value of Z.