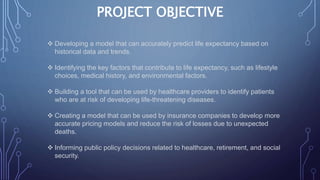
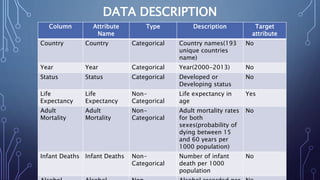
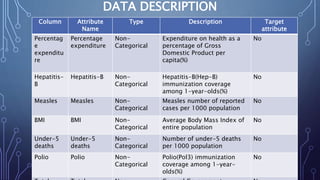
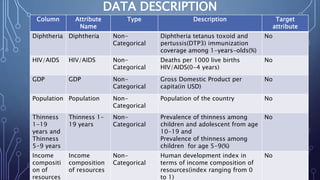
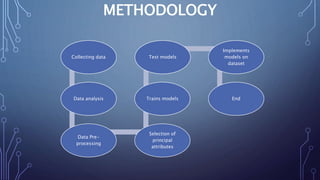
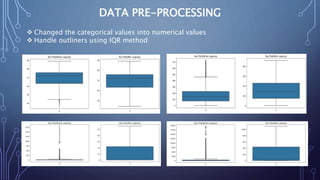
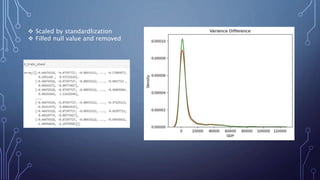
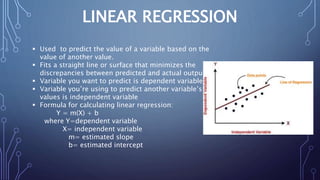
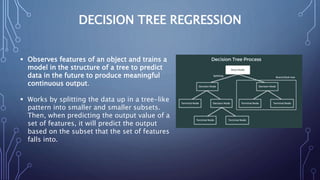
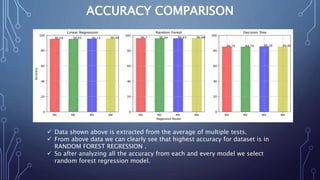
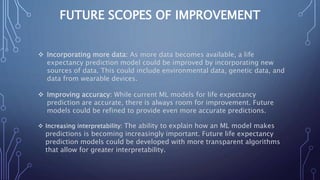
LIFE EXPECTANCY
PREDICTION
PROJECT MENTOR
PROF. ARNAB CHAKRABORTY
TEAM MEMBERS
 SHEELA
BHATTACHARJEE
 BIPLAB GORAIN
 BISHNU SHARMA
 PRIYANSHU BURMAN
CONTEN
TS
 Project Objective
 Data Description
 Methodology
 Data Preprocessing
 Models Used
 Accuracy and Comparison
 Future Scope of Improvements
PROJECT OBJECTIVE
 Developing a model that can accurately predict life expectancy based on
historical data and trends.
 Identifying the key factors that contribute to life expectancy, such as lifestyle
choices, medical history, and environmental factors.
 Building a tool that can be used by healthcare providers to identify patients
who are at risk of developing life-threatening diseases.
 Creating a model that can be used by insurance companies to develop more
accurate pricing models and reduce the risk of losses due to unexpected
deaths.
 Informing public policy decisions related to healthcare, retirement, and social
security.
DATA DESCRIPTION
Column Attribute
Name
Type Description Target
attribute
Country Country Categorical Country names(193
unique countries
name)
No
Year Year Categorical Year(2000-2013) No
Status Status Categorical Developed or
Developing status
No
Life
Expectancy
Life
Expectancy
Non-
Categorical
Life expectancy in
age
Yes
Adult
Mortality
Adult
Mortality
Non-
Categorical
Adult mortality rates
for both
sexes(probability of
dying between 15
and 60 years per
1000 population)
No
Infant Deaths Infant Deaths Non-
Categorical
Number of infant
death per 1000
population
No
DATA DESCRIPTION
Column Attribute
Name
Type Description Target
attribute
Percentag
e
expenditu
re
Percentage
expenditure
Non-
Categorical
Expenditure on health as a
percentage of Gross
Domestic Product per
capita(%)
No
Hepatitis-
B
Hepatitis-B Non-
Categorical
Hepatitis-B(Hep-B)
immunization coverage
among 1-year-olds(%)
No
Measles Measles Non-
Categorical
Measles number of reported
cases per 1000 population
No
BMI BMI Non-
Categorical
Average Body Mass Index of
entire population
No
Under-5
deaths
Under-5
deaths
Non-
Categorical
Number of under-5 deaths
per 1000 population
No
Polio Polio Non-
Categorical
Polio(Pol3) immunization
coverage among 1-year-
olds(%)
No
DATA DESCRIPTION
Column Attribute
Name
Type Description Target
attribute
Diphtheria Diphtheria Non-
Categorical
Diphtheria tetanus toxoid and
pertussis(DTP3) immunization
coverage among 1-years-olds(%)
No
HIV/AIDS HIV/AIDS Non-
Categorical
Deaths per 1000 live births
HIV/AIDS(0-4 years)
No
GDP GDP Non-
Categorical
Gross Domestic Product per
capita(in USD)
No
Population Population Non-
Categorical
Population of the country No
Thinness
1-19
years and
Thinness
5-9 years
Thinness 1-
19 years
Non-
Categorical
Prevalence of thinness among
children and adolescent from age
10-19 and
Prevalence of thinness among
children for age 5-9(%)
No
Income
compositi
on of
resources
Income
composition
of resources
Non-
Categorical
Human development index in
terms of income composition of
resources(index ranging from 0
to 1)
No
METHODOLOGY
Collecting data
Data analysis
Data Pre-
processing
Selection of
principal
attributes
Trains models
Test models
Implements
models on
dataset
End
DATA PRE-PROCESSING
 Changed the categorical values into numerical values
 Handle outliners using IQR method
 Scaled by standardlization
 Filled null value and removed
MODEL USED
We have used 3 models here viz.
 Linear Regression Model
 Random Forest Regression
 Decision Tree Regression Model
LINEAR REGRESSION
 Used to predict the value of a variable based on the
value of another value.
 Fits a straight line or surface that minimizes the
discrepancies between predicted and actual output.
 Variable you want to predict is dependent variable.
 Variable you’re using to predict another variable’s
values is independent variable
 Formula for calculating linear regression:
Y = m(X) + b
where Y=dependent variable
X= independent variable
m= estimated slope
b= estimated intercept
RANDOM FOREST REGRESSION
 Used an ensemble of decision trees to
predict continuous numerical values
 Multiple decision trees are constructed
and combined to form a "forest." Each
tree in the forest is trained on a
different subset of the data, using a
random sample of the features at each
node.
DECISION TREE REGRESSION
 Observes features of an object and trains a
model in the structure of a tree to predict
data in the future to produce meaningful
continuous output.
 Works by splitting the data up in a tree-like
pattern into smaller and smaller subsets.
Then, when predicting the output value of a
set of features, it will predict the output
based on the subset that the set of features
falls into.
ACCURACY COMPARISON
 Data shown above is extracted from the average of multiple tests.
 From above data we can clearly see that highest accuracy for dataset is in
RANDOM FOREST REGRESSION .
 So after analyzing all the accuracy from each and every model we select
random forest regression model.
FUTURE SCOPES OF IMPROVEMENT
 Incorporating more data: As more data becomes available, a life
expectancy prediction model could be improved by incorporating new
sources of data. This could include environmental data, genetic data, and
data from wearable devices.
 Improving accuracy: While current ML models for life expectancy
prediction are accurate, there is always room for improvement. Future
models could be refined to provide even more accurate predictions.
 Increasing interpretability: The ability to explain how an ML model makes
predictions is becoming increasingly important. Future life expectancy
prediction models could be developed with more transparent algorithms
that allow for greater interpretability.
THANK YOU
ASANSOL ENGINEERING COLLEGE
SHEELA BHATTACHARJEE (SHEELADHN2024@GMAIL.COM)
BIPLAB GORAIN (BIPLABGORAIN2018@GMAILCOM)
BISHNU SHARMA (VS510514@GMAIL.COM)
PRIYANSHU BURMAN (PRIYANSHU887887@GMAIL.COM)

LIFE EXPECTANCY PREDICTION.pptx

  • 1.
    LIFE EXPECTANCY PREDICTION PROJECT MENTOR PROF.ARNAB CHAKRABORTY TEAM MEMBERS  SHEELA BHATTACHARJEE  BIPLAB GORAIN  BISHNU SHARMA  PRIYANSHU BURMAN
  • 2.
    CONTEN TS  Project Objective Data Description  Methodology  Data Preprocessing  Models Used  Accuracy and Comparison  Future Scope of Improvements
  • 3.
    PROJECT OBJECTIVE  Developinga model that can accurately predict life expectancy based on historical data and trends.  Identifying the key factors that contribute to life expectancy, such as lifestyle choices, medical history, and environmental factors.  Building a tool that can be used by healthcare providers to identify patients who are at risk of developing life-threatening diseases.  Creating a model that can be used by insurance companies to develop more accurate pricing models and reduce the risk of losses due to unexpected deaths.  Informing public policy decisions related to healthcare, retirement, and social security.
  • 4.
    DATA DESCRIPTION Column Attribute Name TypeDescription Target attribute Country Country Categorical Country names(193 unique countries name) No Year Year Categorical Year(2000-2013) No Status Status Categorical Developed or Developing status No Life Expectancy Life Expectancy Non- Categorical Life expectancy in age Yes Adult Mortality Adult Mortality Non- Categorical Adult mortality rates for both sexes(probability of dying between 15 and 60 years per 1000 population) No Infant Deaths Infant Deaths Non- Categorical Number of infant death per 1000 population No
  • 5.
    DATA DESCRIPTION Column Attribute Name TypeDescription Target attribute Percentag e expenditu re Percentage expenditure Non- Categorical Expenditure on health as a percentage of Gross Domestic Product per capita(%) No Hepatitis- B Hepatitis-B Non- Categorical Hepatitis-B(Hep-B) immunization coverage among 1-year-olds(%) No Measles Measles Non- Categorical Measles number of reported cases per 1000 population No BMI BMI Non- Categorical Average Body Mass Index of entire population No Under-5 deaths Under-5 deaths Non- Categorical Number of under-5 deaths per 1000 population No Polio Polio Non- Categorical Polio(Pol3) immunization coverage among 1-year- olds(%) No
  • 6.
    DATA DESCRIPTION Column Attribute Name TypeDescription Target attribute Diphtheria Diphtheria Non- Categorical Diphtheria tetanus toxoid and pertussis(DTP3) immunization coverage among 1-years-olds(%) No HIV/AIDS HIV/AIDS Non- Categorical Deaths per 1000 live births HIV/AIDS(0-4 years) No GDP GDP Non- Categorical Gross Domestic Product per capita(in USD) No Population Population Non- Categorical Population of the country No Thinness 1-19 years and Thinness 5-9 years Thinness 1- 19 years Non- Categorical Prevalence of thinness among children and adolescent from age 10-19 and Prevalence of thinness among children for age 5-9(%) No Income compositi on of resources Income composition of resources Non- Categorical Human development index in terms of income composition of resources(index ranging from 0 to 1) No
  • 7.
    METHODOLOGY Collecting data Data analysis DataPre- processing Selection of principal attributes Trains models Test models Implements models on dataset End
  • 8.
    DATA PRE-PROCESSING  Changedthe categorical values into numerical values  Handle outliners using IQR method
  • 9.
     Scaled bystandardlization  Filled null value and removed
  • 10.
    MODEL USED We haveused 3 models here viz.  Linear Regression Model  Random Forest Regression  Decision Tree Regression Model
  • 11.
    LINEAR REGRESSION  Usedto predict the value of a variable based on the value of another value.  Fits a straight line or surface that minimizes the discrepancies between predicted and actual output.  Variable you want to predict is dependent variable.  Variable you’re using to predict another variable’s values is independent variable  Formula for calculating linear regression: Y = m(X) + b where Y=dependent variable X= independent variable m= estimated slope b= estimated intercept
  • 12.
    RANDOM FOREST REGRESSION Used an ensemble of decision trees to predict continuous numerical values  Multiple decision trees are constructed and combined to form a "forest." Each tree in the forest is trained on a different subset of the data, using a random sample of the features at each node.
  • 13.
    DECISION TREE REGRESSION Observes features of an object and trains a model in the structure of a tree to predict data in the future to produce meaningful continuous output.  Works by splitting the data up in a tree-like pattern into smaller and smaller subsets. Then, when predicting the output value of a set of features, it will predict the output based on the subset that the set of features falls into.
  • 14.
    ACCURACY COMPARISON  Datashown above is extracted from the average of multiple tests.  From above data we can clearly see that highest accuracy for dataset is in RANDOM FOREST REGRESSION .  So after analyzing all the accuracy from each and every model we select random forest regression model.
  • 16.
    FUTURE SCOPES OFIMPROVEMENT  Incorporating more data: As more data becomes available, a life expectancy prediction model could be improved by incorporating new sources of data. This could include environmental data, genetic data, and data from wearable devices.  Improving accuracy: While current ML models for life expectancy prediction are accurate, there is always room for improvement. Future models could be refined to provide even more accurate predictions.  Increasing interpretability: The ability to explain how an ML model makes predictions is becoming increasingly important. Future life expectancy prediction models could be developed with more transparent algorithms that allow for greater interpretability.
  • 17.
    THANK YOU ASANSOL ENGINEERINGCOLLEGE SHEELA BHATTACHARJEE (SHEELADHN2024@GMAIL.COM) BIPLAB GORAIN (BIPLABGORAIN2018@GMAILCOM) BISHNU SHARMA (VS510514@GMAIL.COM) PRIYANSHU BURMAN (PRIYANSHU887887@GMAIL.COM)