Download as PDF, PPTX


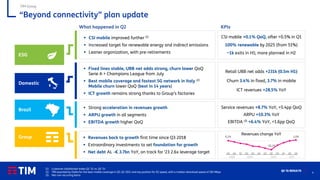
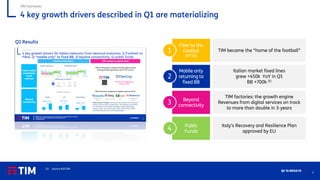

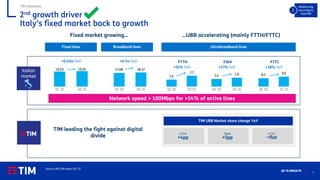


- Q2 '21 results show TIM Group revenues back to growth for the first time since Q3 2018, driven by an acceleration in revenue growth in Brazil. - TIM Domestic saw stable fixed lines, strong UBB net adds, and lower churn. Mobile churn was lower quarter-over-quarter. ICT growth remained strong. - TIM launched its "Football and Sports" package on TIMVISION in July to become the "home of football" in Italy, including Serie A, Champions League, Europa League, and Olympics content. - Key growth drivers around fiber deployment, digital services, and public funds are materializing as planned.


