Download to read offline

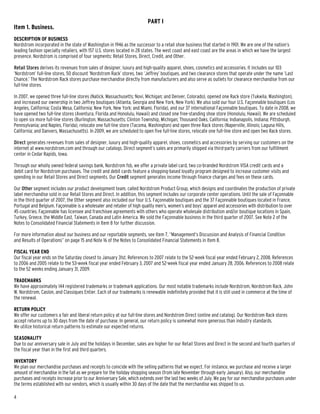

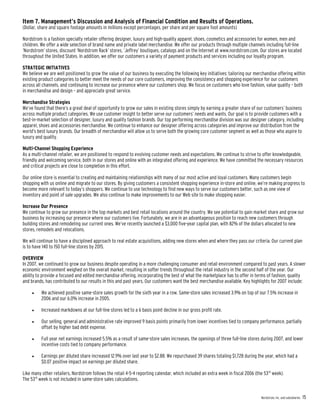
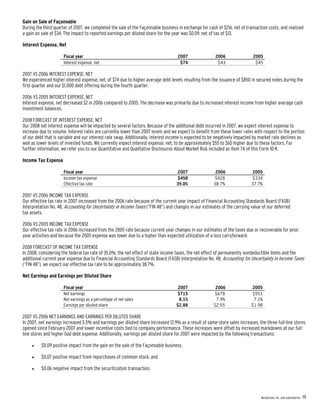
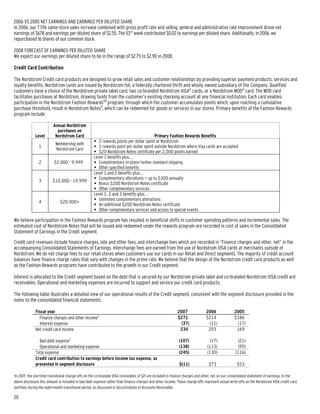
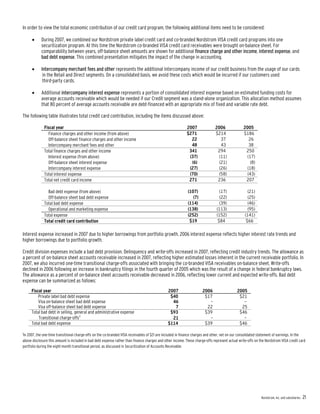
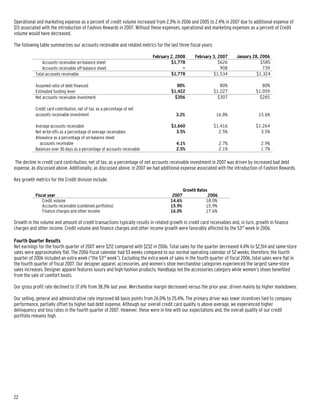

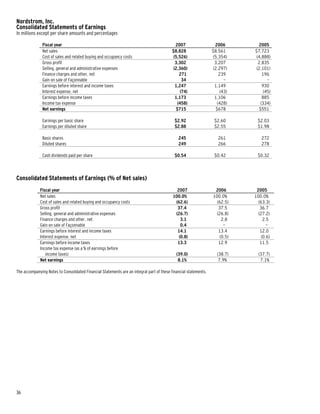
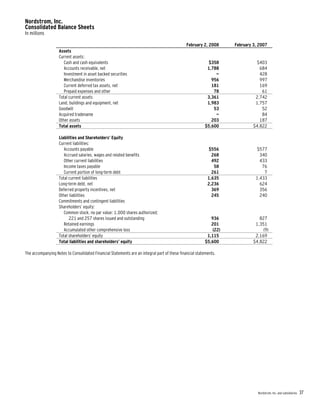
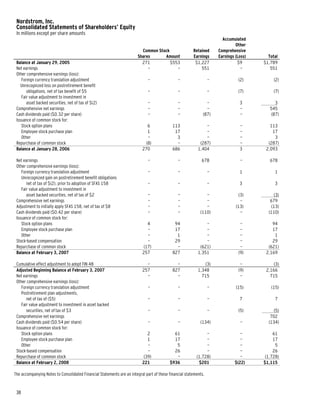
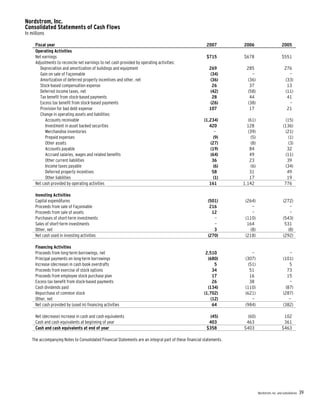
The document is Nordstrom's annual report (Form 10-K) filed with the SEC for the fiscal year ended February 2, 2008. It provides an overview of Nordstrom's business segments and operations, discusses competitive conditions and risks. Key points include: - Nordstrom has four business segments: Retail Stores, Direct, Credit, and Other. Retail Stores and Direct are the main segments. - In 2007, Nordstrom opened new stores and remodeled existing stores. It also sold its Façonnable boutiques. - Nordstrom faces competition from other retailers and risks including its ability to respond to fashion trends, effective inventory management, and economic conditions.


