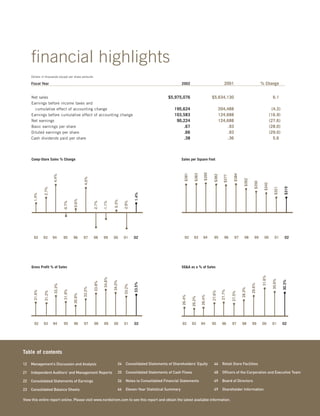
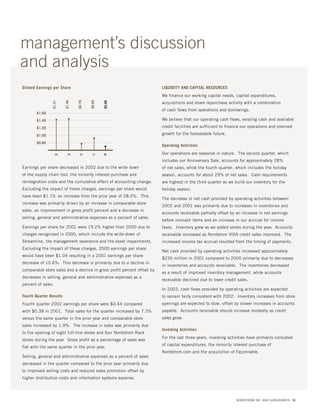
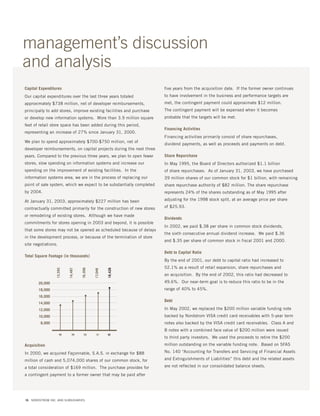
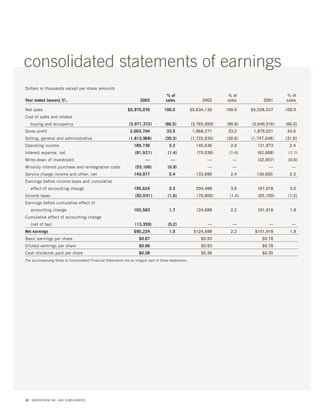
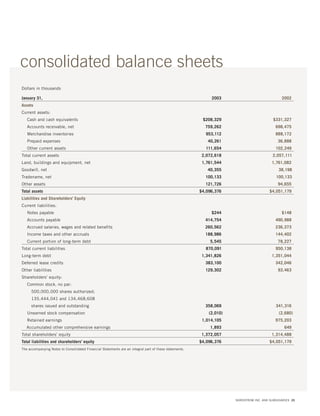
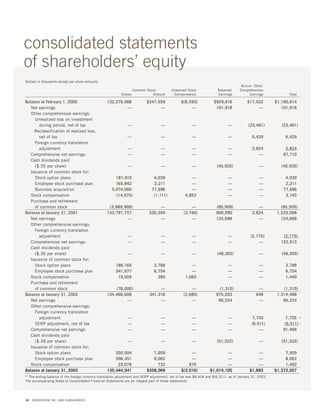
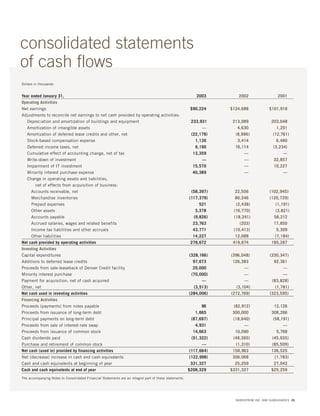
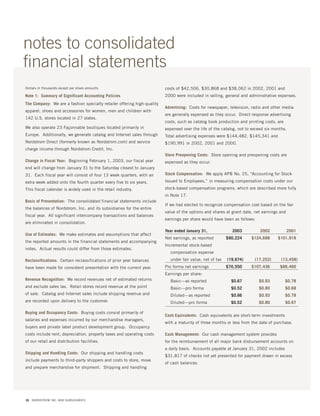
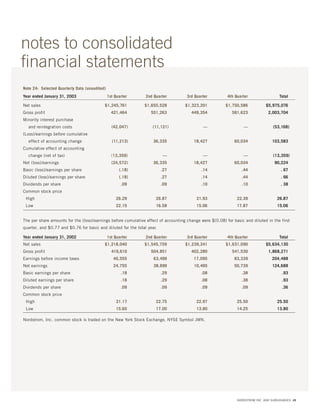
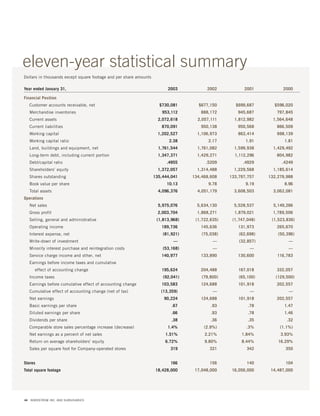
SlideShare a Scribd company logo
1 of 52
Download to read offline
ANNUAL REPORT 2002


[forward motion]
financial highlights
     Dollars in thousands except per share amounts

                                                                                                                                                             2001                               % Change
     Fiscal Year                                                                                                   2002


                                                                                                         $5,975,076                             $5,634,130                                                  6.1
     Net sales
     Earnings before income taxes and
                                                                                                            195,624                                      204,488                                           (4.3)
       cumulative effect of accounting change
                                                                                                            103,583                                      124,688                                          (16.9)
     Earnings before cumulative effect of accounting change
                                                                                                             90,224                                      124,688                                          (27.6)
     Net earnings
                                                                                                                .67                                          .93                                          (28.0)
     Basic earnings per share
                                                                                                                .66                                          .93                                          (29.0)
     Diluted earnings per share
                                                                                                                .38                                          .36                                            5.6
     Cash dividends paid per share


     Comp-Store Sales % Change                                                                                     Sales per Square Foot


                                                                                                                                         $395
                                                                                                                     $381

                                                                                                                               $383


                                                                                                                                                                     $384
                                                                                                                                                  $382
                       4.4%


                                                                                                                                                            $377
                                               4.0%


                                                                                                                                                                               $362

                                                                                                                                                                                         $350
                                                                                                                               ••                                    •
                                                                                                                                                  •
                                                                                                                     •


                                                                                                                                                                                                   $342
                       •                                                                                                                                     •
                                               •


                                                                                                                                                                                                              $321

                                                                                                                                                                                                                       $319
                                                                                                                                                                              •
               2.7%


                                                                                                                                                                                         •         •
                                                                                        1.4%
       1.4%


                                                                                                                                                                                                              •        •
               •
                                       0.6%


                                                                       0.3%

                                                                                -2.9%
                               -0.7%


                                                       -2.7%

                                                               -1.1%


       •                                                                                •
                                       •                               •
                               •                               •
                                                       •                        •
                                                                                                                     92       93       94        95          96      97       98         99        00         01       02
      92       93      94      95      96      97      98      99      00       01      02


                                                                                                                   SG&A as a % of Sales
     Gross Profit % of Sales
                                                                                                                                                                                                 31.6%
                                                               34.8%


                                                                                                                                                                                                            30.6%

                                                                                                                                                                                                                     30.3%
                                                                       34.0%
                                                       33.8%


                                                                                        33.5%


                                                                                                                                                                                      29.6%
                       33.3%


                                                                                33.2%


                                                                                                                                                                                                 •
                                               32.2%


                                                                                                                                                                            28.3%


                                                               •
                               31.9%


                                                                                                                                                          27.7%


                                                                                                                                                                                                            •
       31.6%


                                                                                                                                                27.6%
               31.2%


                                                                                                                                                                                                                     •
                                                                       •
                                                                                                                                                                   27.5%


                                                       •                                •
                                       30.9%


                                                                                                                                                                                      •
                       •                                                        •
                                                                                                                   26.4%


                                                                                                                                      26.4%
                                                                                                                            26.2%


                                               •                                                                                                                            •
                               •                                                                                                                ••
       •       •                                                                                                                                                   •
                                       •                                                                           •        ••

       92      93      94      95      96      97      98      99      00       01      02                         92       93        94        95        96       97       98        99        00         01        02


Table of contents

                                                                                                                                                 46       Retail Store Facilities
                                                                           24    Consolidated Statements of Shareholders’ Equity
12   Management’s Discussion and Analysis

                                                                                                                                                 48       Officers of the Corporation and Executive Team
                                                                           25    Consolidated Statements of Cash Flows
21   Independent Auditors’ and Management Reports

                                                                                                                                                 49       Board of Directors
                                                                           26    Notes to Consolidated Financial Statements
22   Consolidated Statements of Earnings

                                                                                                                                                 49       Shareholder Information
                                                                           44    Eleven-Year Statistical Summary
23   Consolidated Balance Sheets

View this entire report online. Please visit www.nordstrom.com to see this report and obtain the latest available information.
The saying goes, “It’s the little             things that count.”
We’d like to add—it’s the big       ones too. In fact, it all counts when
                    it comes to customer satisfaction.


quality
experience
Our focus at Nordstrom is simple—take care of
the customer and offer a wide selection of quality,
distinctive merchandise at fair prices every day.
It is this commitment that ultimately drives sales
and results. Everything we do, directly or indirectly,
supports our focus on our customers. And our
story always begins with our people…
our
            pleasure
             In a competitive retail environment, you must
             have the best people in the industry on the sales
             floor. We look for people who will approach work
             with pride and ownership. Our salespeople are
             empowered to do whatever it takes to make the
             customer happy. Every day, they find new ways
             to respond to each customer’s needs.

             In addition to anticipating what the customer
             wants, we offer special services that enhance
             the shopping experience. Whether someone
             needs a gift wrapped in our signature pewter
             and silver boxes (of course, free of charge), last
             minute alterations, or a complimentary makeover,
             our services are a unique complement to our
             superior salespeople.


                  BP. Salesperson
                Nicole Rhotton, Mission Viejo, CA

                                                                       Personal Touch
                                                                      Personal shopping specialist
                                                                       Eun Kim, Michigan Ave., IL

           Café Bistro                                                                                BP. Shoe Salesperson
Jose “Pepe” Ruvalcaba, Mission Viejo, CA                                                             Russell Felicitas, Downtown Seattle, WA
                                                                 Concierge
                                                        Cynthia Sanchez, Michigan Ave., IL
2 NORDSTROM INC. AND SUBSIDIARIES
“As shoe merchants, we were raised kneeling in front of customers,
       and I believe this represents the essence of our company’s
                 values and the very core of our culture.”
                                                                      Bruce Nordstrom
                                                                      CHAIRMAN OF THE BOARD


Men’s Clothing Salesperson
         Million-dollar seller
    Larry Smiley, Michigan Ave., IL


                                                                          Alterations
                                                                      Deena Vu, Bellevue Sq., WA


                                      Regional Fit Specialist
                                          Lingerie and Prosthesis
                                                                                    Cosmetics Skincare Specialist
                                         Debra Duden, Oak Brook, IL
                                                                                             Claudia Myszko, Mission Viejo, CA

                                                                                                                                     3
                                                                                                   NORDSTROM INC. AND SUBSIDIARIES
4 NORDSTROM INC. AND SUBSIDIARIES
distinctive
merchandise
Our goal is to offer a well-edited range of products
for a variety of lifestyles. We serve a broad base of
customers and work hard to offer them an appealing
combination of unique vendors, national and
exclusive brands and private label merchandise.
To have the merchandise when the customer wants
it is the highest form of service we can provide.
We won’t be undersold, and we stand by our
commitment to provide the best possible price for
every item sold in our stores.

Customers want fresh, compelling merchandise
and they recognize quality and value. When we focus
on those things it’s possible to send more customers
home happy—with a shopping bag in hand.


                                                                        5
                                      NORDSTROM INC. AND SUBSIDIARIES
m
                                                            co
                                                           .                 le
                                                        om                ab
                                  k
                                 c                   str
                                          log                            n
                              Ra                                      on
                                                  rd
                                       ata                          aç
                          e                     no
                       Th                                          F
                                      C


6 NORDSTROM INC. AND SUBSIDIARIES
re
     to
  eS
Th


            all
            together
            We want to build long-lasting relationships
            with our customers—and we want to be
            wherever they want us to be. Because we are
            one of the few fashion specialty retailers that
            provide customers the convenience of shopping
            multiple channels: in our stores, at Nordstrom
            Racks, through our catalogs or online, we work
            hard to demonstrate this commitment every day.
            Whether it’s a midnight shopping spree on
            nordstrom.com, or a lunchtime dash to the Rack,
            the customer will always find Nordstrom
            represented in the quality, value, selection and
            service each channel provides.


                                                                               7
                                             NORDSTROM INC. AND SUBSIDIARIES
right
            direction
             Ultimately, it’s our customers who judge whether
             or not we are on the right track. Through emails,
             calls, letters and personal feedback on the sales
             floor, they let us know how we are serving them.
             But we know that the best service we can offer is
             to sell them something. As our results reflect, our
             customers are responding positively. In 2002 our
             sales results beat our industry peer group for 10
             consecutive months. And eight months out of those
             10 we achieved comparable sales increases. While
             we still have ground to cover, we are pleased with
             the customer feedback, and with the progress
             we’ve made over the past two years.


8 NORDSTROM INC. AND SUBSIDIARIES
9
NORDSTROM INC. AND SUBSIDIARIES
dear customers,
                employees and shareholders
                 Nordstrom is not a faceless company. It includes our salespeople, department managers,
                 store managers, merchants, support personnel, and our board of directors—all working
                 together to achieve sustained improvement in our results by providing better service to our
                 customers. Ours is not a one-quarter, two-quarter, or even a 2003 story. It’s a story focused
                 on constantly striving to be better, supported by a well-established culture: competitive and
                 empowering, challenging and supportive, flexible in responding to market opportunities,
                 and unyielding in working every day to warrant the trust of our customers, employees,
                 shareholders, and business partners.

                 Our progress in the past year is measured in small but meaningful steps. We set out to
                 improve service, drive top line sales, reduce expenses, and implement our perpetual inventory
                 system nationwide. We’re pleased to report we made progress on all four fronts. For example,
                 comparable store sales, a reflection of customers voting with their hard earned dollars, grew
                 1.4 percent in 2002. We also recognize that in this challenging economic environment in which a
                 number of retailers experienced negative comparable store sales, we made strides in regaining
                 lost market share.

                 We continued to make progress in better managing expenses. Selling, general and
                 administrative expense, as a percentage of sales, showed improvement for the second
                 consecutive year. This expense had grown considerably in recent years relative to our growth
                 in sales. The progress with expenses over the last two years, while modest, moves us in the
                 right direction. Opportunities remain to become more efficient and we intend to act on them,
                 while remaining committed to enhancing the customer experience—in our stores, through
                 our catalogs and online.


                   Blake W. Nordstrom
                                                                                                            Bruce A. Nordstrom
                                                                William D. Ruckelshaus


 John A. McMillan

                                                                           Enrique Hernandez Jr.
                                     Jeanne P. Jackson
10 NORDSTROM INC. AND SUBSIDIARIES
We opened eight full-line stores in 2002, the most we’ve ever opened in a single year,
                    in addition to four Nordstrom Racks and one Façonnable boutique. We also successfully
                    implemented a company-wide perpetual inventory system. While we believe that no
                    implementation is completely seamless when it comes to installing a roughly $200 million
                    information technology system, we were able to accomplish this within the established budget
                    and without a significant misstep. Although our perpetual inventory system is a wonderful tool,
                    it is not the all-encompassing answer. With this technology in place, the responsibility now lies
                    with Nordstrom employees, not the system, to make sure that ultimately our customers benefit
                    from our stores carrying more of the merchandise they are looking for. Our technology will
                    continue to improve in 2003 as we begin implementation of a new point-of-sale system,
                    which will enable our salespeople to be more efficient in sales transactions with customers.

                    Different trends and formats have created a stir within retail over the last few years,
                    from specialty stores in one period, to e-commerce in another, to discounters and increased
                    promotions more recently. Our challenge in 2003 and beyond is to be the best Nordstrom
                    we can be, which we believe is an increasingly attractive niche. While we have a platform
                    that is viable in multiple channels—full-line stores, Racks, Façonnable boutiques,
                    catalogs, Internet—we want to act as one company providing customers with a consistent
                    Nordstrom experience.

                    Thank you for your support of this company. We look forward to continuing to move in the right
                    direction in 2003 and we’re eager to demonstrate through our actions and results why you
                    should continue to be associated with Nordstrom.

                                                                              Sincerely,


                                                                              Blake W. Nordstrom
                                                                              PRESIDENT


                                                        Alfred E. Osborne Jr.
                                                                                                              D. Wayne Gittinger
John N. Nordstrom


                                                                                          Bruce G. Willison

                                                                                                                       Stephanie M. Shern
                                           Alison A. Winter
  For more information regarding these individuals, please turn to page 50.                                                                       11
                                                                                                                NORDSTROM INC. AND SUBSIDIARIES
management’s discussion
and analysis
OVERVIEW                                                                               Percentage of 2002 Sales by Merchandise Category
Nordstrom is a fashion specialty retailer offering a wide selection
                                                                                       Children’s Apparel
of high-quality apparel, shoes and accessories for men, women and                                                      Other 3%
                                                                                       and Accessories 4%
children. We believe that we offer our customers an exceptional
                                                                             Men’s Apparel and
shopping experience by providing superior service and distinctive
                                                                             Furnishings 17%                                                 Women’s Apparel 35%
merchandise with an emphasis on quality and value. We also offer
our products through multiple retail channels including our full-line
stores, Nordstrom Rack stores, our catalogs and on the Internet.

Our financial performance is driven largely by our ability to generate
positive comparable store sales, successfully execute store openings,
manage inventory and control expenses. To that end, our goals for              Shoes 19%
2002 were to drive top-line growth, implement our new perpetual
inventory system and continue lowering expense levels as a percent
                                                                                                                             Women’s Accessories 22%
of sales.

During 2002, we were able to generate comparable store sales gains
of 1.4%. We are encouraged by these gains in this challenging retail     RESULTS OF OPERATIONS:
and economic environment. In recent years, our sales per square          Segment results are discussed in each of the following sections
foot have declined as we have ventured into new markets and              as applicable.
opened new stores. This year our sales per square foot decline
                                                                         Net Sales (in millions)
slowed. In 2002, sales per square foot declined from $321 to
$319, in spite of an 8% expansion in our retail square footage.
                                                                                                              $5,529


                                                                                                                           $5,634


                                                                                                                                    $5,975
                                                                                            $5,049


                                                                                                     $5,149


We substantially completed the implementation of our perpetual
inventory system, which allows us to more effectively manage
                                                                                                                                    •
                                                                                 $6,000
inventory. Additionally, we are implementing a new replenishment
                                                                                 $5,750
system, which is scheduled for completion in the first quarter
                                                                                                                             •
                                                                                                                •
                                                                                 $5,500
of 2003.
                                                                                 $5,250
                                                                                                       •
Progress was made on controlling expenses in the current year.                                 •
                                                                                 $5,000
In 2002, selling, general and administrative expenses as a percent
of sales were down 0.3% to 30.3%. This decrease is in addition                                 98       99     00           01      02

to the 1.0% decrease we achieved in 2001. While we have made
                                                                         Sales increases and comparable store sales are shown in the table
progress in this area, we are still focused on reaching our goal of
                                                                         below. Comparable stores are stores open at least one full fiscal
28.5% to 29.0% of sales in the next few years.
                                                                         year at the beginning of the fiscal year.
Our focus for 2003 is to increase top line growth through positive
comparable store sales and store openings, improve gross margin          Fiscal Year                                    2000                 2001        2002
performance through better inventory control, and further reduce
                                                                         Net sales increase                               7.4%                1.9%        6.1%
our expenses as a percent of sales.
                                                                         Comparable store sales:
                                                                            Full-line stores                              0.2%               (2.6%)       0.7%
                                                                            Nordstrom Rack & other                        1.2%               (5.9%)       7.4%
                                                                            Total                                         0.3%               (2.9%)       1.4%


12 NORDSTROM INC. AND SUBSIDIARIES
management’s discussion
and analysis
In 2002, net sales increased 6.1% over the prior year. This growth       we added new stores, however, inventory per square foot declined
was primarily due to store openings. During 2002, we opened eight        due to improved performance at full-line stores partially offset by
full-line stores, four Nordstrom Rack stores and one Façonnable          inventory increases at our Nordstrom Rack division. Total shrinkage
boutique. We also closed one Nordstrom Rack location. The net            as a percentage of sales was even with the previous year.
impact was an increase to our retail square footage of 8%.
                                                                         Gross profit as a percentage of net sales declined in 2001 due
Comparable store sales increased 1.4% due to increases at both
                                                                         to increased markdowns and new store occupancy expenses.
full-line stores and Nordstrom Rack stores. Sales at Nordstrom
                                                                         The markdowns were taken to drive sales and to liquidate excess
Direct (formerly known as Nordstrom.com) declined slightly with
                                                                         inventory caused by the decrease in comparable store sales.
a planned reduction in catalog sales partially offset by an increase
                                                                         Inventory declines at comparable stores were partially offset by the
in Internet sales.
                                                                         addition of new stores. The comparable stores inventory decrease
Merchandise division sales were led by Women’s Designer, Cosmetics       was due to a concerted effort to reduce inventory levels during the
and Accessories. Men’s Apparel and Shoes experienced small sales         year resulting in lower inventory per square foot. Total shrinkage as
declines. The Women’s Designer division benefited from the               a percentage of sales was even with the previous year.
addition of new vendors, close scrutiny of developing trends and
                                                                         In 2003, we anticipate continuing progress in our ability to improve
a targeted marketing plan. The increase in Cosmetics was primarily
                                                                         gross profit performance through better inventory management.
due to the addition of product lines. Accessories improved by
                                                                         Selling, General and Administrative
differentiating its product and offering attractive values.
                                                                         Fiscal Year                           2000         2001          2002
In 2001, net sales increased 1.9% due to store openings. During
                                                                         Selling, general and administrative
2001, we opened four full-line stores, eight Nordstrom Rack stores
                                                                                                               31.6%        30.6%         30.3%
                                                                           expense as a percent of net sales
and three Façonnable boutiques. We also closed one Nordstrom
Rack store and one full-line store. The net impact was an increase       In 2002, we recognized a charge of $15.6 million to write-down
to our retail square footage of 6%. New store sales were partially       an investment in a supply chain tool intended to support our private
offset by negative comparable store sales and a decline in sales         label division. Due to changes in business strategy, we determined
at Nordstrom Direct. The most significant sales declines were in         that this asset was impaired. This charge reduced this asset to its
Men’s Apparel and Shoes while Women’s Apparel was essentially flat.      estimated market value.
In 2003, we plan to open four full-line stores and two Nordstrom         Excluding the effect of the write-down, selling, general and
Rack stores, increasing retail square footage by approximately 4%.       administrative expenses as a percentage of net sales decreased
Because of the continued challenging retail environment,                 in 2002 to 30.1% from 30.6% in the prior year. This decrease
comparable store sales are expected to be flat to slightly positive.     is the result of improvements in bad debt and selling expense and
                                                                         reductions in sales promotion. These costs were partially offset
Gross Profit
                                                                         by higher distribution costs and higher information systems expense.
Fiscal Year                              2000     2001           2002
                                                                         Bad debt expense decreased as both delinquency and write-off
                                         34.0%    33.2%          33.5%
Gross profit as a percent of net sales
                                                                         trends stabilized. Selling expense decreased primarily due to
                                                                         continued efficiencies in shipping costs at Nordstrom Direct.
Gross profit as a percentage of net sales improved in 2002 due
                                                                         Sales promotion decreased as Nordstrom Direct executed planned
to better inventory management. In our merchandising divisions,
                                                                         reductions in catalog size and number of mailings consistent with
improvement in gross profit rate offset lower sales in certain
                                                                         sales trends. Distribution costs increased primarily due to higher
categories. Merchandise division gross profit was led by both
                                                                         merchandise volumes and temporary inefficiencies caused by the
Women’s and Men’s Apparel. Additionally, costs related to our
                                                                         implementation of our perpetual inventory system. The information
private label operations improved. Total inventory increased as


                                                                                                                  NORDSTROM INC. AND SUBSIDIARIES 13
management’s discussion
and analysis
systems expense increase resulted from depreciation and rollout          Minority Interest Purchase and Reintegration Costs
costs of our new perpetual inventory system.                             During 2002, we purchased the outstanding shares of
                                                                         Nordstrom.com, Inc. series C preferred stock for $70.0 million.
In 2000, we recognized a charge of $13.0 million for certain
                                                                         The excess of the purchase price over the fair market value of the
severance and other costs related to a change in management.
                                                                         preferred stock and professional fees resulted in a one-time charge
Also in 2000, we recorded an impairment charge of $10.2 million.
                                                                         of $42.7 million. No tax benefit was recognized on the share
Due to changes in business strategy, we determined that several
                                                                         purchase, as we do not believe it is probable that this benefit will
software projects under development were either impaired
                                                                         be realized. The impact of not recognizing this income tax benefit
or obsolete.
                                                                         increased our effective tax rate to 47% before the cumulative effect
Excluding the effect of the severance and impairment charge,
                                                                         of accounting change.
selling, general and administrative expenses as a percentage of net
                                                                         Also in 2002, $10.4 million of expense was recognized related
sales decreased in 2001 to 30.6% versus 31.2% in the prior year.
                                                                         to the purchase of the outstanding Nordstrom.com options and
This improvement in selling, general and administrative expenses
                                                                         warrants.
as a percentage of net sales is due to reductions in sales promotion
and improvements in selling expenses. Sales promotion expenses
                                                                         Service Charge Income and Other, Net (in millions)
decreased due to the discontinuation of a company-wide brand
advertising program. Selling expenses decreased as Nordstrom Direct


                                                                                                               $134
                                                                                                        $131


                                                                                                                      $141
                                                                                                 $117
                                                                                         $110


improved the efficiency of their shipping and call center activities.
                                                                                $150
These improvements were partially offset by an increase in bad debt
                                                                                                                      •
                                                                                $140
on our credit cards due to increased delinquencies and write-offs.                                              •
                                                                                                         •
                                                                                $130
In 2003, selling, general and administrative expenses as a percent              $120
                                                                                                  •
of net sales are expected to improve slightly as we continue our                            •
                                                                                $110
focus on expense management.                                                    $100
                                                                                 $90
Interest Expense, Net
                                                                                            98     99    00     01    02
Interest expense, net increased 9.2% in 2002 primarily due to
lower capitalized interest. Capitalized interest decreased due to        Service charge income and other, net increased in 2002 primarily
lower average balances during the year for construction and              due to gains recorded from our VISA securitization. Securitization
software in progress.                                                    gains increased this year as credit spreads improved, the cost
                                                                         of funds decreased and bad debt write-offs stabilized. This
Interest expense, net increased 19.7% in 2001 due to higher
                                                                         increase was partially offset by a decline in service charge
average borrowings, partially offset by a decrease in interest rates.
                                                                         and late fee income resulting from a decline in our private
Interest expense, net for 2003 is expected to be flat with 2002.
                                                                         label accounts receivable.

Write-down of Streamline.com, Inc.                                       Service charge income declined slightly in 2001 due to
                                                                         lower interest rates, flat credit sales and a steady number of
We held an investment in Streamline.com, Inc., an Internet grocery
                                                                         credit accounts.
and consumer goods delivery company. Streamline ceased its
operations effective November 2000. During 2000 we wrote off our         In 2003, service charge income is expected to be higher due
entire investment in Streamline, for a total expense of $32.9 million.   to a small increase in credit sales and credit accounts, and
                                                                         adjustments to interest rates charged.


14 NORDSTROM INC. AND SUBSIDIARIES
management’s discussion
and analysis
Diluted Earnings per Share                                               LIQUIDITY AND CAPITAL RESOURCES
                                                                         We finance our working capital needs, capital expenditures,
                         $1.46


                                 $0.78


                                         $0.93


                                                 $0.66
                $1.41


                                                                         acquisitions and share repurchase activity with a combination
                                                                         of cash flows from operations and borrowings.
       $1.60
                           •
                    •                                                    We believe that our operating cash flows, existing cash and available
       $1.40
                                                                         credit facilities are sufficient to finance our operations and planned
       $1.20
                                                                         growth for the foreseeable future.
       $1.00
                                           •
       $0.80                       •                                     Operating Activities
                                                 •
                                                                         Our operations are seasonal in nature. The second quarter, which
                    98     99     00      01     02

                                                                         includes our Anniversary Sale, accounts for approximately 28%
Earnings per share decreased in 2002 due to the write down               of net sales, while the fourth quarter, which includes the holiday
of the supply chain tool, the minority interest purchase and             season, accounts for about 29% of net sales. Cash requirements
reintegration costs and the cumulative effect of accounting change.      are highest in the third quarter as we build our inventory for the
Excluding the impact of these charges, earnings per share would          holiday season.
have been $1.19, an increase from the prior year of 28.0%. This
                                                                         The decrease in net cash provided by operating activities between
increase was primarily driven by an increase in comparable store
                                                                         2002 and 2001 was primarily due to increases in inventories and
sales, an improvement in gross profit percent and a decrease in
                                                                         accounts receivable partially offset by an increase in net earnings
selling, general and administrative expenses as a percent of sales.
                                                                         before noncash items and an increase in our accrual for income
Earnings per share for 2001 were 19.2% higher than 2000 due to           taxes. Inventory grew as we added stores during the year. Accounts
charges recognized in 2000, which include the write-down of              receivable increased as Nordstrom VISA credit sales improved. The
Streamline, the management severance and the asset impairments.          increased income tax accrual resulted from the timing of payments.
Excluding the impact of these charges, 2000 earnings per share
                                                                         Net cash provided by operating activities increased approximately
would have been $1.04 resulting in a 2001 earnings per share
                                                                         $235 million in 2001 compared to 2000 primarily due to decreases
decrease of 10.6%. This decrease is primarily due to a decline in
                                                                         in inventories and accounts receivable. The inventories decreased
comparable store sales and a decline in gross profit percent offset by
                                                                         as a result of improved inventory management, while accounts
decreases in selling, general and administrative expenses as a
                                                                         receivable declined due to lower credit sales.
percent of sales.
                                                                         In 2003, cash flows provided by operating activities are expected
Fourth Quarter Results                                                   to remain fairly consistent with 2002. Inventory increases from store
                                                                         openings are expected to slow, offset by slower increases in accounts
Fourth quarter 2002 earnings per share were $0.44 compared
                                                                         payable. Accounts receivable should increase modestly as credit
with $0.38 in 2001. Total sales for the quarter increased by 7.3%
                                                                         sales grow.
versus the same quarter in the prior year and comparable store
sales increased by 1.9%. The increase in sales was primarily due
                                                                         Investing Activities
to the opening of eight full-line stores and four Nordstrom Rack
                                                                         For the last three years, investing activities have primarily consisted
stores during the year. Gross profit as a percentage of sales was
                                                                         of capital expenditures, the minority interest purchase of
flat with the same quarter in the prior year.
                                                                         Nordstrom.com and the acquisition of Façonnable.
Selling, general and administrative expenses as a percent of sales
decreased in the quarter compared to the prior year primarily due
to improved selling costs and reduced sales promotion offset by
higher distribution costs and information systems expense.


                                                                                                                 NORDSTROM INC. AND SUBSIDIARIES 15
management’s discussion
and analysis
Capital Expenditures                                                   five years from the acquisition date. If the former owner continues
                                                                       to have involvement in the business and performance targets are
Our capital expenditures over the last three years totaled
                                                                       met, the contingent payment could approximate $12 million.
approximately $738 million, net of developer reimbursements,
                                                                       The contingent payment will be expensed when it becomes
principally to add stores, improve existing facilities and purchase
                                                                       probable that the targets will be met.
or develop new information systems. More than 3.9 million square
feet of retail store space has been added during this period,
                                                                       Financing Activities
representing an increase of 27% since January 31, 2000.
                                                                       Financing activities primarily consist of share repurchases,
We plan to spend approximately $700-$750 million, net of
                                                                       dividend payments, as well as proceeds and payments on debt.
developer reimbursements, on capital projects during the next three
                                                                       Share Repurchase
years. Compared to the previous three years, we plan to open fewer
stores, slow spending on information systems and increase our          In May 1995, the Board of Directors authorized $1.1 billion
spending on the improvement of existing facilities. In the             of share repurchases. As of January 31, 2003, we have purchased
information systems area, we are in the process of replacing our       39 million shares of our common stock for $1 billion, with remaining
point of sale system, which we expect to be substantially completed    share repurchase authority of $82 million. The share repurchase
by 2004.                                                               represents 24% of the shares outstanding as of May 1995 after
                                                                       adjusting for the 1998 stock split, at an average price per share
At January 31, 2003, approximately $227 million has been
                                                                       of $25.93.
contractually committed primarily for the construction of new stores
or remodeling of existing stores. Although we have made
                                                                       Dividends
commitments for stores opening in 2003 and beyond, it is possible
                                                                       In 2002, we paid $.38 per share in common stock dividends,
that some stores may not be opened as scheduled because of delays
                                                                       the sixth consecutive annual dividend increase. We paid $.36
in the development process, or because of the termination of store
                                                                       and $.35 per share of common stock in fiscal 2001 and 2000.
site negotiations.
                                                                       Debt to Capital Ratio
Total Square Footage (in thousands)
                                                                       By the end of 2001, our debt to capital ratio had increased to
                                                                       52.1% as a result of retail expansion, share repurchases and
                                    16, 056
                  13,593


                           14,487


                                                       18,428
                                              17,048


                                                                       an acquisition. By the end of 2002, this ratio had decreased to
                                                                       49.6%. Our near-term goal is to reduce this ratio to be in the
       20,000
                                                       •               range of 40% to 45%.
       18,000
                                                •
                                       •
       16,000
                                                                       Debt
                             •
       14,000
                     •
                                                                       In May 2002, we replaced the $200 million variable funding note
       12,000
                                                                       backed by Nordstrom VISA credit card receivables with 5-year term
       10,000
                                                                       notes also backed by the VISA credit card receivables. Class A and
        8,000
                                                                       B notes with a combined face value of $200 million were issued
                     98       99      00       01      02
                                                                       to third party investors. We used the proceeds to retire the $200
                                                                       million outstanding on the variable funding note. Based on SFAS
Acquisition
                                                                       No. 140 “Accounting for Transfers and Servicing of Financial Assets
In 2000, we acquired Façonnable, S.A.S. in exchange for $88
                                                                       and Extinguishments of Liabilities” this debt and the related assets
million of cash and 5,074,000 shares of our common stock, for
                                                                       are not reflected in our consolidated balance sheets.
a total consideration of $169 million. The purchase provides for
a contingent payment to a former owner that may be paid after


16 NORDSTROM INC. AND SUBSIDIARIES
management’s discussion
and analysis
In November 2001, we issued $300 million of Class A notes              Available Credit
backed by Nordstrom private label receivables. These notes bear        In November 2001, we entered into a $300 million unsecured
a fixed interest rate of 4.82% and have a maturity of five years.      revolving credit facility that expires in November 2004. As of
Both the debt and related assets are included in our consolidated      January 31, 2003, no borrowings have been made against this
balance sheets. A portion of the proceeds was used to pay-down         revolving credit facility.
approximately $77 million in medium-term notes and the purchase
                                                                       Also in November 2001, we issued a variable funding note backed
of Nordstrom.com, Inc.’s preferred stock for $70 million. The
                                                                       by Nordstrom private label receivables with a $200 million capacity.
remaining proceeds will be used for general corporate purposes
                                                                       As of January 31, 2003, no borrowings were outstanding against
and capital expansion.
                                                                       this note.
In October 2000, we issued $300 million of 8.95% senior
                                                                       Additionally, we have universal shelf registrations on file with
notes due in 2005. These proceeds were used to reduce short-term
                                                                       the Securities and Exchange Commission that permit us to offer
indebtedness, to fund the acquisition of Façonnable, and for general
                                                                       an additional $450 million of securities to the public. These
corporate purposes.
                                                                       registration statements allow us to issue various types of securities,
                                                                       including debt, common stock, warrants to purchase common stock,
Interest Rate Swaps
                                                                       warrants to purchase debt securities and warrants to purchase or
We entered into a variable interest rate swap agreement in the
                                                                       sell foreign currency.
fourth quarter of 2002. The swap had a $250 million notional
amount and a six-year term. Under the agreement, we received
                                                                       Contractual Obligations
a fixed rate of 5.63% and paid a variable rate based on LIBOR plus
                                                                       The following table summarizes our contractual obligations and
a margin of 1.31% set at six-month intervals (3.25% at January 31,
                                                                       the expected effect on liquidity and cash flows.
2003). The swap agreement qualified as a fair value hedge and
                                                                                                        Less than         1-3        4-5      Over 5
was recorded at fair value in other assets at January 31, 2003.
                                                                       Fiscal Year              Total      1 Year      Years       Years       Years
Subsequent to January 31, 2003, we sold the interest rate swap
                                                                       Long-term Debt $1,338.4              $5.2     $407.9      $307.1      $618.2
and received cash of $2.3 million, which will be recognized as
                                                                       Capital Leases           16.0         1.1          2.2        2.2        10.5
interest income evenly over the remaining life of the related debt.
                                                                       Operating Leases       780.4         73.2       141.3      123.9        442.0
In the third quarter of 2002, we sold the interest rate swap that
                                                                       Construction
converted our $300 million, 8.95% fixed-rate debt to variable rate.
                                                                         Commitments          227.3        165.2        62.1          —            —
We received cash of $4.9 million, which will be recognized as
                                                                       Total              $2,362.1       $244.7       $613.5     $433.2    $1,070.7
interest income evenly over the remaining life of the related debt.

Noncash Financing
We own 49% of a limited partnership which constructed a new
corporate office building in which we are the primary occupant.
During the first quarter of 2002, the limited partnership refinanced
its construction loan obligation with an $85 million mortgage
secured by the property, of which $79 million was included in
our balance sheet at January 31, 2003. The obligation has a
fixed interest rate of 7.68% and a term of 18 years.


                                                                                                                    NORDSTROM INC. AND SUBSIDIARIES 17
management’s discussion
and analysis
Debt Ratings                                                               approximates the lower of cost or market. Factors considered in
                                                                           determining markdowns include current and anticipated demand,
The following table shows our credit ratings at the date of this report.
                                                                           customer preferences, age of the merchandise and fashion trends.
                                                           Standard
                                                                           We also reserve for obsolescence based on historical trends and
Credit Ratings                             Moody’s*       and Poor’s*
                                                                           specific identification. Shrinkage is estimated as a percentage of
Senior unsecured debt                         Baa1                   A-
                                                                           sales for the period from the last inventory date, based on historical
Commercial paper                                P-2                 A-2
                                                                           shrinkage losses.
* negative outlook

                                                                           Vendor Allowances
These ratings could change depending on our performance and other
                                                                           We receive allowances from merchandise vendors for purchase price
factors. A significant ratings drop could result in the termination
                                                                           adjustments, cooperative advertising programs and cosmetic selling
of the $200 million Nordstrom private label receivables variable
                                                                           expenses. Purchase price adjustments are recorded as a reduction
funding note and a change in interest rates on the $300 million
                                                                           of cost of sales at the point they have been earned and the related
8.95% senior notes and the $300 million revolving credit facility.
                                                                           merchandise has been sold. Allowances for cooperative advertising
The remainder of our outstanding debt is not subject to termination
                                                                           programs and cosmetic selling expenses are recorded as a reduction
or interest rate adjustments based on changes in credit ratings.
                                                                           of selling, general and administrative expense when the advertising
Critical Accounting Policies                                               or selling expense is incurred.
The preparation of our financial statements requires that we make
                                                                           Self Insurance
estimates and judgments that affect the reported amounts of assets,
                                                                           We are self insured for certain losses related to health and welfare,
liabilities, revenues and expenses, and disclosure of contingent
                                                                           workers’ compensation and general liability. We record estimates
assets and liabilities. We regularly evaluate our estimates including
                                                                           of the total cost of claims incurred as of the balance sheet date.
those related to doubtful accounts, inventory valuation, intangible
                                                                           These estimates are based on analysis of historical data and
assets, income taxes, self-insurance liabilities, post-retirement
                                                                           actuarial estimates.
benefits, contingent liabilities and litigation. We base our estimates
on historical experience and on other assumptions that we believe
                                                                           Allowance for Doubtful Accounts
to be reasonable under the circumstances. Actual results may differ
                                                                           We evaluate the collectibility of our customer accounts receivable
from these estimates. The following discussion highlights the
                                                                           based on several factors, including historical trends, aging of
policies we feel are critical.
                                                                           accounts, write-off experience and expectations of future
                                                                           performance. Delinquent accounts are usually written off after
Revenue Recognition
                                                                           the passage of 151 days without receiving a full scheduled
We recognize revenues net of estimated returns and exclude sales
                                                                           monthly payment. Accounts are written off sooner in the event
tax. Retail stores record revenue at the point of sale. Catalog
                                                                           of customer bankruptcy or other circumstances that make further
and Internet sales include shipping revenue and are recorded upon
                                                                           collection unlikely.
delivery to the customer. Our sales return liability is estimated
based on historical return levels.
                                                                           Off-balance Sheet Financing
                                                                           We have $200 million in outstanding term notes backed by our
Inventory
                                                                           Nordstrom VISA credit card receivables. On an ongoing basis,
Our inventory is stated at the lower of cost or market using the retail
                                                                           our Nordstrom VISA receivables are transferred to a master note
inventory method (first-in, first-out basis). Under the retail method,
                                                                           trust which has issued Class A and B notes to third party investors.
inventory is valued by applying a cost-to-retail ratio to the ending
                                                                           We hold securities that represent our retained interests in the trust.
retail value of inventory. As our inventory retail value is adjusted
regularly to reflect market conditions, our inventory method


18 NORDSTROM INC. AND SUBSIDIARIES
management’s discussion
and analysis
We recognize gains or losses on the sale of Nordstrom VISA                SFAS No. 144 “Accounting for the Impairment or Disposal of
receivables to the trust based on the difference between the face         Long-Lived Assets” - SFAS No. 144 retains the fundamental
value of the receivables sold and the fair value of the assets created    provisions of SFAS No. 121, but establishes new criteria for asset
during the securitization process. The fair value of the assets           classification and broadens the scope of qualifying discontinued
is calculated as the present value of their expected cash flows.          operations. The adoption of this statement did not have a material
The discount rates used to calculate present value represent the          impact on our financial statements.
volatility and risk of the assets. Significant assumptions and
                                                                          We adopted SFAS No. 145 “Rescission of FASB Statements No. 4,
judgments are made to estimate the present value of expected
                                                                          44, and 64, Amendment of FASB Statement No. 13, and Technical
cash flows and to determine the fair value of our retained interest.
                                                                          Corrections” in the second quarter of 2002. SFAS No. 145 updates,
We have no other off-balance sheet transactions.
                                                                          clarifies and simplifies existing accounting pronouncements related
                                                                          to extinguishments of debt, provisions of the Motor Carrier Act of
Realization of Deferred Tax Assets
                                                                          1980 and lease transactions. The adoption of this statement did
In January 2003, we sold our Denver Credit facility generating
                                                                          not have a material impact on our financial statements.
a capital gain for tax purposes of $15.4 million, which was used to
                                                                          SFAS No. 146 “Accounting for Costs Associated with Exit or Disposal
offset a portion of our existing capital loss carryforwards. Capital
                                                                          Activities” was also adopted by us in the second quarter of 2002.
loss carryforwards of $19.0 million remain available to offset capital
                                                                          SFAS No. 146 nullifies EITF 94-3 “Liability Recognition for Certain
gain income in the next three years. No valuation allowance reserve
                                                                          Employee Termination Benefits and Other Costs to Exit an Activity
has been provided because we believe it is probable that the full
                                                                          (including Certain Costs Incurred in a Restructuring)” by requiring
benefit of these carryforwards will be realized.
                                                                          that a liability for a cost associated with an exit or disposal activity
Our purchase of the outstanding shares of Nordstrom.com, Inc.
                                                                          be recognized when the liability is incurred versus when an entity is
series C preferred stock resulted in an expense of $40.4 million
                                                                          committed to an exit plan. The adoption of this statement did not
which we believe will not be deductible for tax purposes. As a result,
                                                                          have a material impact on our financial statements.
we have established a valuation allowance reserve of $16.5 million
                                                                          We adopted SFAS No. 148 “Accounting for Stock-Based
to offset the deferred tax asset related to this purchase.
                                                                          Compensation” in the fourth quarter of 2002. SFAS No. 148
Recent Accounting Pronouncements                                          amends SFAS No. 123 of the same name and provides alternative
SFAS No. 141 “Business Combinations” - SFAS No. 141 requires              transition methods for a voluntary change to fair value based
that the purchase method of accounting be used for all business           accounting for stock-based employee compensation. SFAS No. 148
combinations initiated after June 30, 2001, and establishes specific      also requires more prominent and frequent disclosures about the
criteria for the recognition of goodwill separate from other intangible   effects of stock-based compensation. Adoption of SFAS No. 148
assets. Adoption of SFAS No. 141 did not have a material impact           did not have a material impact on our financial statements.
on our financial statements.
                                                                          In November 2002, the Emerging Issues Task Force reached a
SFAS No. 142 “Goodwill and Other Intangible Assets” - Under SFAS          consensus on certain issues discussed in EITF 02-16, “Accounting
No. 142, goodwill and intangible assets having indefinite                 by a Reseller for Cash Consideration Received from a Vendor.”
lives will no longer be amortized but will be subject to annual           This pronouncement addresses the timing and classification of cash
impairment tests. Other intangible assets will continue to be             payments received by a reseller from a vendor. Adoption of EITF 02-
amortized over their estimated useful lives. Adoption of SFAS             16 did not have a material impact on our financial statements.
No. 142 resulted in an impairment charge and a reduction in
                                                                          In November 2002, the FASB issued FIN 45, “Guarantor’s
amortization expense, which is detailed in Note 2 of the Notes
                                                                          Accounting and Disclosure Requirements for Guarantees, Including
to Consolidated Financial Statements.


                                                                                                                   NORDSTROM INC. AND SUBSIDIARIES 19
management’s discussion
and analysis
Indirect Guarantees of the Indebtedness of Others.” FIN 45               and challenges posed by increased competition, shifting consumer
elaborates on the disclosures made by a guarantor and also clarifies     demand, changing consumer credit markets, changing capital
that a guarantor is required to recognize, at the inception of a         markets, changing interest rates and general economic conditions,
guarantee, a liability for the fair value of the obligation undertaken   hiring and retaining effective team members, sourcing merchandise
in issuing the guarantee. Adoption of FIN 45 in the fourth quarter       from domestic and international vendors, investing in new business
of 2002 did not have a material impact on our financial statements.      strategies, achieving our growth objectives and the impact of
                                                                         economic and competitive market forces, including the impact
Cautionary Statement
                                                                         of terrorist activity or the impact of war. As a result, while we
The preceding disclosures included forward-looking statements            believe there is a reasonable basis for the forward-looking
regarding our performance, liquidity and adequacy of capital             statements, you should not place undue reliance on those
resources. These statements are based on our current assumptions         statements. This discussion and analysis should be read
and expectations and are subject to certain risks and uncertainties      in conjunction with the consolidated financial statements
that could cause actual results to differ materially from those          and the Eleven-Year Statistical Summary.
projected. Forward-looking statements are qualified by the risks


20 NORDSTROM INC. AND SUBSIDIARIES
independent auditors’
and management reports
Independent Auditors’ Report                                           Management Report
We have audited the accompanying consolidated balance sheets           We are responsible for preparing our financial statements and the
of Nordstrom, Inc. and subsidiaries (the “Company”) as of January      other information that appears in the annual report. The financial
31, 2003 and 2002, and the related consolidated statements of          statements have been prepared in accordance with accounting
earnings, shareholders’ equity and cash flows for each of the three    principles generally accepted in the United States of America
years in the period ended January 31, 2003. These financial            and include estimates based on our best judgment.
statements are the responsibility of the Company’s management.
                                                                       We maintain a comprehensive system of internal controls and
Our responsibility is to express an opinion on these financial
                                                                       procedures designed to provide reasonable assurance that assets
statements based on our audits.
                                                                       are safeguarded and transactions are executed in accordance with
We conducted our audits in accordance with auditing standards          established procedures. The concept of reasonable assurance
generally accepted in the United States of America. Those standards    is based on the recognition that the cost of maintaining the system
require that we plan and perform the audit to obtain reasonable        of internal accounting controls should not exceed the benefit
assurance about whether the financial statements are free of           derived from the system.
material misstatement. An audit includes examining, on a test
                                                                       Deloitte and Touche LLP audits our financial statements in
basis, evidence supporting the amounts and disclosures in the
                                                                       accordance with auditing standards generally accepted in the
financial statements. An audit also includes assessing the
                                                                       United States of America and provides an objective, independent
accounting principles used and significant estimates made by
                                                                       review of our internal controls and the fairness of our reported
management, as well as evaluating the overall financial statement
                                                                       financial condition and results of operations.
presentation. We believe that our audits provide a reasonable
                                                                       The Audit Committee, which is comprised of six independent
basis for our opinion.
                                                                       directors, meets periodically with our management and the
In our opinion, the accompanying consolidated financial statements
                                                                       independent auditors to ensure that each is properly fulfilling
present fairly, in all material respects, the financial position of
                                                                       its responsibilities. The Committee oversees our systems of
Nordstrom, Inc. and subsidiaries as of January 31, 2003 and 2002,
                                                                       internal control, accounting practices, financial reporting and
and the results of their operations and their cash flows for each of
                                                                       audits to ensure their quality, integrity and objectivity are
the three years in the period ended January 31, 2003, in conformity
                                                                       sufficient to protect shareholders’ investments.
with accounting principles generally accepted in the United States
of America.

The Company changed its method of accounting for goodwill and
other intangible assets upon adoption of Statement of Financial
Accounting Standards No. 142, Goodwill and Other Intangible            Michael G. Koppel
Assets, for the year ended January 31, 2003, as discussed in
                                                                       Executive Vice President and Chief Financial Officer
Note 2 to the consolidated financial statements.


Deloitte & Touche LLP

Seattle, Washington

March 28, 2003


                                                                                                               NORDSTROM INC. AND SUBSIDIARIES 21
consolidated statements of earnings
Dollars in thousands except per share amounts
                                                                                       % of                           % of                   % of
Year ended January 31,                                                 2003            sales                 2002     sales         2001     sales

Net sales                                                      $5,975,076             100.0             $5,634,130    100.0    $5,528,537    100.0
Cost of sales and related
   buying and occupancy                                         (3,971,372)           (66.5)            (3,765,859)   (66.8)   (3,649,516)   (66.0)
Gross profit                                                     2,003,704             33.5              1,868,271     33.2     1,879,021    34.0
Selling, general and administrative                             (1,813,968)            (30.3)           (1,722,635)   (30.6)   (1,747,048)   (31.6)
Operating income                                                   189,736               3.2              145,636       2.6      131,973       2.4
Interest expense, net                                               (81,9 21)           (1.4)              (75,038)    (1.4)      (62,698)    (1.1)
Write-down of investment                                                  —               —                     —        —        (32,857)    (0.6)
Minority interest purchase and reintegration costs                  (53,168)            (0.9)                   —        —             —        —
Service charge income and other, net                               140,977               2.4              133,890       2.4      130,600       2.3
Earnings before income taxes and cumulative
   effect of accounting change                                     195,624               3.3              204,488       3.6       167,018      3.0
Income taxes                                                        (92,0 41 )          (1.6)              (79,800)    (1.4)      (65,100)    (1.2)
Earnings before cumulative effect of
   accounting change                                               103,583               1.7              124,688       2.2       101,918      1.8
Cumulative effect of accounting change
   (net of tax)                                                     (13,359)            (0.2)                   —        —             —        —
Net earnings                                                       $90,224               1.5             $124,688       2.2     $101,918       1.8
Basic earnings per share                                              $0.67                                  $0.93                  $0.78
Diluted earnings per share                                            $0.66                                  $0.93                  $0.78
Cash dividends paid per share                                         $0.38                                  $0.36                  $0.35
The accompanying Notes to Consolidated Financial Statements are an integral part of these statements.


22 NORDSTROM INC. AND SUBSIDIARIES
consolidated balance sheets
Dollars in thousands

January 31,                                                                                                  2003                               2002
Assets
Current assets:
   Cash and cash equivalents                                                                             $208,329                          $331,327
   Accounts receivable, net                                                                               759,262                            698,475
   Merchandise inventories                                                                                953,112                           888,172
   Prepaid expenses                                                                                        40,261                             36,888
   Other current assets                                                                                   111,654                            102,249
Total current assets                                                                                     2,072,618                         2,057,111
Land, buildings and equipment, net                                                                       1,761,544                        1,761,082
Goodwill, net                                                                                              40,355                             38,198
Tradename, net                                                                                            100,133                            100,133
Other assets                                                                                              121,726                             94,655
Total assets                                                                                            $4,096,376                       $4,051,179
Liabilities and Shareholders’ Equity
Current liabilities:
   Notes payable                                                                                             $244                               $148
   Accounts payable                                                                                       414,754                            490,988
   Accrued salaries, wages and related benefits                                                           260,562                           236,373
   Income taxes and other accruals                                                                        188,986                           144,402
   Current portion of long-term debt                                                                        5,545                             78,227
Total current liabilities                                                                                 870,091                           950,138
Long-term debt                                                                                           1,341,826                        1,351,044
Deferred lease credits                                                                                    383,100                           342,046
Other liabilities                                                                                         129,302                             93,463
Shareholders’ equity:
   Common stock, no par:
     500,000,000 shares authorized;
     135,444,041 and 134,468,608
     shares issued and outstanding                                                                        358,069                            341,316
   Unearned stock compensation                                                                              (2,010)                           (2,680)
   Retained earnings                                                                                     1,014,105                          975,203
   Accumulated other comprehensive earnings                                                                 1,893                                 649
Total shareholders’ equity                                                                              1,372,057                         1,314,488
Total liabilities and shareholders’ equity                                                              $4,096,376                       $4,051,179
The accompanying Notes to Consolidated Financial Statements are an integral part of these statements.


                                                                                                                      NORDSTROM INC. AND SUBSIDIARIES 23
consolidated statements
of shareholders’ equity
Dollars in thousands except per share amounts
                                                                                                                                   Accum. Other
                                                                 Common Stock           Unearned Stock               Retained     Comprehensive
                                                          Shares            Amount       Compensation                Earnings          Earnings               Total

Balance at February 1, 2000                      132,279,988             $247,559             $(8,593)            $929,616             $17,032        $1,185,614
   Net earnings                                           —                    —                   —               101,918                  —            101,918
   Other comprehensive earnings:
     Unrealized loss on investment
       during period, net of tax                              —                   —                  —                     —           (23,461)          (23,461)
     Reclassification of realized loss,
       net of tax                                             —                   —                  —                     —              6,429            6,429
     Foreign currency translation
       adjustment                                             —                   —                  —                     —              2,824            2,824
   Comprehensive net earnings:                                —                   —                  —                     —                 —            87,710
   Cash dividends paid
     ($.35 per share)                                         —                   —                  —              (45,935)                  —          (45,935)
   Issuance of common stock for:
     Stock option plans                               181,910                 4,039                 —                      —                  —            4,039
     Employee stock purchase plan                     165,842                 2,211                 —                      —                  —            2,211
     Business acquisition                           5,074,000                77,696                 —                      —                  —           77,696
   Stock compensation                                 (14,075)                (1,111)            4,853                     —                  —            3,742
   Purchase and retirement
     of common stock                              (3,889,908)                   —                   —               (85,509)                 —           (85,509)
Balance at January 31, 2001                      133,797,757               330,394              (3,740)             900,090               2,824        1,229,568
   Net earnings                                           —                     —                   —               124,688                  —           124,688
   Other comprehensive earnings:
     Foreign currency translation
       adjustment                                             —                   —                  —                     —             (2,175)         (2,175)
   Comprehensive net earnings:                                —                   —                  —                     —                 —          122,513
   Cash dividends paid
     ($.36 per share)                                         —                   —                  —              (48,265)                  —          (48,265)
   Issuance of common stock for:
     Stock option plans                                186,165                3,788                 —                      —                  —            3,788
     Employee stock purchase plan                      541,677                6,754                 —                      —                  —            6,754
   Stock compensation                                   19,009                  380              1,060                     —                  —            1,440
   Purchase and retirement
     of common stock                                 (76,000)                   —                   —                 (1,310)                —            (1,310)
Balance at January 31, 2002                      134,468,608               341,316              (2,680)             975,203                 649        1,314,488
   Net earnings                                           —                     —                   —                90,224                  —            90,224
   Other comprehensive earnings:
     Foreign currency translation
       adjustment                                             —                   —                  —                     —             7,755              7,755 (1)
     SERP adjustment, net of tax                              —                   —                  —                     —             (6,511)           (6,511) (1)
   Comprehensive net earnings:                                —                   —                  —                     —                 —            91,468
   Cash dividends paid
     ($.38 per share)                                         —                   —                  —              (51,322)                  —          (51,322)
   Issuance of common stock for:
     Stock option plans                              350,004                 7,959                  —                   —                   —              7,959
     Employee stock purchase plan                    596,351                 8,062                  —                   —                   —              8,062
   Stock compensation                                 29,078                   732                 670                  —                   —              1,402
Balance at January 31, 2003                      135,444,041              $358,069             $(2,010)         $1,014,105              $1,893        $1,372,057
(1)
  The ending balance of the foreign currency translation adjustment and SERP adjustment, net of tax was $8,404 and $(6,511) as of January 31, 2003.
The accompanying Notes to Consolidated Financial Statements are an integral part of these statements.


24 NORDSTROM INC. AND SUBSIDIARIES
Annual Report 2002 Financial Highlights

More Related Content

What's hot

chiquita brands international 2004annual
chiquita brands international 2004annualchiquita brands international 2004annual
chiquita brands international 2004annualfinance49
 
monsanto Q32006EarningsRelease
monsanto Q32006EarningsReleasemonsanto Q32006EarningsRelease
monsanto Q32006EarningsReleasefinance28
 
2001annualreport auto nation
2001annualreport auto nation2001annualreport auto nation
2001annualreport auto nationfinance14
 
an1999 auto nation
an1999 auto nationan1999 auto nation
an1999 auto nationfinance14
 
snxAnnualReport2003
snxAnnualReport2003snxAnnualReport2003
snxAnnualReport2003finance32
 
Big_Lots_AR2005
Big_Lots_AR2005Big_Lots_AR2005
Big_Lots_AR2005finance50
 
Q1/05Schedules_Baxter
Q1/05Schedules_BaxterQ1/05Schedules_Baxter
Q1/05Schedules_Baxterfinance24
 
autozone AZO_03AR
autozone  AZO_03ARautozone  AZO_03AR
autozone AZO_03ARfinance46
 
wal mart store 2000Financials
wal mart store 2000Financialswal mart store 2000Financials
wal mart store 2000Financialsfinance1
 
fiserv annual reports 2004
fiserv annual reports 2004fiserv annual reports 2004
fiserv annual reports 2004finance47
 
2008 Q4 Google Earnings Slides
2008 Q4 Google Earnings Slides2008 Q4 Google Earnings Slides
2008 Q4 Google Earnings Slidesguest3f8836
 
ecolab BusinessFinancial
ecolab  BusinessFinancialecolab  BusinessFinancial
ecolab BusinessFinancialfinance37
 

What's hot (15)

chiquita brands international 2004annual
chiquita brands international 2004annualchiquita brands international 2004annual
chiquita brands international 2004annual
 
monsanto Q32006EarningsRelease
monsanto Q32006EarningsReleasemonsanto Q32006EarningsRelease
monsanto Q32006EarningsRelease
 
usg AR_98
usg AR_98usg AR_98
usg AR_98
 
2001annualreport auto nation
2001annualreport auto nation2001annualreport auto nation
2001annualreport auto nation
 
an1999 auto nation
an1999 auto nationan1999 auto nation
an1999 auto nation
 
snxAnnualReport2003
snxAnnualReport2003snxAnnualReport2003
snxAnnualReport2003
 
Big_Lots_AR2005
Big_Lots_AR2005Big_Lots_AR2005
Big_Lots_AR2005
 
Q1/05Schedules_Baxter
Q1/05Schedules_BaxterQ1/05Schedules_Baxter
Q1/05Schedules_Baxter
 
autozone AZO_03AR
autozone  AZO_03ARautozone  AZO_03AR
autozone AZO_03AR
 
wal mart store 2000Financials
wal mart store 2000Financialswal mart store 2000Financials
wal mart store 2000Financials
 
fiserv annual reports 2004
fiserv annual reports 2004fiserv annual reports 2004
fiserv annual reports 2004
 
2008 Q4 Google Earnings Slides
2008 Q4 Google Earnings Slides2008 Q4 Google Earnings Slides
2008 Q4 Google Earnings Slides
 
2008 Q2 Google Earnings Slides
2008 Q2 Google Earnings Slides2008 Q2 Google Earnings Slides
2008 Q2 Google Earnings Slides
 
2007 Q2 Google Earnings Slides
2007 Q2 Google Earnings Slides2007 Q2 Google Earnings Slides
2007 Q2 Google Earnings Slides
 
ecolab BusinessFinancial
ecolab  BusinessFinancialecolab  BusinessFinancial
ecolab BusinessFinancial
 

Similar to Annual Report 2002 Financial Highlights

southwest airline ar07
southwest airline ar07southwest airline ar07
southwest airline ar07finance40
 
southwest airline ar06
southwest airline ar06southwest airline ar06
southwest airline ar06finance40
 
ecolab Ecolab_BusDesc_FinHigh
ecolab  Ecolab_BusDesc_FinHighecolab  Ecolab_BusDesc_FinHigh
ecolab Ecolab_BusDesc_FinHighfinance37
 
Arvinmeritor2001 Annua lReport
Arvinmeritor2001 Annua lReportArvinmeritor2001 Annua lReport
Arvinmeritor2001 Annua lReportfinance27
 
Arvinmeritor2001 Annual Report
Arvinmeritor2001 Annual ReportArvinmeritor2001 Annual Report
Arvinmeritor2001 Annual Reportfinance27
 
qualcomm annual reports 2004
qualcomm annual reports 2004qualcomm annual reports 2004
qualcomm annual reports 2004finance43
 
ecolab Ecolab_2004_Final
ecolab  Ecolab_2004_Finalecolab  Ecolab_2004_Final
ecolab Ecolab_2004_Finalfinance37
 
ecolab 2003BusinessDescription
ecolab  2003BusinessDescriptionecolab  2003BusinessDescription
ecolab 2003BusinessDescriptionfinance37
 
Timken2006AnnualReport
Timken2006AnnualReportTimken2006AnnualReport
Timken2006AnnualReportfinance39
 
BNSF 95 annrpt
BNSF 95 annrptBNSF 95 annrpt
BNSF 95 annrptfinance16
 
hormel foods ALL1999
hormel foods  ALL1999hormel foods  ALL1999
hormel foods ALL1999finance46
 
hormel foods ALL1999
hormel foods  ALL1999hormel foods  ALL1999
hormel foods ALL1999finance46
 
starbucks Annual_Report_2004_part2
starbucks  Annual_Report_2004_part2starbucks  Annual_Report_2004_part2
starbucks Annual_Report_2004_part2finance41
 
starbucks Annual_Report_2004_part2
starbucks  Annual_Report_2004_part2starbucks  Annual_Report_2004_part2
starbucks Annual_Report_2004_part2finance41
 
sherwin-williams _2005_AR
sherwin-williams  _2005_ARsherwin-williams  _2005_AR
sherwin-williams _2005_ARfinance29
 
williams 2005_AR
williams 2005_ARwilliams 2005_AR
williams 2005_ARfinance21
 
gannett 1998ar
gannett 1998argannett 1998ar
gannett 1998arfinance30
 
gannett 1998ar
gannett 1998argannett 1998ar
gannett 1998arfinance30
 
baxter international Schedules_Q2-05
baxter international Schedules_Q2-05baxter international Schedules_Q2-05
baxter international Schedules_Q2-05finance24
 
hess 01/28/2009 Supplemental Earnings Information
hess 01/28/2009	Supplemental Earnings Informationhess 01/28/2009	Supplemental Earnings Information
hess 01/28/2009 Supplemental Earnings Informationfinance8
 

Similar to Annual Report 2002 Financial Highlights (20)

southwest airline ar07
southwest airline ar07southwest airline ar07
southwest airline ar07
 
southwest airline ar06
southwest airline ar06southwest airline ar06
southwest airline ar06
 
ecolab Ecolab_BusDesc_FinHigh
ecolab  Ecolab_BusDesc_FinHighecolab  Ecolab_BusDesc_FinHigh
ecolab Ecolab_BusDesc_FinHigh
 
Arvinmeritor2001 Annua lReport
Arvinmeritor2001 Annua lReportArvinmeritor2001 Annua lReport
Arvinmeritor2001 Annua lReport
 
Arvinmeritor2001 Annual Report
Arvinmeritor2001 Annual ReportArvinmeritor2001 Annual Report
Arvinmeritor2001 Annual Report
 
qualcomm annual reports 2004
qualcomm annual reports 2004qualcomm annual reports 2004
qualcomm annual reports 2004
 
ecolab Ecolab_2004_Final
ecolab  Ecolab_2004_Finalecolab  Ecolab_2004_Final
ecolab Ecolab_2004_Final
 
ecolab 2003BusinessDescription
ecolab  2003BusinessDescriptionecolab  2003BusinessDescription
ecolab 2003BusinessDescription
 
Timken2006AnnualReport
Timken2006AnnualReportTimken2006AnnualReport
Timken2006AnnualReport
 
BNSF 95 annrpt
BNSF 95 annrptBNSF 95 annrpt
BNSF 95 annrpt
 
hormel foods ALL1999
hormel foods  ALL1999hormel foods  ALL1999
hormel foods ALL1999
 
hormel foods ALL1999
hormel foods  ALL1999hormel foods  ALL1999
hormel foods ALL1999
 
starbucks Annual_Report_2004_part2
starbucks  Annual_Report_2004_part2starbucks  Annual_Report_2004_part2
starbucks Annual_Report_2004_part2
 
starbucks Annual_Report_2004_part2
starbucks  Annual_Report_2004_part2starbucks  Annual_Report_2004_part2
starbucks Annual_Report_2004_part2
 
sherwin-williams _2005_AR
sherwin-williams  _2005_ARsherwin-williams  _2005_AR
sherwin-williams _2005_AR
 
williams 2005_AR
williams 2005_ARwilliams 2005_AR
williams 2005_AR
 
gannett 1998ar
gannett 1998argannett 1998ar
gannett 1998ar
 
gannett 1998ar
gannett 1998argannett 1998ar
gannett 1998ar
 
baxter international Schedules_Q2-05
baxter international Schedules_Q2-05baxter international Schedules_Q2-05
baxter international Schedules_Q2-05
 
hess 01/28/2009 Supplemental Earnings Information
hess 01/28/2009	Supplemental Earnings Informationhess 01/28/2009	Supplemental Earnings Information
hess 01/28/2009 Supplemental Earnings Information
 

More from finance43

nordstrom R2001AR
nordstrom R2001ARnordstrom R2001AR
nordstrom R2001ARfinance43
 
nordstrom R2001AR
nordstrom R2001ARnordstrom R2001AR
nordstrom R2001ARfinance43
 
nordstrom R2002AR
nordstrom R2002ARnordstrom R2002AR
nordstrom R2002ARfinance43
 
nordstrom 2003annualreport
nordstrom 2003annualreportnordstrom 2003annualreport
nordstrom 2003annualreportfinance43
 
nordstrom 2003annualreport
nordstrom 2003annualreportnordstrom 2003annualreport
nordstrom 2003annualreportfinance43
 
nordstrom 2004_AR
nordstrom 2004_ARnordstrom 2004_AR
nordstrom 2004_ARfinance43
 
nordstrom 2004_AR
nordstrom 2004_ARnordstrom 2004_AR
nordstrom 2004_ARfinance43
 
nordstrom 4AF8C938-BCC4-4A47-BC67-CACBB3E4E66F_JWN200810-K
nordstrom 4AF8C938-BCC4-4A47-BC67-CACBB3E4E66F_JWN200810-Knordstrom 4AF8C938-BCC4-4A47-BC67-CACBB3E4E66F_JWN200810-K
nordstrom 4AF8C938-BCC4-4A47-BC67-CACBB3E4E66F_JWN200810-Kfinance43
 
nordstrom 4AF8C938-BCC4-4A47-BC67-CACBB3E4E66F_JWN200810-K
nordstrom 4AF8C938-BCC4-4A47-BC67-CACBB3E4E66F_JWN200810-Knordstrom 4AF8C938-BCC4-4A47-BC67-CACBB3E4E66F_JWN200810-K
nordstrom 4AF8C938-BCC4-4A47-BC67-CACBB3E4E66F_JWN200810-Kfinance43
 
nordstrom AR_FULL
nordstrom AR_FULLnordstrom AR_FULL
nordstrom AR_FULLfinance43
 
nordstrom AnnualReport2006
nordstrom AnnualReport2006nordstrom AnnualReport2006
nordstrom AnnualReport2006finance43
 
nordstrom AnnualReport2006
nordstrom AnnualReport2006nordstrom AnnualReport2006
nordstrom AnnualReport2006finance43
 
nordstrom JWN2007Form10K
nordstrom JWN2007Form10Knordstrom JWN2007Form10K
nordstrom JWN2007Form10Kfinance43
 
nordstrom JWN2007Form10K
nordstrom JWN2007Form10Knordstrom JWN2007Form10K
nordstrom JWN2007Form10Kfinance43
 
nordstrom 4AF8C938-BCC4-4A47-BC67-CACBB3E4E66F_JWN200810-K
nordstrom 4AF8C938-BCC4-4A47-BC67-CACBB3E4E66F_JWN200810-Knordstrom 4AF8C938-BCC4-4A47-BC67-CACBB3E4E66F_JWN200810-K
nordstrom 4AF8C938-BCC4-4A47-BC67-CACBB3E4E66F_JWN200810-Kfinance43
 
nordstrom 4AF8C938-BCC4-4A47-BC67-CACBB3E4E66F_JWN200810-K
nordstrom 4AF8C938-BCC4-4A47-BC67-CACBB3E4E66F_JWN200810-Knordstrom 4AF8C938-BCC4-4A47-BC67-CACBB3E4E66F_JWN200810-K
nordstrom 4AF8C938-BCC4-4A47-BC67-CACBB3E4E66F_JWN200810-Kfinance43
 

More from finance43 (20)

NOR99AR
NOR99ARNOR99AR
NOR99AR
 
NOR99AR
NOR99ARNOR99AR
NOR99AR
 
NOR2000AR
NOR2000ARNOR2000AR
NOR2000AR
 
NOR2000AR
NOR2000ARNOR2000AR
NOR2000AR
 
nordstrom R2001AR
nordstrom R2001ARnordstrom R2001AR
nordstrom R2001AR
 
nordstrom R2001AR
nordstrom R2001ARnordstrom R2001AR
nordstrom R2001AR
 
nordstrom R2002AR
nordstrom R2002ARnordstrom R2002AR
nordstrom R2002AR
 
nordstrom 2003annualreport
nordstrom 2003annualreportnordstrom 2003annualreport
nordstrom 2003annualreport
 
nordstrom 2003annualreport
nordstrom 2003annualreportnordstrom 2003annualreport
nordstrom 2003annualreport
 
nordstrom 2004_AR
nordstrom 2004_ARnordstrom 2004_AR
nordstrom 2004_AR
 
nordstrom 2004_AR
nordstrom 2004_ARnordstrom 2004_AR
nordstrom 2004_AR
 
nordstrom 4AF8C938-BCC4-4A47-BC67-CACBB3E4E66F_JWN200810-K
nordstrom 4AF8C938-BCC4-4A47-BC67-CACBB3E4E66F_JWN200810-Knordstrom 4AF8C938-BCC4-4A47-BC67-CACBB3E4E66F_JWN200810-K
nordstrom 4AF8C938-BCC4-4A47-BC67-CACBB3E4E66F_JWN200810-K
 
nordstrom 4AF8C938-BCC4-4A47-BC67-CACBB3E4E66F_JWN200810-K
nordstrom 4AF8C938-BCC4-4A47-BC67-CACBB3E4E66F_JWN200810-Knordstrom 4AF8C938-BCC4-4A47-BC67-CACBB3E4E66F_JWN200810-K
nordstrom 4AF8C938-BCC4-4A47-BC67-CACBB3E4E66F_JWN200810-K
 
nordstrom AR_FULL
nordstrom AR_FULLnordstrom AR_FULL
nordstrom AR_FULL
 
nordstrom AnnualReport2006
nordstrom AnnualReport2006nordstrom AnnualReport2006
nordstrom AnnualReport2006
 
nordstrom AnnualReport2006
nordstrom AnnualReport2006nordstrom AnnualReport2006
nordstrom AnnualReport2006
 
nordstrom JWN2007Form10K
nordstrom JWN2007Form10Knordstrom JWN2007Form10K
nordstrom JWN2007Form10K
 
nordstrom JWN2007Form10K
nordstrom JWN2007Form10Knordstrom JWN2007Form10K
nordstrom JWN2007Form10K
 
nordstrom 4AF8C938-BCC4-4A47-BC67-CACBB3E4E66F_JWN200810-K
nordstrom 4AF8C938-BCC4-4A47-BC67-CACBB3E4E66F_JWN200810-Knordstrom 4AF8C938-BCC4-4A47-BC67-CACBB3E4E66F_JWN200810-K
nordstrom 4AF8C938-BCC4-4A47-BC67-CACBB3E4E66F_JWN200810-K
 
nordstrom 4AF8C938-BCC4-4A47-BC67-CACBB3E4E66F_JWN200810-K
nordstrom 4AF8C938-BCC4-4A47-BC67-CACBB3E4E66F_JWN200810-Knordstrom 4AF8C938-BCC4-4A47-BC67-CACBB3E4E66F_JWN200810-K
nordstrom 4AF8C938-BCC4-4A47-BC67-CACBB3E4E66F_JWN200810-K
 

Recently uploaded

The Core Functions of the Bangko Sentral ng Pilipinas
The Core Functions of the Bangko Sentral ng PilipinasThe Core Functions of the Bangko Sentral ng Pilipinas
The Core Functions of the Bangko Sentral ng PilipinasCherylouCamus
 
Tenets of Physiocracy History of Economic
Tenets of Physiocracy History of EconomicTenets of Physiocracy History of Economic
Tenets of Physiocracy History of Economiccinemoviesu
 
原版1:1复刻堪萨斯大学毕业证KU毕业证留信学历认证
原版1:1复刻堪萨斯大学毕业证KU毕业证留信学历认证原版1:1复刻堪萨斯大学毕业证KU毕业证留信学历认证
原版1:1复刻堪萨斯大学毕业证KU毕业证留信学历认证jdkhjh
 
chapter_2.ppt The labour market definitions and trends
chapter_2.ppt The labour market definitions and trendschapter_2.ppt The labour market definitions and trends
chapter_2.ppt The labour market definitions and trendslemlemtesfaye192
 
BPPG response - Options for Defined Benefit schemes - 19Apr24.pdf
BPPG response - Options for Defined Benefit schemes - 19Apr24.pdfBPPG response - Options for Defined Benefit schemes - 19Apr24.pdf
BPPG response - Options for Defined Benefit schemes - 19Apr24.pdfHenry Tapper
 
letter-from-the-chair-to-the-fca-relating-to-british-steel-pensions-scheme-15...
letter-from-the-chair-to-the-fca-relating-to-british-steel-pensions-scheme-15...letter-from-the-chair-to-the-fca-relating-to-british-steel-pensions-scheme-15...
letter-from-the-chair-to-the-fca-relating-to-british-steel-pensions-scheme-15...Henry Tapper
 
Call Girls Near Me WhatsApp:+91-9833363713
Call Girls Near Me WhatsApp:+91-9833363713Call Girls Near Me WhatsApp:+91-9833363713
Call Girls Near Me WhatsApp:+91-9833363713Sonam Pathan
 
(办理学位证)加拿大萨省大学毕业证成绩单原版一比一
(办理学位证)加拿大萨省大学毕业证成绩单原版一比一(办理学位证)加拿大萨省大学毕业证成绩单原版一比一
(办理学位证)加拿大萨省大学毕业证成绩单原版一比一S SDS
 
Authentic No 1 Amil Baba In Pakistan Authentic No 1 Amil Baba In Karachi No 1...
Authentic No 1 Amil Baba In Pakistan Authentic No 1 Amil Baba In Karachi No 1...Authentic No 1 Amil Baba In Pakistan Authentic No 1 Amil Baba In Karachi No 1...
Authentic No 1 Amil Baba In Pakistan Authentic No 1 Amil Baba In Karachi No 1...First NO1 World Amil baba in Faisalabad
 
Bladex 1Q24 Earning Results Presentation
Bladex 1Q24 Earning Results PresentationBladex 1Q24 Earning Results Presentation
Bladex 1Q24 Earning Results PresentationBladex
 
Economic Risk Factor Update: April 2024 [SlideShare]
Economic Risk Factor Update: April 2024 [SlideShare]Economic Risk Factor Update: April 2024 [SlideShare]
Economic Risk Factor Update: April 2024 [SlideShare]Commonwealth
 
Stock Market Brief Deck FOR 4/17 video.pdf
Stock Market Brief Deck FOR 4/17 video.pdfStock Market Brief Deck FOR 4/17 video.pdf
Stock Market Brief Deck FOR 4/17 video.pdfMichael Silva
 
Current Economic situation of Pakistan .pptx
Current Economic situation of Pakistan .pptxCurrent Economic situation of Pakistan .pptx
Current Economic situation of Pakistan .pptxuzma244191
 
Interimreport1 January–31 March2024 Elo Mutual Pension Insurance Company
Interimreport1 January–31 March2024 Elo Mutual Pension Insurance CompanyInterimreport1 January–31 March2024 Elo Mutual Pension Insurance Company
Interimreport1 January–31 March2024 Elo Mutual Pension Insurance CompanyTyöeläkeyhtiö Elo
 
PMFBY , Pradhan Mantri Fasal bima yojna
PMFBY , Pradhan Mantri  Fasal bima yojnaPMFBY , Pradhan Mantri  Fasal bima yojna
PMFBY , Pradhan Mantri Fasal bima yojnaDharmendra Kumar
 
fca-bsps-decision-letter-redacted (1).pdf
fca-bsps-decision-letter-redacted (1).pdffca-bsps-decision-letter-redacted (1).pdf
fca-bsps-decision-letter-redacted (1).pdfHenry Tapper
 
NO1 WorldWide Genuine vashikaran specialist Vashikaran baba near Lahore Vashi...
NO1 WorldWide Genuine vashikaran specialist Vashikaran baba near Lahore Vashi...NO1 WorldWide Genuine vashikaran specialist Vashikaran baba near Lahore Vashi...
NO1 WorldWide Genuine vashikaran specialist Vashikaran baba near Lahore Vashi...Amil baba
 
NO1 WorldWide Love marriage specialist baba ji Amil Baba Kala ilam powerful v...
NO1 WorldWide Love marriage specialist baba ji Amil Baba Kala ilam powerful v...NO1 WorldWide Love marriage specialist baba ji Amil Baba Kala ilam powerful v...
NO1 WorldWide Love marriage specialist baba ji Amil Baba Kala ilam powerful v...Amil baba
 
Stock Market Brief Deck for 4/24/24 .pdf
Stock Market Brief Deck for 4/24/24 .pdfStock Market Brief Deck for 4/24/24 .pdf
Stock Market Brief Deck for 4/24/24 .pdfMichael Silva
 

Recently uploaded (20)

The Core Functions of the Bangko Sentral ng Pilipinas
The Core Functions of the Bangko Sentral ng PilipinasThe Core Functions of the Bangko Sentral ng Pilipinas
The Core Functions of the Bangko Sentral ng Pilipinas
 
Tenets of Physiocracy History of Economic
Tenets of Physiocracy History of EconomicTenets of Physiocracy History of Economic
Tenets of Physiocracy History of Economic
 
原版1:1复刻堪萨斯大学毕业证KU毕业证留信学历认证
原版1:1复刻堪萨斯大学毕业证KU毕业证留信学历认证原版1:1复刻堪萨斯大学毕业证KU毕业证留信学历认证
原版1:1复刻堪萨斯大学毕业证KU毕业证留信学历认证
 
chapter_2.ppt The labour market definitions and trends
chapter_2.ppt The labour market definitions and trendschapter_2.ppt The labour market definitions and trends
chapter_2.ppt The labour market definitions and trends
 
BPPG response - Options for Defined Benefit schemes - 19Apr24.pdf
BPPG response - Options for Defined Benefit schemes - 19Apr24.pdfBPPG response - Options for Defined Benefit schemes - 19Apr24.pdf
BPPG response - Options for Defined Benefit schemes - 19Apr24.pdf
 
letter-from-the-chair-to-the-fca-relating-to-british-steel-pensions-scheme-15...
letter-from-the-chair-to-the-fca-relating-to-british-steel-pensions-scheme-15...letter-from-the-chair-to-the-fca-relating-to-british-steel-pensions-scheme-15...
letter-from-the-chair-to-the-fca-relating-to-british-steel-pensions-scheme-15...
 
Call Girls Near Me WhatsApp:+91-9833363713
Call Girls Near Me WhatsApp:+91-9833363713Call Girls Near Me WhatsApp:+91-9833363713
Call Girls Near Me WhatsApp:+91-9833363713
 
(办理学位证)加拿大萨省大学毕业证成绩单原版一比一
(办理学位证)加拿大萨省大学毕业证成绩单原版一比一(办理学位证)加拿大萨省大学毕业证成绩单原版一比一
(办理学位证)加拿大萨省大学毕业证成绩单原版一比一
 
Authentic No 1 Amil Baba In Pakistan Authentic No 1 Amil Baba In Karachi No 1...
Authentic No 1 Amil Baba In Pakistan Authentic No 1 Amil Baba In Karachi No 1...Authentic No 1 Amil Baba In Pakistan Authentic No 1 Amil Baba In Karachi No 1...
Authentic No 1 Amil Baba In Pakistan Authentic No 1 Amil Baba In Karachi No 1...
 
Bladex 1Q24 Earning Results Presentation
Bladex 1Q24 Earning Results PresentationBladex 1Q24 Earning Results Presentation
Bladex 1Q24 Earning Results Presentation
 
Economic Risk Factor Update: April 2024 [SlideShare]
Economic Risk Factor Update: April 2024 [SlideShare]Economic Risk Factor Update: April 2024 [SlideShare]
Economic Risk Factor Update: April 2024 [SlideShare]
 
🔝+919953056974 🔝young Delhi Escort service Pusa Road
🔝+919953056974 🔝young Delhi Escort service Pusa Road🔝+919953056974 🔝young Delhi Escort service Pusa Road
🔝+919953056974 🔝young Delhi Escort service Pusa Road
 
Stock Market Brief Deck FOR 4/17 video.pdf
Stock Market Brief Deck FOR 4/17 video.pdfStock Market Brief Deck FOR 4/17 video.pdf
Stock Market Brief Deck FOR 4/17 video.pdf
 
Current Economic situation of Pakistan .pptx
Current Economic situation of Pakistan .pptxCurrent Economic situation of Pakistan .pptx
Current Economic situation of Pakistan .pptx
 
Interimreport1 January–31 March2024 Elo Mutual Pension Insurance Company
Interimreport1 January–31 March2024 Elo Mutual Pension Insurance CompanyInterimreport1 January–31 March2024 Elo Mutual Pension Insurance Company
Interimreport1 January–31 March2024 Elo Mutual Pension Insurance Company
 
PMFBY , Pradhan Mantri Fasal bima yojna
PMFBY , Pradhan Mantri  Fasal bima yojnaPMFBY , Pradhan Mantri  Fasal bima yojna
PMFBY , Pradhan Mantri Fasal bima yojna
 
fca-bsps-decision-letter-redacted (1).pdf
fca-bsps-decision-letter-redacted (1).pdffca-bsps-decision-letter-redacted (1).pdf
fca-bsps-decision-letter-redacted (1).pdf
 
NO1 WorldWide Genuine vashikaran specialist Vashikaran baba near Lahore Vashi...
NO1 WorldWide Genuine vashikaran specialist Vashikaran baba near Lahore Vashi...NO1 WorldWide Genuine vashikaran specialist Vashikaran baba near Lahore Vashi...
NO1 WorldWide Genuine vashikaran specialist Vashikaran baba near Lahore Vashi...
 
NO1 WorldWide Love marriage specialist baba ji Amil Baba Kala ilam powerful v...
NO1 WorldWide Love marriage specialist baba ji Amil Baba Kala ilam powerful v...NO1 WorldWide Love marriage specialist baba ji Amil Baba Kala ilam powerful v...
NO1 WorldWide Love marriage specialist baba ji Amil Baba Kala ilam powerful v...
 
Stock Market Brief Deck for 4/24/24 .pdf
Stock Market Brief Deck for 4/24/24 .pdfStock Market Brief Deck for 4/24/24 .pdf
Stock Market Brief Deck for 4/24/24 .pdf
 

Annual Report 2002 Financial Highlights

  • 2. financial highlights Dollars in thousands except per share amounts 2001 % Change Fiscal Year 2002 $5,975,076 $5,634,130 6.1 Net sales Earnings before income taxes and 195,624 204,488 (4.3) cumulative effect of accounting change 103,583 124,688 (16.9) Earnings before cumulative effect of accounting change 90,224 124,688 (27.6) Net earnings .67 .93 (28.0) Basic earnings per share .66 .93 (29.0) Diluted earnings per share .38 .36 5.6 Cash dividends paid per share Comp-Store Sales % Change Sales per Square Foot $395 $381 $383 $384 $382 4.4% $377 4.0% $362 $350 •• • • • $342 • • • $321 $319 • 2.7% • • 1.4% 1.4% • • • 0.6% 0.3% -2.9% -0.7% -2.7% -1.1% • • • • • • • • 92 93 94 95 96 97 98 99 00 01 02 92 93 94 95 96 97 98 99 00 01 02 SG&A as a % of Sales Gross Profit % of Sales 31.6% 34.8% 30.6% 30.3% 34.0% 33.8% 33.5% 29.6% 33.3% 33.2% • 32.2% 28.3% • 31.9% 27.7% • 31.6% 27.6% 31.2% • • 27.5% • • 30.9% • • • 26.4% 26.4% 26.2% • • • •• • • • • • •• 92 93 94 95 96 97 98 99 00 01 02 92 93 94 95 96 97 98 99 00 01 02 Table of contents 46 Retail Store Facilities 24 Consolidated Statements of Shareholders’ Equity 12 Management’s Discussion and Analysis 48 Officers of the Corporation and Executive Team 25 Consolidated Statements of Cash Flows 21 Independent Auditors’ and Management Reports 49 Board of Directors 26 Notes to Consolidated Financial Statements 22 Consolidated Statements of Earnings 49 Shareholder Information 44 Eleven-Year Statistical Summary 23 Consolidated Balance Sheets View this entire report online. Please visit www.nordstrom.com to see this report and obtain the latest available information.
  • 3. The saying goes, “It’s the little things that count.” We’d like to add—it’s the big ones too. In fact, it all counts when it comes to customer satisfaction. quality experience Our focus at Nordstrom is simple—take care of the customer and offer a wide selection of quality, distinctive merchandise at fair prices every day. It is this commitment that ultimately drives sales and results. Everything we do, directly or indirectly, supports our focus on our customers. And our story always begins with our people…
  • 4. our pleasure In a competitive retail environment, you must have the best people in the industry on the sales floor. We look for people who will approach work with pride and ownership. Our salespeople are empowered to do whatever it takes to make the customer happy. Every day, they find new ways to respond to each customer’s needs. In addition to anticipating what the customer wants, we offer special services that enhance the shopping experience. Whether someone needs a gift wrapped in our signature pewter and silver boxes (of course, free of charge), last minute alterations, or a complimentary makeover, our services are a unique complement to our superior salespeople. BP. Salesperson Nicole Rhotton, Mission Viejo, CA Personal Touch Personal shopping specialist Eun Kim, Michigan Ave., IL Café Bistro BP. Shoe Salesperson Jose “Pepe” Ruvalcaba, Mission Viejo, CA Russell Felicitas, Downtown Seattle, WA Concierge Cynthia Sanchez, Michigan Ave., IL 2 NORDSTROM INC. AND SUBSIDIARIES
  • 5. “As shoe merchants, we were raised kneeling in front of customers, and I believe this represents the essence of our company’s values and the very core of our culture.” Bruce Nordstrom CHAIRMAN OF THE BOARD Men’s Clothing Salesperson Million-dollar seller Larry Smiley, Michigan Ave., IL Alterations Deena Vu, Bellevue Sq., WA Regional Fit Specialist Lingerie and Prosthesis Cosmetics Skincare Specialist Debra Duden, Oak Brook, IL Claudia Myszko, Mission Viejo, CA 3 NORDSTROM INC. AND SUBSIDIARIES
  • 6. 4 NORDSTROM INC. AND SUBSIDIARIES
  • 7. distinctive merchandise Our goal is to offer a well-edited range of products for a variety of lifestyles. We serve a broad base of customers and work hard to offer them an appealing combination of unique vendors, national and exclusive brands and private label merchandise. To have the merchandise when the customer wants it is the highest form of service we can provide. We won’t be undersold, and we stand by our commitment to provide the best possible price for every item sold in our stores. Customers want fresh, compelling merchandise and they recognize quality and value. When we focus on those things it’s possible to send more customers home happy—with a shopping bag in hand. 5 NORDSTROM INC. AND SUBSIDIARIES
  • 8. m co . le om ab k c str log n Ra on rd ata aç e no Th F C 6 NORDSTROM INC. AND SUBSIDIARIES
  • 9. re to eS Th all together We want to build long-lasting relationships with our customers—and we want to be wherever they want us to be. Because we are one of the few fashion specialty retailers that provide customers the convenience of shopping multiple channels: in our stores, at Nordstrom Racks, through our catalogs or online, we work hard to demonstrate this commitment every day. Whether it’s a midnight shopping spree on nordstrom.com, or a lunchtime dash to the Rack, the customer will always find Nordstrom represented in the quality, value, selection and service each channel provides. 7 NORDSTROM INC. AND SUBSIDIARIES
  • 10. right direction Ultimately, it’s our customers who judge whether or not we are on the right track. Through emails, calls, letters and personal feedback on the sales floor, they let us know how we are serving them. But we know that the best service we can offer is to sell them something. As our results reflect, our customers are responding positively. In 2002 our sales results beat our industry peer group for 10 consecutive months. And eight months out of those 10 we achieved comparable sales increases. While we still have ground to cover, we are pleased with the customer feedback, and with the progress we’ve made over the past two years. 8 NORDSTROM INC. AND SUBSIDIARIES
  • 11. 9 NORDSTROM INC. AND SUBSIDIARIES
  • 12. dear customers, employees and shareholders Nordstrom is not a faceless company. It includes our salespeople, department managers, store managers, merchants, support personnel, and our board of directors—all working together to achieve sustained improvement in our results by providing better service to our customers. Ours is not a one-quarter, two-quarter, or even a 2003 story. It’s a story focused on constantly striving to be better, supported by a well-established culture: competitive and empowering, challenging and supportive, flexible in responding to market opportunities, and unyielding in working every day to warrant the trust of our customers, employees, shareholders, and business partners. Our progress in the past year is measured in small but meaningful steps. We set out to improve service, drive top line sales, reduce expenses, and implement our perpetual inventory system nationwide. We’re pleased to report we made progress on all four fronts. For example, comparable store sales, a reflection of customers voting with their hard earned dollars, grew 1.4 percent in 2002. We also recognize that in this challenging economic environment in which a number of retailers experienced negative comparable store sales, we made strides in regaining lost market share. We continued to make progress in better managing expenses. Selling, general and administrative expense, as a percentage of sales, showed improvement for the second consecutive year. This expense had grown considerably in recent years relative to our growth in sales. The progress with expenses over the last two years, while modest, moves us in the right direction. Opportunities remain to become more efficient and we intend to act on them, while remaining committed to enhancing the customer experience—in our stores, through our catalogs and online. Blake W. Nordstrom Bruce A. Nordstrom William D. Ruckelshaus John A. McMillan Enrique Hernandez Jr. Jeanne P. Jackson 10 NORDSTROM INC. AND SUBSIDIARIES
  • 13. We opened eight full-line stores in 2002, the most we’ve ever opened in a single year, in addition to four Nordstrom Racks and one Façonnable boutique. We also successfully implemented a company-wide perpetual inventory system. While we believe that no implementation is completely seamless when it comes to installing a roughly $200 million information technology system, we were able to accomplish this within the established budget and without a significant misstep. Although our perpetual inventory system is a wonderful tool, it is not the all-encompassing answer. With this technology in place, the responsibility now lies with Nordstrom employees, not the system, to make sure that ultimately our customers benefit from our stores carrying more of the merchandise they are looking for. Our technology will continue to improve in 2003 as we begin implementation of a new point-of-sale system, which will enable our salespeople to be more efficient in sales transactions with customers. Different trends and formats have created a stir within retail over the last few years, from specialty stores in one period, to e-commerce in another, to discounters and increased promotions more recently. Our challenge in 2003 and beyond is to be the best Nordstrom we can be, which we believe is an increasingly attractive niche. While we have a platform that is viable in multiple channels—full-line stores, Racks, Façonnable boutiques, catalogs, Internet—we want to act as one company providing customers with a consistent Nordstrom experience. Thank you for your support of this company. We look forward to continuing to move in the right direction in 2003 and we’re eager to demonstrate through our actions and results why you should continue to be associated with Nordstrom. Sincerely, Blake W. Nordstrom PRESIDENT Alfred E. Osborne Jr. D. Wayne Gittinger John N. Nordstrom Bruce G. Willison Stephanie M. Shern Alison A. Winter For more information regarding these individuals, please turn to page 50. 11 NORDSTROM INC. AND SUBSIDIARIES
  • 14. management’s discussion and analysis OVERVIEW Percentage of 2002 Sales by Merchandise Category Nordstrom is a fashion specialty retailer offering a wide selection Children’s Apparel of high-quality apparel, shoes and accessories for men, women and Other 3% and Accessories 4% children. We believe that we offer our customers an exceptional Men’s Apparel and shopping experience by providing superior service and distinctive Furnishings 17% Women’s Apparel 35% merchandise with an emphasis on quality and value. We also offer our products through multiple retail channels including our full-line stores, Nordstrom Rack stores, our catalogs and on the Internet. Our financial performance is driven largely by our ability to generate positive comparable store sales, successfully execute store openings, manage inventory and control expenses. To that end, our goals for Shoes 19% 2002 were to drive top-line growth, implement our new perpetual inventory system and continue lowering expense levels as a percent Women’s Accessories 22% of sales. During 2002, we were able to generate comparable store sales gains of 1.4%. We are encouraged by these gains in this challenging retail RESULTS OF OPERATIONS: and economic environment. In recent years, our sales per square Segment results are discussed in each of the following sections foot have declined as we have ventured into new markets and as applicable. opened new stores. This year our sales per square foot decline Net Sales (in millions) slowed. In 2002, sales per square foot declined from $321 to $319, in spite of an 8% expansion in our retail square footage. $5,529 $5,634 $5,975 $5,049 $5,149 We substantially completed the implementation of our perpetual inventory system, which allows us to more effectively manage • $6,000 inventory. Additionally, we are implementing a new replenishment $5,750 system, which is scheduled for completion in the first quarter • • $5,500 of 2003. $5,250 • Progress was made on controlling expenses in the current year. • $5,000 In 2002, selling, general and administrative expenses as a percent of sales were down 0.3% to 30.3%. This decrease is in addition 98 99 00 01 02 to the 1.0% decrease we achieved in 2001. While we have made Sales increases and comparable store sales are shown in the table progress in this area, we are still focused on reaching our goal of below. Comparable stores are stores open at least one full fiscal 28.5% to 29.0% of sales in the next few years. year at the beginning of the fiscal year. Our focus for 2003 is to increase top line growth through positive comparable store sales and store openings, improve gross margin Fiscal Year 2000 2001 2002 performance through better inventory control, and further reduce Net sales increase 7.4% 1.9% 6.1% our expenses as a percent of sales. Comparable store sales: Full-line stores 0.2% (2.6%) 0.7% Nordstrom Rack & other 1.2% (5.9%) 7.4% Total 0.3% (2.9%) 1.4% 12 NORDSTROM INC. AND SUBSIDIARIES
  • 15. management’s discussion and analysis In 2002, net sales increased 6.1% over the prior year. This growth we added new stores, however, inventory per square foot declined was primarily due to store openings. During 2002, we opened eight due to improved performance at full-line stores partially offset by full-line stores, four Nordstrom Rack stores and one Façonnable inventory increases at our Nordstrom Rack division. Total shrinkage boutique. We also closed one Nordstrom Rack location. The net as a percentage of sales was even with the previous year. impact was an increase to our retail square footage of 8%. Gross profit as a percentage of net sales declined in 2001 due Comparable store sales increased 1.4% due to increases at both to increased markdowns and new store occupancy expenses. full-line stores and Nordstrom Rack stores. Sales at Nordstrom The markdowns were taken to drive sales and to liquidate excess Direct (formerly known as Nordstrom.com) declined slightly with inventory caused by the decrease in comparable store sales. a planned reduction in catalog sales partially offset by an increase Inventory declines at comparable stores were partially offset by the in Internet sales. addition of new stores. The comparable stores inventory decrease Merchandise division sales were led by Women’s Designer, Cosmetics was due to a concerted effort to reduce inventory levels during the and Accessories. Men’s Apparel and Shoes experienced small sales year resulting in lower inventory per square foot. Total shrinkage as declines. The Women’s Designer division benefited from the a percentage of sales was even with the previous year. addition of new vendors, close scrutiny of developing trends and In 2003, we anticipate continuing progress in our ability to improve a targeted marketing plan. The increase in Cosmetics was primarily gross profit performance through better inventory management. due to the addition of product lines. Accessories improved by Selling, General and Administrative differentiating its product and offering attractive values. Fiscal Year 2000 2001 2002 In 2001, net sales increased 1.9% due to store openings. During Selling, general and administrative 2001, we opened four full-line stores, eight Nordstrom Rack stores 31.6% 30.6% 30.3% expense as a percent of net sales and three Façonnable boutiques. We also closed one Nordstrom Rack store and one full-line store. The net impact was an increase In 2002, we recognized a charge of $15.6 million to write-down to our retail square footage of 6%. New store sales were partially an investment in a supply chain tool intended to support our private offset by negative comparable store sales and a decline in sales label division. Due to changes in business strategy, we determined at Nordstrom Direct. The most significant sales declines were in that this asset was impaired. This charge reduced this asset to its Men’s Apparel and Shoes while Women’s Apparel was essentially flat. estimated market value. In 2003, we plan to open four full-line stores and two Nordstrom Excluding the effect of the write-down, selling, general and Rack stores, increasing retail square footage by approximately 4%. administrative expenses as a percentage of net sales decreased Because of the continued challenging retail environment, in 2002 to 30.1% from 30.6% in the prior year. This decrease comparable store sales are expected to be flat to slightly positive. is the result of improvements in bad debt and selling expense and reductions in sales promotion. These costs were partially offset Gross Profit by higher distribution costs and higher information systems expense. Fiscal Year 2000 2001 2002 Bad debt expense decreased as both delinquency and write-off 34.0% 33.2% 33.5% Gross profit as a percent of net sales trends stabilized. Selling expense decreased primarily due to continued efficiencies in shipping costs at Nordstrom Direct. Gross profit as a percentage of net sales improved in 2002 due Sales promotion decreased as Nordstrom Direct executed planned to better inventory management. In our merchandising divisions, reductions in catalog size and number of mailings consistent with improvement in gross profit rate offset lower sales in certain sales trends. Distribution costs increased primarily due to higher categories. Merchandise division gross profit was led by both merchandise volumes and temporary inefficiencies caused by the Women’s and Men’s Apparel. Additionally, costs related to our implementation of our perpetual inventory system. The information private label operations improved. Total inventory increased as NORDSTROM INC. AND SUBSIDIARIES 13
  • 16. management’s discussion and analysis systems expense increase resulted from depreciation and rollout Minority Interest Purchase and Reintegration Costs costs of our new perpetual inventory system. During 2002, we purchased the outstanding shares of Nordstrom.com, Inc. series C preferred stock for $70.0 million. In 2000, we recognized a charge of $13.0 million for certain The excess of the purchase price over the fair market value of the severance and other costs related to a change in management. preferred stock and professional fees resulted in a one-time charge Also in 2000, we recorded an impairment charge of $10.2 million. of $42.7 million. No tax benefit was recognized on the share Due to changes in business strategy, we determined that several purchase, as we do not believe it is probable that this benefit will software projects under development were either impaired be realized. The impact of not recognizing this income tax benefit or obsolete. increased our effective tax rate to 47% before the cumulative effect Excluding the effect of the severance and impairment charge, of accounting change. selling, general and administrative expenses as a percentage of net Also in 2002, $10.4 million of expense was recognized related sales decreased in 2001 to 30.6% versus 31.2% in the prior year. to the purchase of the outstanding Nordstrom.com options and This improvement in selling, general and administrative expenses warrants. as a percentage of net sales is due to reductions in sales promotion and improvements in selling expenses. Sales promotion expenses Service Charge Income and Other, Net (in millions) decreased due to the discontinuation of a company-wide brand advertising program. Selling expenses decreased as Nordstrom Direct $134 $131 $141 $117 $110 improved the efficiency of their shipping and call center activities. $150 These improvements were partially offset by an increase in bad debt • $140 on our credit cards due to increased delinquencies and write-offs. • • $130 In 2003, selling, general and administrative expenses as a percent $120 • of net sales are expected to improve slightly as we continue our • $110 focus on expense management. $100 $90 Interest Expense, Net 98 99 00 01 02 Interest expense, net increased 9.2% in 2002 primarily due to lower capitalized interest. Capitalized interest decreased due to Service charge income and other, net increased in 2002 primarily lower average balances during the year for construction and due to gains recorded from our VISA securitization. Securitization software in progress. gains increased this year as credit spreads improved, the cost of funds decreased and bad debt write-offs stabilized. This Interest expense, net increased 19.7% in 2001 due to higher increase was partially offset by a decline in service charge average borrowings, partially offset by a decrease in interest rates. and late fee income resulting from a decline in our private Interest expense, net for 2003 is expected to be flat with 2002. label accounts receivable. Write-down of Streamline.com, Inc. Service charge income declined slightly in 2001 due to lower interest rates, flat credit sales and a steady number of We held an investment in Streamline.com, Inc., an Internet grocery credit accounts. and consumer goods delivery company. Streamline ceased its operations effective November 2000. During 2000 we wrote off our In 2003, service charge income is expected to be higher due entire investment in Streamline, for a total expense of $32.9 million. to a small increase in credit sales and credit accounts, and adjustments to interest rates charged. 14 NORDSTROM INC. AND SUBSIDIARIES
  • 17. management’s discussion and analysis Diluted Earnings per Share LIQUIDITY AND CAPITAL RESOURCES We finance our working capital needs, capital expenditures, $1.46 $0.78 $0.93 $0.66 $1.41 acquisitions and share repurchase activity with a combination of cash flows from operations and borrowings. $1.60 • • We believe that our operating cash flows, existing cash and available $1.40 credit facilities are sufficient to finance our operations and planned $1.20 growth for the foreseeable future. $1.00 • $0.80 • Operating Activities • Our operations are seasonal in nature. The second quarter, which 98 99 00 01 02 includes our Anniversary Sale, accounts for approximately 28% Earnings per share decreased in 2002 due to the write down of net sales, while the fourth quarter, which includes the holiday of the supply chain tool, the minority interest purchase and season, accounts for about 29% of net sales. Cash requirements reintegration costs and the cumulative effect of accounting change. are highest in the third quarter as we build our inventory for the Excluding the impact of these charges, earnings per share would holiday season. have been $1.19, an increase from the prior year of 28.0%. This The decrease in net cash provided by operating activities between increase was primarily driven by an increase in comparable store 2002 and 2001 was primarily due to increases in inventories and sales, an improvement in gross profit percent and a decrease in accounts receivable partially offset by an increase in net earnings selling, general and administrative expenses as a percent of sales. before noncash items and an increase in our accrual for income Earnings per share for 2001 were 19.2% higher than 2000 due to taxes. Inventory grew as we added stores during the year. Accounts charges recognized in 2000, which include the write-down of receivable increased as Nordstrom VISA credit sales improved. The Streamline, the management severance and the asset impairments. increased income tax accrual resulted from the timing of payments. Excluding the impact of these charges, 2000 earnings per share Net cash provided by operating activities increased approximately would have been $1.04 resulting in a 2001 earnings per share $235 million in 2001 compared to 2000 primarily due to decreases decrease of 10.6%. This decrease is primarily due to a decline in in inventories and accounts receivable. The inventories decreased comparable store sales and a decline in gross profit percent offset by as a result of improved inventory management, while accounts decreases in selling, general and administrative expenses as a receivable declined due to lower credit sales. percent of sales. In 2003, cash flows provided by operating activities are expected Fourth Quarter Results to remain fairly consistent with 2002. Inventory increases from store openings are expected to slow, offset by slower increases in accounts Fourth quarter 2002 earnings per share were $0.44 compared payable. Accounts receivable should increase modestly as credit with $0.38 in 2001. Total sales for the quarter increased by 7.3% sales grow. versus the same quarter in the prior year and comparable store sales increased by 1.9%. The increase in sales was primarily due Investing Activities to the opening of eight full-line stores and four Nordstrom Rack For the last three years, investing activities have primarily consisted stores during the year. Gross profit as a percentage of sales was of capital expenditures, the minority interest purchase of flat with the same quarter in the prior year. Nordstrom.com and the acquisition of Façonnable. Selling, general and administrative expenses as a percent of sales decreased in the quarter compared to the prior year primarily due to improved selling costs and reduced sales promotion offset by higher distribution costs and information systems expense. NORDSTROM INC. AND SUBSIDIARIES 15
  • 18. management’s discussion and analysis Capital Expenditures five years from the acquisition date. If the former owner continues to have involvement in the business and performance targets are Our capital expenditures over the last three years totaled met, the contingent payment could approximate $12 million. approximately $738 million, net of developer reimbursements, The contingent payment will be expensed when it becomes principally to add stores, improve existing facilities and purchase probable that the targets will be met. or develop new information systems. More than 3.9 million square feet of retail store space has been added during this period, Financing Activities representing an increase of 27% since January 31, 2000. Financing activities primarily consist of share repurchases, We plan to spend approximately $700-$750 million, net of dividend payments, as well as proceeds and payments on debt. developer reimbursements, on capital projects during the next three Share Repurchase years. Compared to the previous three years, we plan to open fewer stores, slow spending on information systems and increase our In May 1995, the Board of Directors authorized $1.1 billion spending on the improvement of existing facilities. In the of share repurchases. As of January 31, 2003, we have purchased information systems area, we are in the process of replacing our 39 million shares of our common stock for $1 billion, with remaining point of sale system, which we expect to be substantially completed share repurchase authority of $82 million. The share repurchase by 2004. represents 24% of the shares outstanding as of May 1995 after adjusting for the 1998 stock split, at an average price per share At January 31, 2003, approximately $227 million has been of $25.93. contractually committed primarily for the construction of new stores or remodeling of existing stores. Although we have made Dividends commitments for stores opening in 2003 and beyond, it is possible In 2002, we paid $.38 per share in common stock dividends, that some stores may not be opened as scheduled because of delays the sixth consecutive annual dividend increase. We paid $.36 in the development process, or because of the termination of store and $.35 per share of common stock in fiscal 2001 and 2000. site negotiations. Debt to Capital Ratio Total Square Footage (in thousands) By the end of 2001, our debt to capital ratio had increased to 52.1% as a result of retail expansion, share repurchases and 16, 056 13,593 14,487 18,428 17,048 an acquisition. By the end of 2002, this ratio had decreased to 49.6%. Our near-term goal is to reduce this ratio to be in the 20,000 • range of 40% to 45%. 18,000 • • 16,000 Debt • 14,000 • In May 2002, we replaced the $200 million variable funding note 12,000 backed by Nordstrom VISA credit card receivables with 5-year term 10,000 notes also backed by the VISA credit card receivables. Class A and 8,000 B notes with a combined face value of $200 million were issued 98 99 00 01 02 to third party investors. We used the proceeds to retire the $200 million outstanding on the variable funding note. Based on SFAS Acquisition No. 140 “Accounting for Transfers and Servicing of Financial Assets In 2000, we acquired Façonnable, S.A.S. in exchange for $88 and Extinguishments of Liabilities” this debt and the related assets million of cash and 5,074,000 shares of our common stock, for are not reflected in our consolidated balance sheets. a total consideration of $169 million. The purchase provides for a contingent payment to a former owner that may be paid after 16 NORDSTROM INC. AND SUBSIDIARIES
  • 19. management’s discussion and analysis In November 2001, we issued $300 million of Class A notes Available Credit backed by Nordstrom private label receivables. These notes bear In November 2001, we entered into a $300 million unsecured a fixed interest rate of 4.82% and have a maturity of five years. revolving credit facility that expires in November 2004. As of Both the debt and related assets are included in our consolidated January 31, 2003, no borrowings have been made against this balance sheets. A portion of the proceeds was used to pay-down revolving credit facility. approximately $77 million in medium-term notes and the purchase Also in November 2001, we issued a variable funding note backed of Nordstrom.com, Inc.’s preferred stock for $70 million. The by Nordstrom private label receivables with a $200 million capacity. remaining proceeds will be used for general corporate purposes As of January 31, 2003, no borrowings were outstanding against and capital expansion. this note. In October 2000, we issued $300 million of 8.95% senior Additionally, we have universal shelf registrations on file with notes due in 2005. These proceeds were used to reduce short-term the Securities and Exchange Commission that permit us to offer indebtedness, to fund the acquisition of Façonnable, and for general an additional $450 million of securities to the public. These corporate purposes. registration statements allow us to issue various types of securities, including debt, common stock, warrants to purchase common stock, Interest Rate Swaps warrants to purchase debt securities and warrants to purchase or We entered into a variable interest rate swap agreement in the sell foreign currency. fourth quarter of 2002. The swap had a $250 million notional amount and a six-year term. Under the agreement, we received Contractual Obligations a fixed rate of 5.63% and paid a variable rate based on LIBOR plus The following table summarizes our contractual obligations and a margin of 1.31% set at six-month intervals (3.25% at January 31, the expected effect on liquidity and cash flows. 2003). The swap agreement qualified as a fair value hedge and Less than 1-3 4-5 Over 5 was recorded at fair value in other assets at January 31, 2003. Fiscal Year Total 1 Year Years Years Years Subsequent to January 31, 2003, we sold the interest rate swap Long-term Debt $1,338.4 $5.2 $407.9 $307.1 $618.2 and received cash of $2.3 million, which will be recognized as Capital Leases 16.0 1.1 2.2 2.2 10.5 interest income evenly over the remaining life of the related debt. Operating Leases 780.4 73.2 141.3 123.9 442.0 In the third quarter of 2002, we sold the interest rate swap that Construction converted our $300 million, 8.95% fixed-rate debt to variable rate. Commitments 227.3 165.2 62.1 — — We received cash of $4.9 million, which will be recognized as Total $2,362.1 $244.7 $613.5 $433.2 $1,070.7 interest income evenly over the remaining life of the related debt. Noncash Financing We own 49% of a limited partnership which constructed a new corporate office building in which we are the primary occupant. During the first quarter of 2002, the limited partnership refinanced its construction loan obligation with an $85 million mortgage secured by the property, of which $79 million was included in our balance sheet at January 31, 2003. The obligation has a fixed interest rate of 7.68% and a term of 18 years. NORDSTROM INC. AND SUBSIDIARIES 17
  • 20. management’s discussion and analysis Debt Ratings approximates the lower of cost or market. Factors considered in determining markdowns include current and anticipated demand, The following table shows our credit ratings at the date of this report. customer preferences, age of the merchandise and fashion trends. Standard We also reserve for obsolescence based on historical trends and Credit Ratings Moody’s* and Poor’s* specific identification. Shrinkage is estimated as a percentage of Senior unsecured debt Baa1 A- sales for the period from the last inventory date, based on historical Commercial paper P-2 A-2 shrinkage losses. * negative outlook Vendor Allowances These ratings could change depending on our performance and other We receive allowances from merchandise vendors for purchase price factors. A significant ratings drop could result in the termination adjustments, cooperative advertising programs and cosmetic selling of the $200 million Nordstrom private label receivables variable expenses. Purchase price adjustments are recorded as a reduction funding note and a change in interest rates on the $300 million of cost of sales at the point they have been earned and the related 8.95% senior notes and the $300 million revolving credit facility. merchandise has been sold. Allowances for cooperative advertising The remainder of our outstanding debt is not subject to termination programs and cosmetic selling expenses are recorded as a reduction or interest rate adjustments based on changes in credit ratings. of selling, general and administrative expense when the advertising Critical Accounting Policies or selling expense is incurred. The preparation of our financial statements requires that we make Self Insurance estimates and judgments that affect the reported amounts of assets, We are self insured for certain losses related to health and welfare, liabilities, revenues and expenses, and disclosure of contingent workers’ compensation and general liability. We record estimates assets and liabilities. We regularly evaluate our estimates including of the total cost of claims incurred as of the balance sheet date. those related to doubtful accounts, inventory valuation, intangible These estimates are based on analysis of historical data and assets, income taxes, self-insurance liabilities, post-retirement actuarial estimates. benefits, contingent liabilities and litigation. We base our estimates on historical experience and on other assumptions that we believe Allowance for Doubtful Accounts to be reasonable under the circumstances. Actual results may differ We evaluate the collectibility of our customer accounts receivable from these estimates. The following discussion highlights the based on several factors, including historical trends, aging of policies we feel are critical. accounts, write-off experience and expectations of future performance. Delinquent accounts are usually written off after Revenue Recognition the passage of 151 days without receiving a full scheduled We recognize revenues net of estimated returns and exclude sales monthly payment. Accounts are written off sooner in the event tax. Retail stores record revenue at the point of sale. Catalog of customer bankruptcy or other circumstances that make further and Internet sales include shipping revenue and are recorded upon collection unlikely. delivery to the customer. Our sales return liability is estimated based on historical return levels. Off-balance Sheet Financing We have $200 million in outstanding term notes backed by our Inventory Nordstrom VISA credit card receivables. On an ongoing basis, Our inventory is stated at the lower of cost or market using the retail our Nordstrom VISA receivables are transferred to a master note inventory method (first-in, first-out basis). Under the retail method, trust which has issued Class A and B notes to third party investors. inventory is valued by applying a cost-to-retail ratio to the ending We hold securities that represent our retained interests in the trust. retail value of inventory. As our inventory retail value is adjusted regularly to reflect market conditions, our inventory method 18 NORDSTROM INC. AND SUBSIDIARIES
  • 21. management’s discussion and analysis We recognize gains or losses on the sale of Nordstrom VISA SFAS No. 144 “Accounting for the Impairment or Disposal of receivables to the trust based on the difference between the face Long-Lived Assets” - SFAS No. 144 retains the fundamental value of the receivables sold and the fair value of the assets created provisions of SFAS No. 121, but establishes new criteria for asset during the securitization process. The fair value of the assets classification and broadens the scope of qualifying discontinued is calculated as the present value of their expected cash flows. operations. The adoption of this statement did not have a material The discount rates used to calculate present value represent the impact on our financial statements. volatility and risk of the assets. Significant assumptions and We adopted SFAS No. 145 “Rescission of FASB Statements No. 4, judgments are made to estimate the present value of expected 44, and 64, Amendment of FASB Statement No. 13, and Technical cash flows and to determine the fair value of our retained interest. Corrections” in the second quarter of 2002. SFAS No. 145 updates, We have no other off-balance sheet transactions. clarifies and simplifies existing accounting pronouncements related to extinguishments of debt, provisions of the Motor Carrier Act of Realization of Deferred Tax Assets 1980 and lease transactions. The adoption of this statement did In January 2003, we sold our Denver Credit facility generating not have a material impact on our financial statements. a capital gain for tax purposes of $15.4 million, which was used to SFAS No. 146 “Accounting for Costs Associated with Exit or Disposal offset a portion of our existing capital loss carryforwards. Capital Activities” was also adopted by us in the second quarter of 2002. loss carryforwards of $19.0 million remain available to offset capital SFAS No. 146 nullifies EITF 94-3 “Liability Recognition for Certain gain income in the next three years. No valuation allowance reserve Employee Termination Benefits and Other Costs to Exit an Activity has been provided because we believe it is probable that the full (including Certain Costs Incurred in a Restructuring)” by requiring benefit of these carryforwards will be realized. that a liability for a cost associated with an exit or disposal activity Our purchase of the outstanding shares of Nordstrom.com, Inc. be recognized when the liability is incurred versus when an entity is series C preferred stock resulted in an expense of $40.4 million committed to an exit plan. The adoption of this statement did not which we believe will not be deductible for tax purposes. As a result, have a material impact on our financial statements. we have established a valuation allowance reserve of $16.5 million We adopted SFAS No. 148 “Accounting for Stock-Based to offset the deferred tax asset related to this purchase. Compensation” in the fourth quarter of 2002. SFAS No. 148 Recent Accounting Pronouncements amends SFAS No. 123 of the same name and provides alternative SFAS No. 141 “Business Combinations” - SFAS No. 141 requires transition methods for a voluntary change to fair value based that the purchase method of accounting be used for all business accounting for stock-based employee compensation. SFAS No. 148 combinations initiated after June 30, 2001, and establishes specific also requires more prominent and frequent disclosures about the criteria for the recognition of goodwill separate from other intangible effects of stock-based compensation. Adoption of SFAS No. 148 assets. Adoption of SFAS No. 141 did not have a material impact did not have a material impact on our financial statements. on our financial statements. In November 2002, the Emerging Issues Task Force reached a SFAS No. 142 “Goodwill and Other Intangible Assets” - Under SFAS consensus on certain issues discussed in EITF 02-16, “Accounting No. 142, goodwill and intangible assets having indefinite by a Reseller for Cash Consideration Received from a Vendor.” lives will no longer be amortized but will be subject to annual This pronouncement addresses the timing and classification of cash impairment tests. Other intangible assets will continue to be payments received by a reseller from a vendor. Adoption of EITF 02- amortized over their estimated useful lives. Adoption of SFAS 16 did not have a material impact on our financial statements. No. 142 resulted in an impairment charge and a reduction in In November 2002, the FASB issued FIN 45, “Guarantor’s amortization expense, which is detailed in Note 2 of the Notes Accounting and Disclosure Requirements for Guarantees, Including to Consolidated Financial Statements. NORDSTROM INC. AND SUBSIDIARIES 19
  • 22. management’s discussion and analysis Indirect Guarantees of the Indebtedness of Others.” FIN 45 and challenges posed by increased competition, shifting consumer elaborates on the disclosures made by a guarantor and also clarifies demand, changing consumer credit markets, changing capital that a guarantor is required to recognize, at the inception of a markets, changing interest rates and general economic conditions, guarantee, a liability for the fair value of the obligation undertaken hiring and retaining effective team members, sourcing merchandise in issuing the guarantee. Adoption of FIN 45 in the fourth quarter from domestic and international vendors, investing in new business of 2002 did not have a material impact on our financial statements. strategies, achieving our growth objectives and the impact of economic and competitive market forces, including the impact Cautionary Statement of terrorist activity or the impact of war. As a result, while we The preceding disclosures included forward-looking statements believe there is a reasonable basis for the forward-looking regarding our performance, liquidity and adequacy of capital statements, you should not place undue reliance on those resources. These statements are based on our current assumptions statements. This discussion and analysis should be read and expectations and are subject to certain risks and uncertainties in conjunction with the consolidated financial statements that could cause actual results to differ materially from those and the Eleven-Year Statistical Summary. projected. Forward-looking statements are qualified by the risks 20 NORDSTROM INC. AND SUBSIDIARIES
  • 23. independent auditors’ and management reports Independent Auditors’ Report Management Report We have audited the accompanying consolidated balance sheets We are responsible for preparing our financial statements and the of Nordstrom, Inc. and subsidiaries (the “Company”) as of January other information that appears in the annual report. The financial 31, 2003 and 2002, and the related consolidated statements of statements have been prepared in accordance with accounting earnings, shareholders’ equity and cash flows for each of the three principles generally accepted in the United States of America years in the period ended January 31, 2003. These financial and include estimates based on our best judgment. statements are the responsibility of the Company’s management. We maintain a comprehensive system of internal controls and Our responsibility is to express an opinion on these financial procedures designed to provide reasonable assurance that assets statements based on our audits. are safeguarded and transactions are executed in accordance with We conducted our audits in accordance with auditing standards established procedures. The concept of reasonable assurance generally accepted in the United States of America. Those standards is based on the recognition that the cost of maintaining the system require that we plan and perform the audit to obtain reasonable of internal accounting controls should not exceed the benefit assurance about whether the financial statements are free of derived from the system. material misstatement. An audit includes examining, on a test Deloitte and Touche LLP audits our financial statements in basis, evidence supporting the amounts and disclosures in the accordance with auditing standards generally accepted in the financial statements. An audit also includes assessing the United States of America and provides an objective, independent accounting principles used and significant estimates made by review of our internal controls and the fairness of our reported management, as well as evaluating the overall financial statement financial condition and results of operations. presentation. We believe that our audits provide a reasonable The Audit Committee, which is comprised of six independent basis for our opinion. directors, meets periodically with our management and the In our opinion, the accompanying consolidated financial statements independent auditors to ensure that each is properly fulfilling present fairly, in all material respects, the financial position of its responsibilities. The Committee oversees our systems of Nordstrom, Inc. and subsidiaries as of January 31, 2003 and 2002, internal control, accounting practices, financial reporting and and the results of their operations and their cash flows for each of audits to ensure their quality, integrity and objectivity are the three years in the period ended January 31, 2003, in conformity sufficient to protect shareholders’ investments. with accounting principles generally accepted in the United States of America. The Company changed its method of accounting for goodwill and other intangible assets upon adoption of Statement of Financial Accounting Standards No. 142, Goodwill and Other Intangible Michael G. Koppel Assets, for the year ended January 31, 2003, as discussed in Executive Vice President and Chief Financial Officer Note 2 to the consolidated financial statements. Deloitte & Touche LLP Seattle, Washington March 28, 2003 NORDSTROM INC. AND SUBSIDIARIES 21
  • 24. consolidated statements of earnings Dollars in thousands except per share amounts % of % of % of Year ended January 31, 2003 sales 2002 sales 2001 sales Net sales $5,975,076 100.0 $5,634,130 100.0 $5,528,537 100.0 Cost of sales and related buying and occupancy (3,971,372) (66.5) (3,765,859) (66.8) (3,649,516) (66.0) Gross profit 2,003,704 33.5 1,868,271 33.2 1,879,021 34.0 Selling, general and administrative (1,813,968) (30.3) (1,722,635) (30.6) (1,747,048) (31.6) Operating income 189,736 3.2 145,636 2.6 131,973 2.4 Interest expense, net (81,9 21) (1.4) (75,038) (1.4) (62,698) (1.1) Write-down of investment — — — — (32,857) (0.6) Minority interest purchase and reintegration costs (53,168) (0.9) — — — — Service charge income and other, net 140,977 2.4 133,890 2.4 130,600 2.3 Earnings before income taxes and cumulative effect of accounting change 195,624 3.3 204,488 3.6 167,018 3.0 Income taxes (92,0 41 ) (1.6) (79,800) (1.4) (65,100) (1.2) Earnings before cumulative effect of accounting change 103,583 1.7 124,688 2.2 101,918 1.8 Cumulative effect of accounting change (net of tax) (13,359) (0.2) — — — — Net earnings $90,224 1.5 $124,688 2.2 $101,918 1.8 Basic earnings per share $0.67 $0.93 $0.78 Diluted earnings per share $0.66 $0.93 $0.78 Cash dividends paid per share $0.38 $0.36 $0.35 The accompanying Notes to Consolidated Financial Statements are an integral part of these statements. 22 NORDSTROM INC. AND SUBSIDIARIES
  • 25. consolidated balance sheets Dollars in thousands January 31, 2003 2002 Assets Current assets: Cash and cash equivalents $208,329 $331,327 Accounts receivable, net 759,262 698,475 Merchandise inventories 953,112 888,172 Prepaid expenses 40,261 36,888 Other current assets 111,654 102,249 Total current assets 2,072,618 2,057,111 Land, buildings and equipment, net 1,761,544 1,761,082 Goodwill, net 40,355 38,198 Tradename, net 100,133 100,133 Other assets 121,726 94,655 Total assets $4,096,376 $4,051,179 Liabilities and Shareholders’ Equity Current liabilities: Notes payable $244 $148 Accounts payable 414,754 490,988 Accrued salaries, wages and related benefits 260,562 236,373 Income taxes and other accruals 188,986 144,402 Current portion of long-term debt 5,545 78,227 Total current liabilities 870,091 950,138 Long-term debt 1,341,826 1,351,044 Deferred lease credits 383,100 342,046 Other liabilities 129,302 93,463 Shareholders’ equity: Common stock, no par: 500,000,000 shares authorized; 135,444,041 and 134,468,608 shares issued and outstanding 358,069 341,316 Unearned stock compensation (2,010) (2,680) Retained earnings 1,014,105 975,203 Accumulated other comprehensive earnings 1,893 649 Total shareholders’ equity 1,372,057 1,314,488 Total liabilities and shareholders’ equity $4,096,376 $4,051,179 The accompanying Notes to Consolidated Financial Statements are an integral part of these statements. NORDSTROM INC. AND SUBSIDIARIES 23
  • 26. consolidated statements of shareholders’ equity Dollars in thousands except per share amounts Accum. Other Common Stock Unearned Stock Retained Comprehensive Shares Amount Compensation Earnings Earnings Total Balance at February 1, 2000 132,279,988 $247,559 $(8,593) $929,616 $17,032 $1,185,614 Net earnings — — — 101,918 — 101,918 Other comprehensive earnings: Unrealized loss on investment during period, net of tax — — — — (23,461) (23,461) Reclassification of realized loss, net of tax — — — — 6,429 6,429 Foreign currency translation adjustment — — — — 2,824 2,824 Comprehensive net earnings: — — — — — 87,710 Cash dividends paid ($.35 per share) — — — (45,935) — (45,935) Issuance of common stock for: Stock option plans 181,910 4,039 — — — 4,039 Employee stock purchase plan 165,842 2,211 — — — 2,211 Business acquisition 5,074,000 77,696 — — — 77,696 Stock compensation (14,075) (1,111) 4,853 — — 3,742 Purchase and retirement of common stock (3,889,908) — — (85,509) — (85,509) Balance at January 31, 2001 133,797,757 330,394 (3,740) 900,090 2,824 1,229,568 Net earnings — — — 124,688 — 124,688 Other comprehensive earnings: Foreign currency translation adjustment — — — — (2,175) (2,175) Comprehensive net earnings: — — — — — 122,513 Cash dividends paid ($.36 per share) — — — (48,265) — (48,265) Issuance of common stock for: Stock option plans 186,165 3,788 — — — 3,788 Employee stock purchase plan 541,677 6,754 — — — 6,754 Stock compensation 19,009 380 1,060 — — 1,440 Purchase and retirement of common stock (76,000) — — (1,310) — (1,310) Balance at January 31, 2002 134,468,608 341,316 (2,680) 975,203 649 1,314,488 Net earnings — — — 90,224 — 90,224 Other comprehensive earnings: Foreign currency translation adjustment — — — — 7,755 7,755 (1) SERP adjustment, net of tax — — — — (6,511) (6,511) (1) Comprehensive net earnings: — — — — — 91,468 Cash dividends paid ($.38 per share) — — — (51,322) — (51,322) Issuance of common stock for: Stock option plans 350,004 7,959 — — — 7,959 Employee stock purchase plan 596,351 8,062 — — — 8,062 Stock compensation 29,078 732 670 — — 1,402 Balance at January 31, 2003 135,444,041 $358,069 $(2,010) $1,014,105 $1,893 $1,372,057 (1) The ending balance of the foreign currency translation adjustment and SERP adjustment, net of tax was $8,404 and $(6,511) as of January 31, 2003. The accompanying Notes to Consolidated Financial Statements are an integral part of these statements. 24 NORDSTROM INC. AND SUBSIDIARIES