Download to read offline


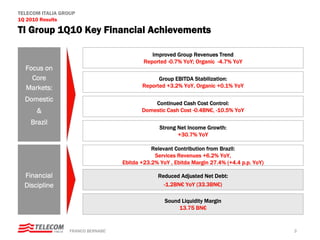
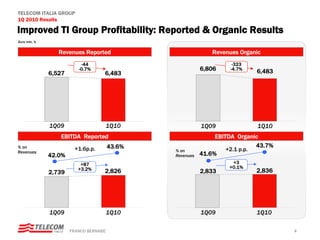
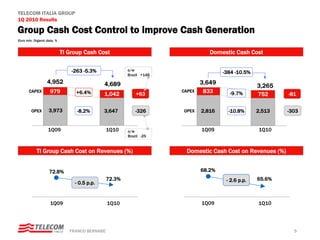

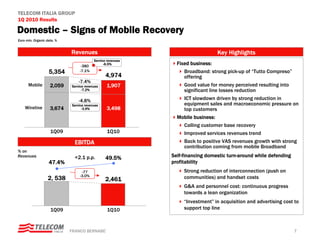
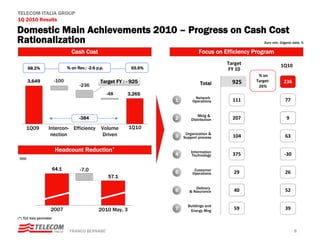

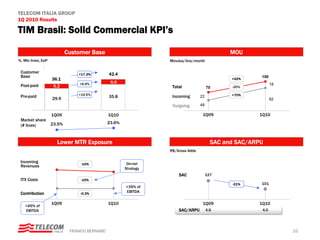
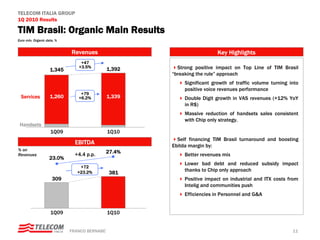


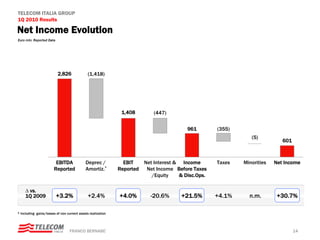

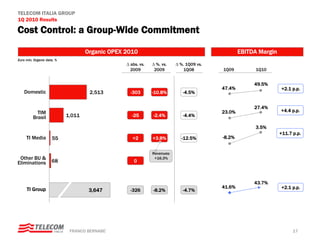
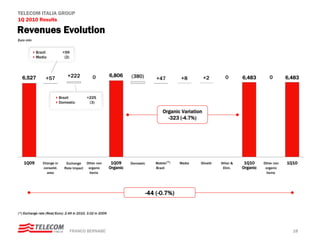
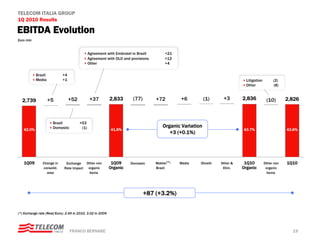
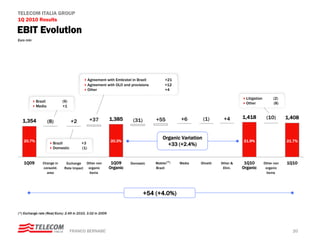
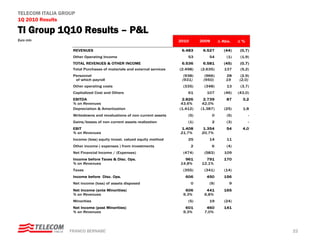
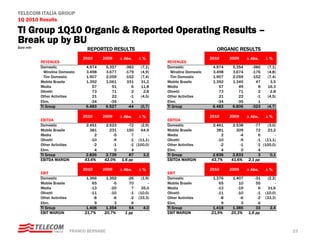

Telecom Italia reported its 1Q 2010 results. Key highlights include: - Group revenues declined 0.7% year-over-year reported but organic revenues declined 4.7% due to currency impacts. - Group EBITDA increased 3.2% reported and was stable year-over-year on an organic basis. - Cash costs were reduced through focus on the domestic and Brazilian markets, with domestic cash costs declining 10.5% year-over-year. - Net income grew 30.7% year-over-year due to cost controls and contributions from the Brazilian business.


