Download as PDF, PPTX


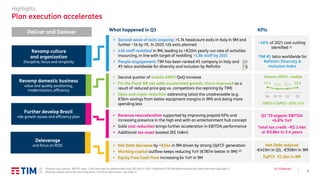
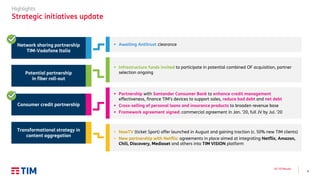
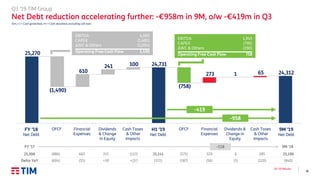
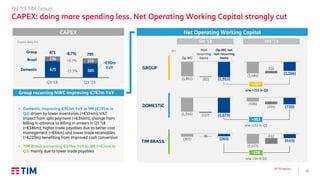
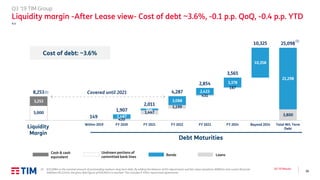
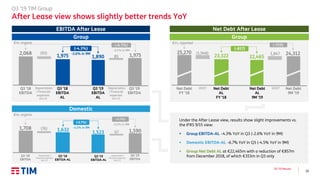
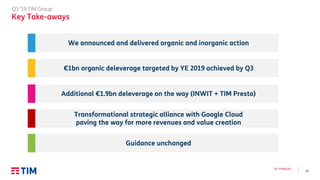
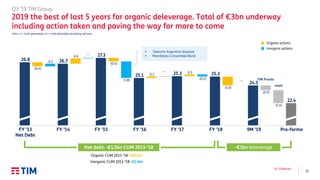

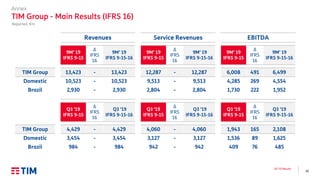
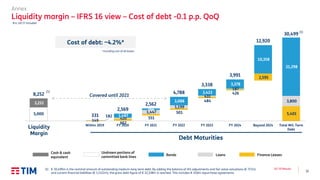

- TIM reported results for Q3 2019, highlighting accelerating execution of its plan to deleverage and enhance value. - Net debt was reduced by €419M in Q3 and €958M in the first nine months of 2019, driven by strong cash flow generation. Equity free cash flow increased six times year-over-year in the first nine months. - Strategic initiatives included potential partnerships for fiber roll-out and consumer credit, as well as an alliance with Google Cloud to transform TIM's infrastructure and become a leader in cloud, 5G, and edge computing in Italy.


