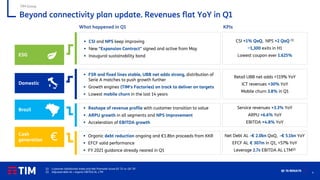
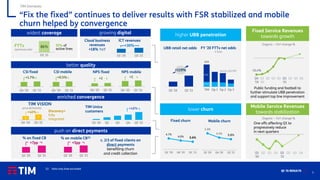
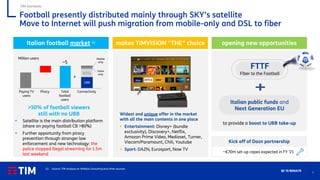
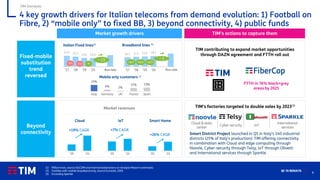
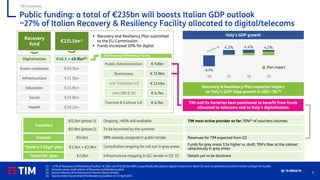
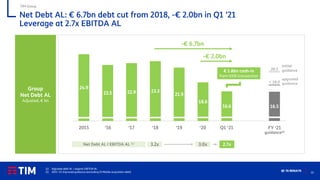
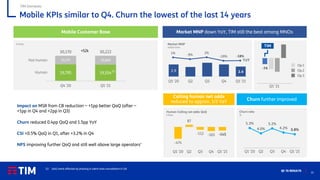
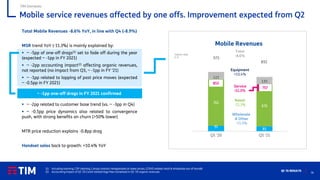
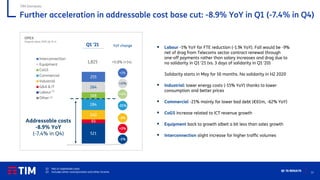
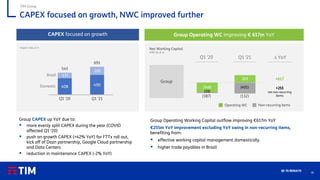
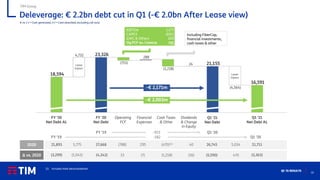
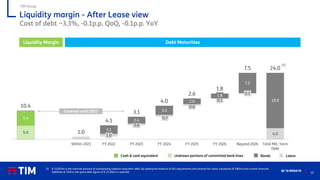
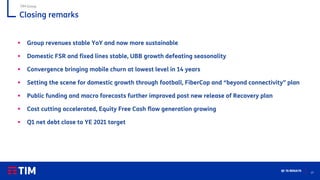
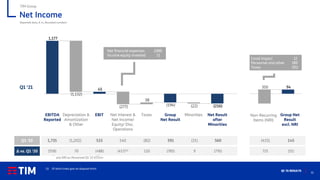
- TIM Group reported Q1 2021 results with revenues flat YoY and accelerating cash generation and debt reduction. Net debt was reduced by €2.0bn in Q1.
- For TIM Domestic, fixed service revenues stabilized YoY while mobile service revenues declined slightly. UBB coverage and take up continued to grow.
- Key growth drivers for TIM include the distribution of Italian football exclusively on fiber networks beginning in July 2021, capturing the shift from mobile-only to fixed broadband, leveraging opportunities in beyond connectivity areas, and benefitting from public funds being allocated to Italy's digitalization.
I risultati di TIM per il primo trimestre 2020, illustrati in webcast e conference call il 19 maggio 2020.
TIM 2020 First Quarter Results, presented on May 19, 2020, via webcast and conference call.
In this 68 page in-depth report we analyze the market demand share for global SVOD platforms, digital original series popularity and genre demand share trends in 10 global markets.
I risultati di TIM per il primo trimestre 2022, illustrati in webcast e conference call il 5 maggio 2022.
TIM 2022 First Quarter Results, presented on May 5, 2022, via webcast and conference call.
Financial Results for the Fiscal Year Ended March 2021KDDI
Statements made in these documents with respect to the KDDI Group‘s performance targets, projected subscriber numbers, future forecasts and strategies that are not historical facts are forward-looking statements about the future performance of the KDDI Group, based on company’s assumptions and beliefs in light of the information available at the time they were made. They therefore include certain risks and uncertainties. Actual results can differ from these statements due to reasons including, but not limited to, domestic and overseas situation, economic trends, competitive position, formulation, revision or abolition of laws and ordinances, regulations or systems, government actions or intervention and the success or lack thereof of new services.
Consequently, please understand that there is a possibility that actual performance, subscriber numbers, strategies and other information may differ significantly from the forecast information contained in these materials or other envisaged situations.
Il 9 novembre 2023 il management di TIM ha presentato in conference call i risultati del Q3 2023 approvati dal Consiglio di Amministrazione.
On November 9, 2023, TIM management has presented in conference call its Q3 2023 results approved by the Board of Directors.
TIM GROUP FY '23 Preliminary Results.pdfGruppo TIM
On February 15, 2024, TIM management has presented in conference call its FY 2023 preliminary results approved by the Board of Directors.
Il 15 febbraio 2024 il management di TIM ha presentato in conference call i risultati preliminari del FY 2023 approvati dal Consiglio di Amministrazione.
Collective Mining | Corporate Presentation - May 2024
Q1 '21 results
1. Q1 ‘21 RESULTS
TIM GROUP
A better Company in an improving
Country outlook
20 May 2021
2. 2
Q1 ’21 RESULTS
Disclaimer
This presentation contains statements that constitute forward looking statements regarding the intent, belief or current expectations of future growth in the different
business lines and the global business, financial results and other aspects of the activities and situation relating to the TIM Group. Such forward looking statements
are not guarantees of future performance and involve risks and uncertainties, and actual results may differ materially from those projected or implied in the forward
looking statements as a result of various factors.
The financial results of the TIM Group are prepared in accordance with International Financial Reporting Standards issued by the International Accounting Standards
Board and endorsed by the EU (designated as “IFRS”).
The accounting policies and consolidation principles adopted in the preparation of the financial results for Q1’21 of the TIM Group are the same as those adopted in
the TIM Group Annual Audited Consolidated Financial Statements as of 31 December 2020, to which reference can be made, except for the amendments to the
standards issued by IASB and adopted starting from January 1, 2021.
The financial results for Q1’21 of the TIM Group are unaudited.
Alternative Performance Measures
The TIM Group, in addition to the conventional financial performance measures established by IFRS, uses certain alternative performance measures for the purposes
of enabling a better understanding of the performance of operations and the financial position of the TIM Group. In particular, such alternative performance
measures include: EBITDA, EBIT, Organic change and impact of non-recurring items on revenue, EBITDA and EBIT; EBITDA margin and EBIT margin; net financial
debt (carrying and adjusted amount) and Equity Free Cash Flow. Moreover, following the adoption of IFRS 16, the TIM Group uses the following additional alternative
performance indicators:
* EBITDA adjusted After Lease ("EBITDA-AL"), calculated by adjusting the Organic EBITDA, net of non-recurring items, of the amounts related to the accounting
treatment of lease contracts according to IFRS 16;
* Adjusted Net Financial Debt After Lease, calculated by excluding from the adjusted net financial debt the net liabilities related to the accounting treatment of lease
contracts according to IFRS 16;
* Equity Free Cash Flow After Lease, calculated by excluding from the Equity Free Cash Flow the amounts related to lease payments.
Such alternative performance measures are unaudited.
4. 4
Q1 ’21 RESULTS
Beyond connectivity plan update. Revenues flat YoY in Q1
TIM Group
What happened in Q1 KPIs
▪ CSI and NPS keep improving
▪ New “Expansion Contract” signed and active from May
▪ Inaugural sustainability bond
ESG
CSI +1% QoQ, NPS +2 QoQ (1)
~1,300 exits in H1
Lowest coupon ever 1.625%
Domestic
▪ FSR and fixed lines stable, UBB net adds strong, distribution of
Serie A matches to push growth further
▪ Growth engines (TIM’s Factories) on track to deliver on targets
▪ Lowest mobile churn in the last 14 years
Retail UBB net adds +119% YoY
ICT revenues +30% YoY
Mobile churn 3.8% in Q1
Cash
generation
▪ Organic debt reduction ongoing and €1.8bn proceeds from KKR
▪ EFCF solid performance
▪ FY 2021 guidance already neared in Q1
Net Debt AL -€ 2.0bn QoQ, -€ 5.1bn YoY
EFCF AL € 307m in Q1, +57% YoY
Leverage 2.7x EBITDA AL LTM(2)
Brazil Service revenues +3.3% YoY
ARPU +6.6% YoY
EBITDA +4.8% YoY
▪ Reshape of revenue profile with customer transition to value
▪ ARPU growth in all segments and NPS improvement
▪ Acceleration of EBITDA growth
€
(1) Customer Satisfaction Index and Net Promoter Score Q1 ‘21 vs. Q4 ’20
(2) Adjusted debt AL / organic EBITDA AL LTM
5. 5
Q1 ’21 RESULTS
“Fix the fixed” continues to deliver results with FSR stabilized and mobile
churn helped by convergence
-10.4%
Q4
'19
Q1
'20
Q2 Q3 Q4 Q1
'21
Q2 Q3 Q4
Organic – YoY change %
Fixed Service Revenues
towards growth
FY '20 FTTx net adds
k lines
higher UBB penetration
UBB retail net adds
659
TIM Op 1 Op 2 Op 3
Source: AGCOM
FTTC
FTTH
Q1 '20 Q1 '21
+119%
Fixed churn
lower churn
4.7%
4.0% 3.6%
Q1 '20 Q4 '20 Q1 '21
5.3%
4.2% 3.8%
Q1 '20 Q4 '20 Q1 '21
Mobile churn
widest coverage
push on direct payments
86%
Q1 '21
92% of
active lines
FTTx
technical units
Q1 '20 Q2 Q3 Q4 Q1 '21
TIM Unica
customers
+48%
enriched convergence
Q1 Bad Debt -62% YoY
Direct payment churn -36% lower
better quality
Q4 '20 Q1 '21
CSI fixed CSI mobile
Q4 '20 Q1 '21
NPS fixed
+1.7% +0.5%
Discovery+
fully
integrated
5 7
Q4 '20 Q1 '21
TIM VISION
price (€/month)
+40%
Q4 '20 Q1 '21
+2
Q4 '20 Q1 '21
NPS mobile
+2
Public funding and football to
further stimulate UBB penetration
and support top line improvement
Q1
'20
Q2 Q3 Q4 Q1
'21
Q2 Q3 Q4
Organic – YoY change %
Mobile Service Revenues
towards stabilization
One offs affecting Q1 to
progressively reduce
in next quarters
Q1 '20 Q1 '21
c. 2/3 of fixed clients on
direct payments
benefiting churn
and credit collection
Cloud business
revenues
+18% YoY
Q1 '20 Q1 '21
growing digital
ICT revenues
Q1 '20 Q1 '21
+5pp
+7pp
% on fixed CB % on mobile CB(1)
(1) Data only lines excluded
TIM Domestic
+30%
6. 6
Q1 ’21 RESULTS
SKY
TIM Domestic
Italian football goes on fiber. TIM becoming “THE” telco distributor
Internet
as core platform
Satellite
as core platform
Telco distributors
7/10 exclusive matches
(all platforms)
3/10 matches
(all platforms)
TIM chosen by DAZN as strategic partner /distributor
Benefits for TIM: 1) New revenue stream, 2) Stronger UBB demand, 3) Additional push on convergence (TIM Unica)
SKY main exclusive rights owner DAZN main exclusive rights owner
Until June 2021
10/10 matches in one subscription
and one platform, o/w:
3/10 non-exclusive
matches
(all platforms)
From July 2021
+3/10 DAZN matches through the
satellite SKY - DAZN1 channel
SKY
TIM football
offer kick off
Vodafone Fastweb Eolo
7/10 exclusive (all platforms)
3/10 non-exclusive (Internet)
7. 7
Q1 ’21 RESULTS
TIM Domestic
Football presently distributed mainly through SKY’s satellite
Move to Internet will push migration from mobile-only and DSL to fiber
Italian football market (1) makes TIMVISION “THE” choice
Widest and unique offer in the market
with all the main contents in one place
▪ Entertainment: Disney+ (bundle
exclusivity), Discovery+, Netflix,
Amazon Prime Video, Mediaset, Turner,
Viacom/Paramount, Chili, Youtube
▪ Sport: DAZN, Eurosport, Now TV
opening new opportunities
Million users
>50% of football viewers
still with no UBB
to provide a boost to UBB take-up
FTTF
Fiber to the Football
Italian public funds and
Next Generation EU
Paying TV
users
Piracy Total
football
users
ADSL
UBB
Connectivity
Mobile
only
Voice
only
~5
(1) Source: TIM analysis on ItMedia Consulting and other sources
▪ Satellite is the main distribution platform
(share on paying football CB >80%)
▪ Further opportunity from piracy
prevention through stronger law
enforcement and new technology: the
police stopped illegal streaming for 1.5m
last weekend
~€70m set-up capex expected in FY ’21
Kick off of Dazn partnership
8. 8
Q1 ’21 RESULTS
4 key growth drivers for Italian telecoms from demand evolution: 1) Football on
Fibre, 2) “mobile only” to fixed BB, 3) beyond connectivity, 4) public funds
TIM Domestic
TIM’s actions to capture them
Market growth drivers
Fixed-mobile
substitution
trend
reversed Mobile only customers (2)
13%
12%
2%
6%
23%
Spain
France
UK
Germany
Italy
Beyond
connectivity
'19 '24
+19% CAGR
'20 '24 '20 '23
Cloud IoT Smart Home
+26% CAGR
+7% CAGR
16.5 17.2 17.6 18.1
'17 '18 '19 '20
Broadband lines (1)
~ 3
+0.7 +0.4 +0.5
Run rate
20.6 20.2 19.6 19.6
'17 '18 '19 '20 '23e
Italian Fixed lines(1)
~ 2.5
-0.6 =
-0.4
(1) Million lines, source AGCOM and internal elaborations on Analysis Mason’s estimates
(2) Families with mobile broadband only, source Eurostat, 2019
(3) Excluding Sparkle
Run rate
TIM contributing to expand market opportunities
through DAZN agreement and FTTH roll out
Market revenues TIM’s factories targeted to double sales by 2023(3)
Smart District Project launched in Q1 in Italy’s 140 industrial
districts (25% of Italy’s production): TIM offering connectivity
in combination with Cloud and edge computing through
Noovle, Cyber-security through Telsy, IoT through Olivetti
and International services through Sparkle
FTTH in 76% black+grey
areas by 2025
Cloud & data
center
Cyber security IoT
International
services
9. 9
Q1 ’21 RESULTS
Public funding: a total of €235bn will boosts Italian GDP outlook
~27% of Italian Recovery & Resiliency Facility allocated to digital/telecoms
TIM Domestic
(1) ~27% of Recovery and Resiliency Facility (~€ 52bn out of €191.5bn RRF) is specifically allocated to digital investments. React EU and Complementary fund to further enlarge the bucket
(2) Increase versus draft edition of Recovery and Resiliency plan
(3) Source: Ministry of Economy and Finance, Banca d’Italia
(4) Source: Italian Government Parliamentary audition on 13 April 2021
TIM and its factories best positioned to benefit from funds
allocated to telecoms and to Italy’s digitalization
"Italia a 1 Giga" plan
Schools
Vouchers
€1.1bn → €3.9bn Consultation ongoing for roll out in grey areas
€0.4bn 68% already assigned in public tender
€0.2bn (phase 1)
€0.9bn (phase 2)
Ongoing, >60% still available
To be launched by the summer
Recovery
fund
Recovery & Resiliency Plan expected impact
on Italy’s GDP 16pp growth in 2021-’26 (3)
-8.9%
4.2% 4.4% 4.2%
'20 '21 '22 '23
Plan impact
€235.1bn(1)
▪ Recovery and Resiliency Plan submitted
to the EU Commission.
▪ Funds increased 10% for digital
Digitalization
Green revolution
Infrastructure
Education
Social
Health
€46.3 → 49.9bn(2)
€69.9bn
€31.5bn
€33.8bn
€29.8bn
€20.2bn
€ 13.4bn
o/w Transition 4.0
€ 6.7bn
o/w UBB & 5G
€ 6.7bn
Tourism & Culture 4.0
Public Administration € 9.8bn
Businesses € 23.9bn
Italy’s GDP growth
"Italia 5G" plan €2.0bn Infrastructure mapping in Q2, tender in Q1 ’22
o/w Recovery & Resiliency Facility
Funds for grey areas 3.5x higher vs. draft. TIM's fiber at the cabinet
ubiquitously in grey areas
TIM most active provider so far: 76%(4) of vouchers volumes
Details yet to be disclosed
Revenues for TIM expected from Q3
10. 10
Q1 ’21 RESULTS
24.9
22.5 22.9 23.3
21.9
18.6
16.6 16.5
20.5
Group
Net Debt AL
Adjusted, € bn
TIM Group
Net Debt AL: € 6.7bn debt cut from 2018, -€ 2.0bn in Q1 ’21
Leverage at 2.7x EBITDA AL
2015 ‘16 ‘17 ‘18 ‘19 ‘20 FY ‘21
guidance(2)
Q1 ‘21
-€ 6.7bn
initial
guidance
< 18.0
upgraded
guidance
3.0x
3.2x
Net Debt AL / EBITDA AL (1)
2.7x
€ 1.8bn cash-in
from KKR transaction
-€ 2.0bn
(1) Adjusted debt AL / organic EBITDA AL
(2) 2021-’23 improved guidance (excluding OI Mobile acquisition debt)
12. 12
Q1 ’21 RESULTS
Cash generation and debt reduction accelerate. Revenues stable YoY
(1) Excluding exchange rate fluctuations, non-recurring items and change in consolidation area
(2) Adjusted Net Debt
(3) Drag reverts from H2
Organic data (1), IFRS 16, € m
TIM Group
Q1 revenues trend improved +2.1pp QoQ (+2.4pp Domestic)
Domestic EBITDA AL +0.8% YoY like for like:
▪ No solidarity in Q1 ‘21 (vs. 3 days in Q1 ‘20) implies 1.6pp YoY drag (3)
▪ Telecoms sector contract renewal through one-off payments rather
than salary increases implies 1.8pp YoY drag
Equity free cash flow AL € 307m (+57% YoY)
Net Debt AL reduced € 2.0bn QoQ vs. -€ 182m in Q1 ’20
(-€ 5.1bn YoY vs. -€ 1.4bn in Q1 ’20)
Net debt
after lease (2)
21,711
18,594
16,591
Q1 '20
FY '20
Q1 '21
-5,120
-23.6% YoY
-2,003
Equity
free cash flow
after lease 195
307
Q1 ‘21
Q1 ‘20
+57.4%
Service
revenues
11,643
14,441
FY '20
FY ‘20
Domestic
Brazil
2,753
3,387
Q1 '21
Q1 ‘21
D% YoY
-5.6%
+0.4%
-7.0%
D% YoY
-2.5%
+3.3%
-3.9%
Total revenues Q1 flat YoY Group, -0.6% YoY Domestic
EBITDA
after lease
1,151
1,383
Domestic
Brazil
Margin 36.9%
-1.7%
-2.6%
+3.9%
Q1 ‘21
D% YoY +0.8%
net of
solidarity
and one-
off
payments
drag
13. 13
Q1 ’21 RESULTS
TIM Domestic
UBB coverage and take up
continuous growth
81% 81% 82%
85% 86%
37% 40% 41% 42% 43%
Q1 '20 Q2 Q3 Q4 Q1 '21
UBB POP
coverage
UBB
take up
retail &
wholesale
UBB coverage and take up (1)
(2)
Retail net adds stable QoQ
Line losses
k lines
-185
-59
-159
6
-16
Q1 '20 Q2 Q3 Q4 Q1 '21
Retail UBB net adds peaking despite
seasonality
4,220 4,381
4,432 4,695
8,652 9,076
Q4 '20 Q1 '21
Wholesale Retail
+23% YoY
+161
+263
+120 in Q1 ’20
UBB Customer Base
k lines
Churn improved thanks to
convergence and direct payments
Churn rate
%
(170) (158)
158 160
Q4 '20 Q1 '21
UBB
ULL
Wholesale trend improved QoQ
VULA continues offsetting ULL losses
Net adds FY
k lines
Retail fixed lines stable
Retail ultrabroadband net adds more than
double YoY
Structural improvement thanks to “Fix the
Fixed” plan plus help from vouchers (>60% of
first €200m tranche still available)
CSI +1.7% QoQ in Q1, NPS +2.0 QoQ
Churn benefitting from convergence and
increased direct payments (+6.9pp YoY)
Fixed KPIs remain strong despite seasonality
(1) UBB take up calculated on technical HHs covered by UBB
(2) Equivalent to 92% of families with a fixed line
+119% YoY
4.7%
3.0%
4.0% 4.0%
3.6%
Q1 '20 Q2 Q3 Q4 Q1 '21
14. 14
Q1 ’21 RESULTS
Fixed revenues back to YoY growth. FSR stabilized
TIM Domestic
Fixed Revenues
Organic data
€ m
214 217
498 541
1,420 1,352
135 214
Q1 '20 Q1 '21
2,285
Intern. Wholesale
+1.4%
2,138
National Wholesale
+8.7%
Retail
-4.8%
Service
-0.5%
Total +3.0%
2,149
2,352
Equipment
+58.5%
Total Fixed Revenues +3.0% YoY in Q1 (vs. -0.3% in Q4)
Fixed Service Revenues -0.5% YoY (vs. -0.2% in Q4: 0.3pp
delta explained by lower weight of ICT in Q1 vs. Q4)
▪ National Wholesale +8.7%: better mix in revenues (VULA
vs ULL)
▪ International Wholesale +1.4%: improved voice & data
service volumes
▪ Retail YoY trend -4.8% YoY helped by:
– customer base stabilization(1) -0.5pp YoY vs -5.6pp in Q4
– ICT revenues growing +30% YoY
Convergence grew with
larger adoption of TIM Unica
Direct payments increased,
with benefits on churn
converged customer base
% on BB customer base
Direct payments
% on consumer fixed customer base
Q1 '20 Q1 '21
+8.6pp
Q1 '20 Q1 '21
+7pp
ARPU is set to improve YoY performance in H2
even before considering help from football
Equipment resumed strong growth (+58.5% in Q1 vs. -1.4% in
Q4) benefiting from ICT growth, higher UBB net adds and
vouchers
(1) Including Enterprise
15. 15
Q1 ’21 RESULTS
-74
Mobile KPIs similar to Q4. Churn the lowest of the last 14 years
TIM Domestic
k lines
Churn further improved
Calling human net adds
reduced to approx. 1/3 YoY
Human Calling net adds QoQ
k lines
Market MNP down YoY, TIM still the best among MNOs
Market MNP
million lines
2.9 2.4
Q1 '20 Q2 Q3 Q4 Q1 '21
Op.1
Op.2
Op.3
TIM
Q1 ‘21
-474
87
-112 -165 -145
Q1 '20 Q2 Q3 Q4 Q1 '21
5.3%
4.0%
5.2%
4.2% 3.8%
Q1 '20 Q2 Q3 Q4 Q1 '21
Churn rate
%
1% -9% 2%
-19% -18%
Mobile Customer Base
Impact on MSR from CB reduction ~ +1pp better QoQ (after ~
+1pp in Q4 and +2pp in Q3)
Churn reduced 0.4pp QoQ and 1.5pp YoY
CSI +0.5% QoQ in Q1, after +3.2% in Q4
NPS improving further QoQ and still well above large operators’
19,795 19,554
10,375 10,669
30,170 30,222
Q4 '20 Q1 '21
YoY
(1) QoQ trend affected by phasing in silent lines cancellation in Q4
+52k
Human
Not human
(1)
16. 16
Q1 ’21 RESULTS
Mobile service revenues affected by one offs. Improvement expected from Q2
TIM Domestic
Total Mobile Revenues -8.6% YoY, in line with Q4 (-8.9%)
MSR trend YoY (-11.3%) is mainly explained by:
▪ ~ -5pp of one-off drags(1) set to fade off during the year
(expected ~ -1pp in FY 2021)
▪ ~ -2pp accounting impact(2) affecting organic revenues,
not reported (no impact from Q3, ~ -1pp in FY ‘21)
▪ ~ -1pp related to lapping of past price moves (expected
~ -0.5pp in FY 2021)
▪ ~ -2pp related to customer base trend (vs. ~ -3pp in Q4)
▪ ~ -0.5pp price dynamics also related to convergence
push, with strong benefits on churn (>50% lower)
MTR price reduction explains -0.8pp drag
Handset sales back to growth: +10.4% YoY
Mobile Revenues
Organic data
€ m
91
81
762
676
122
135
Q1 '20 Q1 '21
892
Wholesale
& Other
-11.0%
757
Service
-11.3%
Retail
-11.3%
853
975
Equipment
+10.4%
Total
-8.6%
(1) Including roaming, CSP cleaning, Consip contract renegotiated at lower prices, COVID related retail & wholesale out-of-bundle
(2) Accounting impact of Q1 ‘20 Covid-related Giga free monetized in Q1 ’20 organic revenues
~ -1pp one-off drags in FY 2021 confirmed
17. 17
Q1 ’21 RESULTS
Further acceleration in addressable cost base cut: -8.9% YoY in Q1 (-7.4% in Q4)
(1) Net of capitalized costs
(2) Includes other costs/provision and other income
TIM Domestic
▪ Labour -1% YoY for FTE reduction (-1.9k YoY). Fall would be -9%
net of drag from Telecoms sector contract renewal through
one-off payments rather than salary increases and drag due to
no solidarity in Q1 ‘21 (vs. 3 days of solidarity in Q1 ’20)
Solidarity starts in May for 16 months. No solidarity in H2 2020
▪ Industrial: lower energy costs (-15% YoY) thanks to lower
consumption and better prices
▪ Commercial -21% mainly for lower bad debt (€61m, -62% YoY)
▪ CoGS increase related to ICT revenue growth
▪ Equipment back to growth albeit a bit less than sales growth
▪ Interconnection slight increase for higher traffic volumes
521
93
240
284
168
264
255
Interconnection
Equipment
CoGS
Commercial
Industrial
G&A & IT
Labour
Other
OPEX
Organic data, IFRS 16, € m
1,825
Q1 ’21
+0.8% (+14)
(1)
(2)
YoY change
-21%
-3%
+2%
-1%
+2%
+37%
+40%
Addressable costs
-8.9% YoY
(-7.4% in Q4)
18. 18
Q1 ’21 RESULTS
CAPEX focused on growth, NWC improved further
TIM Group
Organic data, € m
408 490
137
201
545
691
Q1 '20 Q1 '21
Domestic
Brazil
CAPEX focused on growth
Group CAPEX up YoY due to:
▪ more evenly split CAPEX during the year (COVID
affected Q1 ‘20)
▪ push on growth CAPEX (+42% YoY) for FTTx roll out,
kick off of Dazn partnership, Google Cloud partnership
and Data Centers
▪ reduction in maintenance CAPEX (-2% YoY)
Group Operating Working Capital outflow improving €617m YoY
€255m YoY improvement excluding YoY swing in non-recurring items,
benefiting from:
▪ effective working capital management domestically
▪ higher trade payables in Brazil
Group Operating WC improving € 617m YoY
Q1 ’20 Q1 ’21
(348)
269
(39)
(401)
(387) (132)
Group
+255
net non-recurring
items
Net Working Capital
IFRS 16, € m
D YoY
Operating WC Non-recurring items
+617
19. 19
Q1 ’21 RESULTS
Deleverage: € 2.2bn debt cut in Q1 (-€ 2.0bn After Lease view)
TIM Group
€ m; (-) = Cash generated, (+) = Cash absorbed, excluding call-outs
Dividends
& Change
in Equity
FY ’20
Net Debt AL
Operating
FCF
Financial
Expenses
Cash Taxes
& Other
FY ’20
Net Debt
Lease
impact
Lease
impact
EBITDA
CAPEX
ΔWC & Others
1,177
(691)
269
Op.FCF ex. Licence 755
Q1 ‘21
Net Debt
Q1 ’21
Net Debt AL
(1) Includes Inwit deconsolidation
-€ 2,003m
Including FiberCop,
financial investments,
cash taxes & other
Q1 ‘20
FY ’19 -923
21,893 5,775 27,668 (788) 295 (470)(1) 40 26,745 5,034 21,711
33 (7) (1,258) (16) (5,590)
(4,342) (3,363)
470
(1,043)
(3,299)
FY ’19 Q1 ‘20
-182
-€ 2,171m
Δ vs. 2020
2020
20. 20
Q1 ’21 RESULTS
Liquidity margin - After Lease view
Cost of debt ~3.3%, -0.1p.p. QoQ, -0.1p.p. YoY
TIM Group
1.0
0.6
0.7
0.6
0.1
0.1
4.0
5.0
3.1
2.4
3.3
2.0
1.8
7.3
19.9
5.4
10.4
1.0
4.1
3.1
4.0
2.6
1.8
7.5 24.0
Liquidity margin Within 2021 FY 2022 FY 2023 FY 2024 FY 2025 FY 2026 Beyond 2026 Total M/L Term
Debt
(1)
Liquidity Margin Debt Maturities
Bonds Loans
Undrawn portions of committed bank lines
Cash & cash equivalent
Covered until 2023
(1) € 23,953m is the nominal amount of outstanding medium-long term debt. By adding the balance of IAS adjustments and reverse fair value valuations (€ 480m) and current financial
liabilities (€ 333m), the gross debt figure of € 24,766m is reached
21. 21
Q1 ’21 RESULTS
TIM Brasil. Value strategy works: growth rates accelerate
TIM Brasil
(1) Excluding M2M
(2) Pro-forma 2020
Reported data, R$m
Mobile TIM Live
4,091 4,228
+3.3%
+12.4%
+2.8%
ARPU +6.6% YoY
to 25.5 R$/month
Prepaid ARPU +3.9% YoY
Postpaid ARPU +1.9% YoY(1)
Revenues +20.3% YoY
CB +13.3% YoY to 662k
ARPU +6.1% YoY to 89.6 R$
Service Revenues accelerating growth trend thanks to
positive contribution from both mobile postpaid and fixed
Q1 ’20 Q1 ’21
MSR +2.8% YoY (vs. +1.5% in Q4),
Postpaid +3.9% (vs. +3.6% in Q4)
FSR +12.4% YoY driven by TIM Live
~R$ 11m in Q1 ‘21
ARPU growth in all
segments
Reshape of revenue profile,
customer transition to value
FTTH coverage +40% YoY
3.5m HHs covered
Leadership in 4G confirmed
96% urban pop. coverage in >4k cities
Massive MIMO
+477 sites
Network Sharing Agreement
coverage expansion in 348 cities each
EBITDAgrowth supported by revenues
performance and cost control efficiency
1,916
2,008
+4.8%
Q1 ’20 Q1 ’21
EBITDA margin: 46.3%, +0.8pp YoY
Infrastructure Development
>2m invoices paid
Special Projects
Fiber Co
Signing with IHS to accelerate FTTH
rollout (8.9m HHs in 4-year plan)
Deal highlights:
▪ 21x EV/EBITDA(2)
▪ ~R$ 0.6bn primary (EV R$ 2.6bn)
▪ ~R$ 1bn secondary to be paid at
closing
Customer experience
New agreement with Oracle and
Microsoft
Partnerships for IoT
Adecoagro (agri solutions), Anglo
American and Lundin Mining (industry
4.0), Stellantis (connected car)
Financial services
TIM+C6: ~R$11m revenues in Q1 ‘21
ESG
1st telco to migrate 100% of
Data Centers to cloud
122 sky sites to provide
coverage in remote areas
23. 23
Q1 ’21 RESULTS
Strategic initiatives update
Develop
TIM Brasil
▪ Closing of KKR’s purchase of a 37.5% stake last March. €1.8bn cash-in for TIM
▪ Co-investment scheme published and open to all operators
▪ 2021 revenues €1.2-1.3bn, EBITDA c. €0.9bn, debt/EBITDA 3.4x
▪ EBITDA–CAPEX positive from 2025; CAPEX/sales <10% at regime
▪ Oi’s mobile assets integration: ~14.5m customers, ~7.2k mobile sites, ~49 MHz freq.
▪ CADE formal notification in Feb-21, analysis process initiated in Mar-21. Closing by Q4
▪ FiberCo NEWCO 51% owned by IHS(1) 49% by TIM (with prerogative on roll-out decisions)
▪ FiberCo EV R$2.6 bn (21x EBITDA). Closing expected in 2H 2021
AccessCo
▪ Enel announced disposal of 40% of OF to Macquarie and 10% to CDP
▪ CDP will end up with 60% of OF and will appoint CEO
▪ Single controlling shareholder simplifies ongoing dialogue
Data centers
carve out
FiberCop
▪ Carve out of Noovle completed
▪ €0.5bn revenues and €0.2bn EBITDA generated in 2020
▪ €1bn revenues and €0.4bn EBITDA targeted for 2024 confirmed
TIM Group
(1) IHS Fibre Brazil is an industrial player with expertise to help accelerate the FTTH rollout
25. 25
Q1 ’21 RESULTS
2021-’23 guidance
(1) Guidance based on IFRS 16 for EBITDA in Brazil
(2) Including anticipation of 2100 MHz spectrum prepayment (~€0.3bn) and excluding Oi’s mobile acquisition
(3) Based on Organic EBITDA AL; 2.7x based on Reported EBITDA AL
P/L figures @ average exchange-rate actual 5,9 REAIS/EUR
Organic
Service revenues
Low single digit
growth
CAPEX
Eq FCF AL Cumulated ~€ 4.0 bn
Adjusted
Net Debt AL
YoY growth rates,
IFRS 16 / After Lease
2021
Group Domestic Brazil (1)
2022-23 2021 2022-23 2021 2022-23
Organic
EBITDA AL
Low to Mid single
digit growth
Low single digit
growth
Dividend
ordinary: floor of € 1 cent per share, aim to distribute 20-25% of yearly Equity FCF subject to deleverage execution
savings: €2.75 cents per share throughout 2021-23
~€ 16.5 bn
excluding Oi (2)
Stable to Low
single digit growth
Stable Mid single digit
growth
Mid single digit
growth
~R$ 13.0 bn
~R$ 13.5 bn with Oi
Net of ~€0.7bn
tax realignment cost
Mid single digit growth
High single digit growth
(CAGR ‘20-’23) with Oi
Mid single digit growth
Double digit growth
(CAGR ‘20-’23) with Oi
Stable to Low
single digit growth
Stable
2.6x
Net Debt AL / EBITDA AL (3)
by 2023
~€ 2.9 bn per year
Stable to Low
single digit growth
TIM Group
26. 26
Q1 ’21 RESULTS
ESG guidance
(1) “Beyond Connectivity” plan targets were upgraded vs. previous plan, baseline 2019. Domestic, except for indirect emissions and carbon neutrality (Group)
(2) Scope 2, TIM Group
(3) TIM Group
2023
Targets(1)
Employees engagement
Hours of training for reskilling and upskilling
Churn of young employees
+19pp
6.4m hrs
<15%
2024
New VC fund size
Green Smartphone
IoT and Security service revenues (CAGR)
€ 60m
+20%
>15%
2030
2025
Carbon Neutrality(3)
Indirect emissions(2)
Eco-efficiency +50%
Renewable energy on total energy (%) +5pp/yr
-70%
TIM Group
27. 27
Q1 ’21 RESULTS
Closing remarks
▪ Group revenues stable YoY and now more sustainable
▪ Domestic FSR and fixed lines stable, UBB growth defeating seasonality
▪ Convergence bringing mobile churn at lowest level in 14 years
▪ Setting the scene for domestic growth through football, FiberCop and “beyond connectivity” plan
▪ Public funding and macro forecasts further improved post new release of Recovery plan
▪ Cost cutting accelerated, Equity Free Cash flow generation growing
▪ Q1 net debt close to YE 2021 target
TIM Group
30. 30
Q1 ’21 RESULTS
IFRS 16 and IFRS 16 After Lease view
TIM Group
€ m, organic
Group
Q1 ’20
EBITDA
195
1,599 (193)
Lease
impact
1,406 1,578
Q1 ‘20
EBITDA AL
Q1 ‘21
EBITDA AL
1,383
Q1 ‘21
EBITDA
(1.7%)
(1.3%)
Lease
impact
€ m, organic
Domestic
125
1,310 (128) 1,182 1,276
1,151
(2.6%)
(2.6%)
Q1 ‘20
EBITDA
Lease
impact
Q1 ‘21
EBITDA
Lease
impact
Q1 ‘20
EBITDA AL
Q1 ‘21
EBITDA AL
EBITDA After Lease
Equity Free Cash Flow After Lease
EFCF
Q1 ’20
162
466 (271)
IFRS 16
& IAS17
195
469
EFCF AL
Q1 ’20
EFCF AL
Q1 ’21
307
EFCF
Q1 ’21
+112
+3
IFRS 16
& IAS17
€ m, reported
Net Debt
Q1 ‘20
4,564
26,745 (5,034)
IFRS 16
& IAS17
21,711 21,155
Net Debt AL
Q1 ‘20
Net Debt AL
Q1 ’21
16,591
Net Debt
Q1 ’21
(5,120)
(5,590)
Net Debt After Lease
IFRS 16
& IAS17
€ m, reported
31. 31
Q1 ’21 RESULTS
TIM Group
▪ Decree-Law 104/2020 allows for realignment of intangible asset tax value to the book value
▪ 3% substitute tax to be paid on the amount redeemed
▪ Future income taxes will benefit from intangible asset tax amortization
Realignment
of the tax value
▪ Overall tax benefit: € 5.9bn (28.5% of tax basis) net of substitute tax
▪ Benefit will occur over 18 years
TIM SpA intangible assets
redeemed
▪ To be paid in 3 annual instalments (€ 0.2bn per year), from June 2021
Substitute tax (3%): € 0.7bn
Realignment of intangible asset tax value
32. 32
Q1 ’21 RESULTS
Reported data, € m, Rounded numbers
Net Interest &
Net Income/
Equity/ Disc.
Operations
EBIT Group Net
Result
excl. NRI
Taxes Group
Net Result
Minorities
EBITDA
Reported
Depreciation &
Amortization
& Other
Q1 ‘20 533 140 (82) 591 (31) 560
1,735 (1,202)
Δ vs. Q1 ‘20 70 (488) (417)(1) 120 (785) 9 (776)
(558)
Q1 ‘21
TIM Group
Net financial expenses (288)
Income equity invested 11
Net Income
Net Result
after
Minorities
Non-Recurring
Items (NRI)
(415) 145
725 (51)
Covid impact 12
Personnel and other 389
Taxes (91)
(1) Of which Inwit gain on disposal 441m
o/w NRI on Personnel Q1 ‘21 €311m
33. 33
Q1 ’21 RESULTS
* Including cost of all leases
Cost of debt ~3.6%*, -0.1p.p. QoQ, -0.3p.p. YoY
TIM Group
Bonds Loans
Undrawn portions of committed bank lines
Cash & cash equivalent Finance Leases
0.5 0.5
0.5
0.5
0.5
0.4
1.8
4.6
1.0
1.0
0.6
0.7
0.6
0.1
4.0
5.0
3.1
2.4
3.3
2.0
1.8
7.3
19.9
5.4
10.4
1.4
4.6
3.6
4.5
3.0
2.2
9.2 28.6
Liquidity margin Within 2021 FY 2022 FY 2023 FY 2024 FY 2025 FY 2026 Beyond 2026 Total M/L Term
Debt
(1)
Liquidity Margin Debt Maturities
(1) € 28,600m is the nominal amount of outstanding medium-long term debt. By adding the balance of IAS adjustments and reverse fair value valuations (€ 509m)
and current financial liabilities (€ 333m), the gross debt figure of € 29,442m is reached
Covered until 2023
Liquidity margin - IFRS 16 view
34. 34
Q1 ’21 RESULTS
Well diversified and hedged debt
TIM Group
Average m/l term maturity:
7.0 years (bond 6.8 years only)
Fixed rate portion on medium-long term debt ~72%
Around 26% of outstanding bonds (nominal amount)
denominated in USD and GBP and fully hedged
Banks & EIB
14.1%
Bonds
68.2%
Other
1.8%
Op. leases
and long rent
15.9%
Gross Debt
(1) Refers to positive MTM derivatives (accrued interests and exchange rate) for € 791m, financial receivables for lease for € 112m and other credits for € 2,028m
NFP
adjusted
Fair
value
NFP
accounting
GROSS DEBT
Bonds 20,078 267 20,345
Banks & EIB 4,146 - 4,146
Derivatives 197 1,451 1,648
Op. leases and long rent 4,676 - 4,676
Other 345 - 345
TOTAL 29,442 1,718 31,160
FINANCIAL ASSETS
Liquidity position 5,356 - 5,356
Other
(1)
2,931 1,201 4,132
TOTAL 8,287 1,201 9,488
NET FINANCIAL DEBT 21,155 517 21,672
35. 35
Q1 ’21 RESULTS
EBITDA to evolve to FTTH in time…
FiberCop value to grow over time
thanks to switch in the mix from copper towards fiber
Revenues
2021 € 1.2 – 1.3bn
EBITDA
2021 ~€ 0.9bn
Net Debt / EBITDA
2021 3.4x
FiberCop Financials
EBITDA - CAPEX
Positive from
2025
CAPEX / Sales
at regime <10%
14%
57%
82%
2021 2022 2023 2024 2025 2026 2027 2028 2029 2030
Revenues from Fiber EBITDA from Fiber Fiber Lines
FiberCop Financials in a nutshell(1)
(1) More details in August 31st 2020 presentation
36. 36
Q1 ’21 RESULTS
For further questions please contact the IR team
(+39) 06 3688 1 // (+39) 02 8595 1
Investor_relations@telecomitalia.it
www.gruppotim.it
www.twitter.com/TIMNewsroom
www.slideshare.net/telecomitaliacorporate