SlideShare a Scribd company logo
Newsom
Psy 521/621 Univariate Quantitative Methods, Fall 2020 1
Levels of Measurement and Choosing the Correct Statistical Test
Most textbooks distinguish among nominal, ordinal, interval, and ratio scales based on a classification
system developed by Stevens (1946). Choice of the statistical analyses in the social sciences typically
rests on a more general or cruder classification of measures into what I will call “continuous” and
“discrete.” Continuous refers to a variable with many possible values. By "discrete" I mean few
categories. I, as well as others, often use the terms “dichotomous,” “binary,” “categorical,” or “qualitative”
synonymously with “discrete.” 1
This general characterization of a dependent (response) variable as
discrete or continuous relates to two general classes of commonly employed statistical tests—those
based on the normal distribution and those based on the binomial distribution (or its relatives, the
multinomial and Poisson distributions). Normal theory plays an important role in statistical tests with
continuous dependent variables, such as t-tests, ANOVA, correlation, and regression, and binomial
theory plays an important role in statistical tests with discrete dependent variables, such as chi-square
and logistic regression.2
Ordinal scales with few categories (2,3, or possibly 4) and nominal measures are often classified as
discrete and are analyzed using binomial class of statistical tests, whereas ordinal scales with many
categories (5 or more), interval, and ratio, are usually analyzed with the normal theory class of statistical
tests. Although the distinction is a somewhat fuzzy one, it is often a very useful distinction for choosing
the preferred statistical test, especially when you are starting out.
Type of Dependent
Variable (or Scale)
Level of
Measurement
General Class of
Statistic
Examples of Statistical
Procedures
Discrete
(binary and categorical)
nominal, ordinal
with 2, 3, or 4
levels
Binomial
(as well as multinomial and
Poisson)
chi-square, logistic regression
Continuous ordinal with more
than 4 categories,
interval, ratio
normal ANOVA, regression, correlation,
t-tests
Classifying the independent and the dependent variable as continuous or discrete will determine the type
of analyses that are likely to be appropriate in a given situation.
Dependent Variable
Discrete Continuous
Independent
variable
Discrete
(binary and categorical)
Chi-square
Logistic Regression
Phi
Cramer's V
t-test
ANOVA
Regression
Point-biserial Correlation
Continuous
Logistic Regression
Point-biserial Correlation
Regression
Correlation
Controversies and Common Practice
There is a longstanding debate about how to classify measurements and whether levels of
measurement can be a successful guide to the choice of data analysis type (e.g., Borgatta & Bohrnstedt,
1980; Michell, 1986; Townsend & Ashby, 1984; see Hayes & Embretson, 2012; Scholten & Borsboom,
2009 for recent discussions of the controversy). 3
In my view, there are two relevant issues that should
1
Mathematicians will define discrete variables more generally in a way that will include many if not most of the variables that social scientists
view as “continuous” in common practice. For example, Hays (1994) gives “If a random variable can assume only a particular finite or a
countably infinite set of values, it is said to be a discrete random variable.” (p. 98)
2
As we will discover later, the Pearson chi-square test really uses a normal distribution as an approximation, but the binomial (or multinomial)
distribution is central to most statistics used with categorical dependent variables. I have placed chi-square with the binomial theory class of
statistics, therefore, because the normal distribution is really just used as an efficient substitute for the binomial distribution.
3
My intention is not to try to resolve the debate, but to offer a general simple heuristic as a starting place for deciding which type of analysis is
used in common practice in the social sciences for general types of dependent variables. In reality, there are a number of other factors that
Newsom
Psy 521/621 Univariate Quantitative Methods, Fall 2020 2
be distinguished from one another. The first issue is a more philosophical concern about whether
psychological (or other social) phenomena can be reliably and validly represented by numeric ordinal
data. I happen to believe that there is a wealth of psychometric research that has already established this
to be the case (e.g., Bendig, 1954; Symonds, 1924; Matell & Jacoby, 1971), but I will leave this
controversy to those more qualified to consider deep epistemological dilemmas (which are, frankly, often
over my head).
The second issue is more of an empirical or statistical question about whether scales, such as
Likert-type scales, with some sufficient number of several ordinal response options will provide accurate
results when normal distribution statistical tests (e.g., t-tests, ANOVA, OLS regression) are used. There
seems to be fairly good evidence from simulation studies that suggests that if there are 5 or more
ordered categories there is relatively little harm in treating these ordinal variables as continuous (e.g.,
Johnson & Creech, 1983; Muthén & Kaplan, 1985; Zumbo & Zimmerman, 1993; Taylor, West, & Aiken,
2006). There appears to be added benefit to additional ordinal values up to some point (at least to 7- or
9-point scales). Note that this distinction applies to the dependent variable used in the analysis to the
response categories used in a survey whenever multiple items are combined (e.g., by computing the
mean or sum)—a composite measure that will have many values and will usually be considered
continuous. There are other concerns that are important, such as the distribution of the variable. Normal
distribution statistics, such as OLS regression and ANOVA, are remarkably robust to small or moderate
departures from normality if sample sizes are even moderate (e.g., N = 20-40; Myers, Well, & Lorch,
2010; Stonehouse & Forrester, 1998), more substantial departures can usually be addressed with robust
approaches (e.g., robust standard errors in regression or structural modeling, bootstrap estimates).
When sample sizes are small and distributions are highly nonnormal, nonparametric tests (e.g., Mann-
Whitney U test, Kruskal-Wallis ANOVA) may be optimal (see Sheskin, 2011, for an extensive list).
Ordinal Analyses
The contrast between discrete and continuous variables is an oversimplification. There really is a big
gray area when there are 3 or 4 ordinal categories. Although in practice, most researchers only tend to
use binomial and normal theory statistics, there is another class of statistical tests specifically designed
for ordinal scales that are becoming increasingly available in software packages. There are several
excellent references for ordinal statistical tests (Agresti, 1984, 2002; Cliff, 1996; Wickens, 1989). For
regression models, Long’s (1997) book is a very good, although technical, treatment. There is likely to
be some statistical power advantage to using ordinal statistics over binomial statistics, and there is likely
to be some accuracy gained in the statistical tests for using ordinal statistics over normal theory statistics
when there are few categories or for certain other data conditions.
Problems with Crude Categorization and Artificial Dichotomization
One needs to be careful about converting continuous variables into dichotomous or categorical variables.
One example is the practice of doing a “median split,” which puts those with scores above and below the
median into two categories, but other methods of artificial categorization can be just as problematic.
Generally, a great deal of useful information is discarded, but other statistical issues arise. Although
many papers have been published as far back as the 1940s on this topic, the practice of dichotomizing
continuous variables is still quite prevalent. A paper by MacCullum, Zhang, Preacher, and Rucker (2002)
is a superb overview of the problems and potentially serious consequences of this practice. DeCoster
and colleagues (2009) discuss a few of the exceptions in which fewer crude categories may be useful.
The same concerns apply, of course, to what measures we choose to employ for measuring underlying
variables that are truly continuous.
References and Further Readings
Agresti, A. (1984). Analysis of ordinal categorical data. NY: Wiley.
Agresti, A. (2002.) Categorical Data Analysis, second edition. NY: Wiley.
must be considered in deciding on the most appropriate and statistically accurate analysis, including the distribution of the dependent variable,
whether it is count data, and sample size among others. Think about the system I propose here as a kind of analysis triage or grand
organizational scheme and trust that I will cover some of the caveats and other special considerations as we go along.
Newsom
Psy 521/621 Univariate Quantitative Methods, Fall 2020 3
Bendig, A. W. (1954). Reliability and the number of rating scale categories. The Journal of Applied Psychology, 38, 38±40.
Borgatta, E.F., and Bohrnstedt, G.W. (1980). Level of measurement - Once over again. Sociological Methods and Research, 9, 147-160.
Cliff, N. (1996). Ordinal methods for behavioral data analysis. Mahwah, NJ: Erbaum.
DeCoster, J., Iselin, A. M. R., & Gallucci, M. (2009). A conceptual and empirical examination of justifications for dichotomization. Psychological
methods, 14(4), 349-366.
Hayes, H., & Embretson, S.E. Psychological measurement: Scaling and analysis. In H. Cooper; P.M. Camic, D.L. Long, A.T. Panter, and D.
Rindskopf (Eds). APA handbook of research methods in psychology, Vol 1: Foundations, planning, measures, and psychometrics (pp. 163-
179) Washington, DC: American Psychological Association.
Hays, W.L. (1994). Statistics, Fifth Edition. Belmont, CA: Wadsworth.
Johnson, D.R., & Creech, J.C. (1983) Ordinal measures in multiple indicator models: A simulation study of categorization error. American
Sociological Review, 48, 398-407.
Long, J.S. (1997). Regression models for categorical and limited dependent variables. Thousand Oaks, CA: Sage.
MacCallum, R.X., Zhang, S., Preacher, K.J., & Rucker, D.D. (2002). On the practice of dichotomization of quantitative variables. Psychological
Methods, 7, 1-40.
Matell, M. S., & Jacoby, J. (1971). Is there an optimal number of alternatives for Likert scale items? Study. Educational and psychological
measurement, 31, 657-674.
Michell, J. (1986). Measurement scales and statistics: A clash of paradigms. Psychological Bulletin, 100, 398_407.
Muthén, B., & Kaplan, D. (1985). A comparison of some methodologies for the factor analysis of non‐normal Likert variables. British Journal of
Mathematical and Statistical Psychology, 38(2), 171-189.
Myers, J. L., Well, A., & Lorch, R. F. (2010). Research design and statistical analysis. New York: Routledge.
Scholten, A. Z., & Borsboom, D. (2009). A reanalysis of Lord’s statistical treatment of football numbers. Journal of Mathematical
Psychology, 53(2), 69-75.
Sheskin, D. J. (2011). Handbook of parametric and nonparametric statistical procedures, fifth edition. Raleigh, NC: Chapman & Hall/CRC Press.
Stevens, S.S. (1946). On the theory of scales of measurement. Science, 103, 677-680.
Stonehouse, J. M., & Forrester, G. J. (1998). Robustness of the t and U tests under combined assumption violations. Journal of Applied
Statistics, 25, 63-74.
Symonds, P. M. (1924). On the loss of reliability in ratings due to coarseness of the scale. Journal of Experimental Psychology, 7, 456-461.
Taylor, A. B., West, S. G., & Aiken, L. S. (2006). Loss of power in logistic, ordinal logistic, and probit regression when an outcome variable is
coarsely categorized. Educational and psychological measurement, 66(2), 228-239.
Townsend, J. T. and Ashby, F. G. (1984), Measurement Scales and Statistics: The Misconception Misconceived, Psychological Bulletin, 96, pp.
394-401.
Wickens, T.D. (1989). Multiway contingency tables analysis for the social sciences. Hillsdale, NJ: Erlbaum.
Zumbo, B.D., & Zimmerman, D.W. (1993). Is the selection of statistical methods governed by level of measurement? Canadian Psychology, 34,
390-400.

More Related Content

Similar to Levels of Measurement.pdf

Data Analysis
Data Analysis Data Analysis
Data Analysis
DawitDibekulu
 
·Quantitative Data Analysis StatisticsIntroductionUnd.docx
·Quantitative Data Analysis StatisticsIntroductionUnd.docx·Quantitative Data Analysis StatisticsIntroductionUnd.docx
·Quantitative Data Analysis StatisticsIntroductionUnd.docx
lanagore871
 
Lect 1_Biostat.pdf
Lect 1_Biostat.pdfLect 1_Biostat.pdf
Lect 1_Biostat.pdf
BirhanTesema
 
Pg. 05Question FiveAssignment #Deadline Day 22.docx
Pg. 05Question FiveAssignment #Deadline Day 22.docxPg. 05Question FiveAssignment #Deadline Day 22.docx
Pg. 05Question FiveAssignment #Deadline Day 22.docx
mattjtoni51554
 
Statistical Methods in Psychology JournalsGuidelines and Exp.docx
Statistical Methods in Psychology JournalsGuidelines and Exp.docxStatistical Methods in Psychology JournalsGuidelines and Exp.docx
Statistical Methods in Psychology JournalsGuidelines and Exp.docx
susanschei
 
Introduction To Statistics
Introduction To StatisticsIntroduction To Statistics
Introduction To Statistics
albertlaporte
 
Selection of appropriate data analysis technique
Selection of appropriate data analysis techniqueSelection of appropriate data analysis technique
Selection of appropriate data analysis technique
RajaKrishnan M
 
Presentation1
Presentation1Presentation1
Presentation1
Nalini Singh
 
Need a nonplagiarised paper and a form completed by 1006015 before.docx
Need a nonplagiarised paper and a form completed by 1006015 before.docxNeed a nonplagiarised paper and a form completed by 1006015 before.docx
Need a nonplagiarised paper and a form completed by 1006015 before.docx
lea6nklmattu
 
CHAPTER 8 QUANTITATIVE METHODSWe turn now from the introductio
CHAPTER 8 QUANTITATIVE METHODSWe turn now from the introductioCHAPTER 8 QUANTITATIVE METHODSWe turn now from the introductio
CHAPTER 8 QUANTITATIVE METHODSWe turn now from the introductio
JinElias52
 
Stats Workshop2010
Stats Workshop2010Stats Workshop2010
Stats Workshop2010
anesah
 
Statistics and permeability engineering reports
Statistics and permeability engineering reportsStatistics and permeability engineering reports
Statistics and permeability engineering reports
wwwmostafalaith99
 
Edison S Statistics
Edison S StatisticsEdison S Statistics
Edison S Statistics
teresa_soto
 
A review of statistics
A review of statisticsA review of statistics
A review of statistics
edisonre
 
Edisons Statistics
Edisons StatisticsEdisons Statistics
Edisons Statistics
teresa_soto
 
A Method for Meta-Analytic Confirmatory Factor Analysis
A Method for Meta-Analytic Confirmatory Factor AnalysisA Method for Meta-Analytic Confirmatory Factor Analysis
A Method for Meta-Analytic Confirmatory Factor Analysis
Kamden Strunk
 
Anatomy of a meta analysis i like
Anatomy of a meta analysis i likeAnatomy of a meta analysis i like
Anatomy of a meta analysis i like
James Coyne
 
Module 4 data analysis
Module 4 data analysisModule 4 data analysis
Module 4 data analysis
ILRI-Jmaru
 
BRM_Data Analysis, Interpretation and Reporting Part II.ppt
BRM_Data Analysis, Interpretation and Reporting Part II.pptBRM_Data Analysis, Interpretation and Reporting Part II.ppt
BRM_Data Analysis, Interpretation and Reporting Part II.ppt
AbdifatahAhmedHurre
 
MELJUN CORTES research seminar_1__data_analysis_basics_slides_2nd_updates
MELJUN CORTES research seminar_1__data_analysis_basics_slides_2nd_updatesMELJUN CORTES research seminar_1__data_analysis_basics_slides_2nd_updates
MELJUN CORTES research seminar_1__data_analysis_basics_slides_2nd_updates
MELJUN CORTES
 

Similar to Levels of Measurement.pdf (20)

Data Analysis
Data Analysis Data Analysis
Data Analysis
 
·Quantitative Data Analysis StatisticsIntroductionUnd.docx
·Quantitative Data Analysis StatisticsIntroductionUnd.docx·Quantitative Data Analysis StatisticsIntroductionUnd.docx
·Quantitative Data Analysis StatisticsIntroductionUnd.docx
 
Lect 1_Biostat.pdf
Lect 1_Biostat.pdfLect 1_Biostat.pdf
Lect 1_Biostat.pdf
 
Pg. 05Question FiveAssignment #Deadline Day 22.docx
Pg. 05Question FiveAssignment #Deadline Day 22.docxPg. 05Question FiveAssignment #Deadline Day 22.docx
Pg. 05Question FiveAssignment #Deadline Day 22.docx
 
Statistical Methods in Psychology JournalsGuidelines and Exp.docx
Statistical Methods in Psychology JournalsGuidelines and Exp.docxStatistical Methods in Psychology JournalsGuidelines and Exp.docx
Statistical Methods in Psychology JournalsGuidelines and Exp.docx
 
Introduction To Statistics
Introduction To StatisticsIntroduction To Statistics
Introduction To Statistics
 
Selection of appropriate data analysis technique
Selection of appropriate data analysis techniqueSelection of appropriate data analysis technique
Selection of appropriate data analysis technique
 
Presentation1
Presentation1Presentation1
Presentation1
 
Need a nonplagiarised paper and a form completed by 1006015 before.docx
Need a nonplagiarised paper and a form completed by 1006015 before.docxNeed a nonplagiarised paper and a form completed by 1006015 before.docx
Need a nonplagiarised paper and a form completed by 1006015 before.docx
 
CHAPTER 8 QUANTITATIVE METHODSWe turn now from the introductio
CHAPTER 8 QUANTITATIVE METHODSWe turn now from the introductioCHAPTER 8 QUANTITATIVE METHODSWe turn now from the introductio
CHAPTER 8 QUANTITATIVE METHODSWe turn now from the introductio
 
Stats Workshop2010
Stats Workshop2010Stats Workshop2010
Stats Workshop2010
 
Statistics and permeability engineering reports
Statistics and permeability engineering reportsStatistics and permeability engineering reports
Statistics and permeability engineering reports
 
Edison S Statistics
Edison S StatisticsEdison S Statistics
Edison S Statistics
 
A review of statistics
A review of statisticsA review of statistics
A review of statistics
 
Edisons Statistics
Edisons StatisticsEdisons Statistics
Edisons Statistics
 
A Method for Meta-Analytic Confirmatory Factor Analysis
A Method for Meta-Analytic Confirmatory Factor AnalysisA Method for Meta-Analytic Confirmatory Factor Analysis
A Method for Meta-Analytic Confirmatory Factor Analysis
 
Anatomy of a meta analysis i like
Anatomy of a meta analysis i likeAnatomy of a meta analysis i like
Anatomy of a meta analysis i like
 
Module 4 data analysis
Module 4 data analysisModule 4 data analysis
Module 4 data analysis
 
BRM_Data Analysis, Interpretation and Reporting Part II.ppt
BRM_Data Analysis, Interpretation and Reporting Part II.pptBRM_Data Analysis, Interpretation and Reporting Part II.ppt
BRM_Data Analysis, Interpretation and Reporting Part II.ppt
 
MELJUN CORTES research seminar_1__data_analysis_basics_slides_2nd_updates
MELJUN CORTES research seminar_1__data_analysis_basics_slides_2nd_updatesMELJUN CORTES research seminar_1__data_analysis_basics_slides_2nd_updates
MELJUN CORTES research seminar_1__data_analysis_basics_slides_2nd_updates
 

Recently uploaded

The basics of sentences session 6pptx.pptx
The basics of sentences session 6pptx.pptxThe basics of sentences session 6pptx.pptx
The basics of sentences session 6pptx.pptx
heathfieldcps1
 
ANATOMY AND BIOMECHANICS OF HIP JOINT.pdf
ANATOMY AND BIOMECHANICS OF HIP JOINT.pdfANATOMY AND BIOMECHANICS OF HIP JOINT.pdf
ANATOMY AND BIOMECHANICS OF HIP JOINT.pdf
Priyankaranawat4
 
Advanced Java[Extra Concepts, Not Difficult].docx
Advanced Java[Extra Concepts, Not Difficult].docxAdvanced Java[Extra Concepts, Not Difficult].docx
Advanced Java[Extra Concepts, Not Difficult].docx
adhitya5119
 
Community pharmacy- Social and preventive pharmacy UNIT 5
Community pharmacy- Social and preventive pharmacy UNIT 5Community pharmacy- Social and preventive pharmacy UNIT 5
Community pharmacy- Social and preventive pharmacy UNIT 5
sayalidalavi006
 
The simplified electron and muon model, Oscillating Spacetime: The Foundation...
The simplified electron and muon model, Oscillating Spacetime: The Foundation...The simplified electron and muon model, Oscillating Spacetime: The Foundation...
The simplified electron and muon model, Oscillating Spacetime: The Foundation...
RitikBhardwaj56
 
Pollock and Snow "DEIA in the Scholarly Landscape, Session One: Setting Expec...
Pollock and Snow "DEIA in the Scholarly Landscape, Session One: Setting Expec...Pollock and Snow "DEIA in the Scholarly Landscape, Session One: Setting Expec...
Pollock and Snow "DEIA in the Scholarly Landscape, Session One: Setting Expec...
National Information Standards Organization (NISO)
 
South African Journal of Science: Writing with integrity workshop (2024)
South African Journal of Science: Writing with integrity workshop (2024)South African Journal of Science: Writing with integrity workshop (2024)
South African Journal of Science: Writing with integrity workshop (2024)
Academy of Science of South Africa
 
Film vocab for eal 3 students: Australia the movie
Film vocab for eal 3 students: Australia the movieFilm vocab for eal 3 students: Australia the movie
Film vocab for eal 3 students: Australia the movie
Nicholas Montgomery
 
Your Skill Boost Masterclass: Strategies for Effective Upskilling
Your Skill Boost Masterclass: Strategies for Effective UpskillingYour Skill Boost Masterclass: Strategies for Effective Upskilling
Your Skill Boost Masterclass: Strategies for Effective Upskilling
Excellence Foundation for South Sudan
 
S1-Introduction-Biopesticides in ICM.pptx
S1-Introduction-Biopesticides in ICM.pptxS1-Introduction-Biopesticides in ICM.pptx
S1-Introduction-Biopesticides in ICM.pptx
tarandeep35
 
ISO/IEC 27001, ISO/IEC 42001, and GDPR: Best Practices for Implementation and...
ISO/IEC 27001, ISO/IEC 42001, and GDPR: Best Practices for Implementation and...ISO/IEC 27001, ISO/IEC 42001, and GDPR: Best Practices for Implementation and...
ISO/IEC 27001, ISO/IEC 42001, and GDPR: Best Practices for Implementation and...
PECB
 
How to Manage Your Lost Opportunities in Odoo 17 CRM
How to Manage Your Lost Opportunities in Odoo 17 CRMHow to Manage Your Lost Opportunities in Odoo 17 CRM
How to Manage Your Lost Opportunities in Odoo 17 CRM
Celine George
 
How to Build a Module in Odoo 17 Using the Scaffold Method
How to Build a Module in Odoo 17 Using the Scaffold MethodHow to Build a Module in Odoo 17 Using the Scaffold Method
How to Build a Module in Odoo 17 Using the Scaffold Method
Celine George
 
BBR 2024 Summer Sessions Interview Training
BBR  2024 Summer Sessions Interview TrainingBBR  2024 Summer Sessions Interview Training
BBR 2024 Summer Sessions Interview Training
Katrina Pritchard
 
Liberal Approach to the Study of Indian Politics.pdf
Liberal Approach to the Study of Indian Politics.pdfLiberal Approach to the Study of Indian Politics.pdf
Liberal Approach to the Study of Indian Politics.pdf
WaniBasim
 
The Diamonds of 2023-2024 in the IGRA collection
The Diamonds of 2023-2024 in the IGRA collectionThe Diamonds of 2023-2024 in the IGRA collection
The Diamonds of 2023-2024 in the IGRA collection
Israel Genealogy Research Association
 
Digital Artefact 1 - Tiny Home Environmental Design
Digital Artefact 1 - Tiny Home Environmental DesignDigital Artefact 1 - Tiny Home Environmental Design
Digital Artefact 1 - Tiny Home Environmental Design
amberjdewit93
 
PIMS Job Advertisement 2024.pdf Islamabad
PIMS Job Advertisement 2024.pdf IslamabadPIMS Job Advertisement 2024.pdf Islamabad
PIMS Job Advertisement 2024.pdf Islamabad
AyyanKhan40
 
Hindi varnamala | hindi alphabet PPT.pdf
Hindi varnamala | hindi alphabet PPT.pdfHindi varnamala | hindi alphabet PPT.pdf
Hindi varnamala | hindi alphabet PPT.pdf
Dr. Mulla Adam Ali
 
Natural birth techniques - Mrs.Akanksha Trivedi Rama University
Natural birth techniques - Mrs.Akanksha Trivedi Rama UniversityNatural birth techniques - Mrs.Akanksha Trivedi Rama University
Natural birth techniques - Mrs.Akanksha Trivedi Rama University
Akanksha trivedi rama nursing college kanpur.
 

Recently uploaded (20)

The basics of sentences session 6pptx.pptx
The basics of sentences session 6pptx.pptxThe basics of sentences session 6pptx.pptx
The basics of sentences session 6pptx.pptx
 
ANATOMY AND BIOMECHANICS OF HIP JOINT.pdf
ANATOMY AND BIOMECHANICS OF HIP JOINT.pdfANATOMY AND BIOMECHANICS OF HIP JOINT.pdf
ANATOMY AND BIOMECHANICS OF HIP JOINT.pdf
 
Advanced Java[Extra Concepts, Not Difficult].docx
Advanced Java[Extra Concepts, Not Difficult].docxAdvanced Java[Extra Concepts, Not Difficult].docx
Advanced Java[Extra Concepts, Not Difficult].docx
 
Community pharmacy- Social and preventive pharmacy UNIT 5
Community pharmacy- Social and preventive pharmacy UNIT 5Community pharmacy- Social and preventive pharmacy UNIT 5
Community pharmacy- Social and preventive pharmacy UNIT 5
 
The simplified electron and muon model, Oscillating Spacetime: The Foundation...
The simplified electron and muon model, Oscillating Spacetime: The Foundation...The simplified electron and muon model, Oscillating Spacetime: The Foundation...
The simplified electron and muon model, Oscillating Spacetime: The Foundation...
 
Pollock and Snow "DEIA in the Scholarly Landscape, Session One: Setting Expec...
Pollock and Snow "DEIA in the Scholarly Landscape, Session One: Setting Expec...Pollock and Snow "DEIA in the Scholarly Landscape, Session One: Setting Expec...
Pollock and Snow "DEIA in the Scholarly Landscape, Session One: Setting Expec...
 
South African Journal of Science: Writing with integrity workshop (2024)
South African Journal of Science: Writing with integrity workshop (2024)South African Journal of Science: Writing with integrity workshop (2024)
South African Journal of Science: Writing with integrity workshop (2024)
 
Film vocab for eal 3 students: Australia the movie
Film vocab for eal 3 students: Australia the movieFilm vocab for eal 3 students: Australia the movie
Film vocab for eal 3 students: Australia the movie
 
Your Skill Boost Masterclass: Strategies for Effective Upskilling
Your Skill Boost Masterclass: Strategies for Effective UpskillingYour Skill Boost Masterclass: Strategies for Effective Upskilling
Your Skill Boost Masterclass: Strategies for Effective Upskilling
 
S1-Introduction-Biopesticides in ICM.pptx
S1-Introduction-Biopesticides in ICM.pptxS1-Introduction-Biopesticides in ICM.pptx
S1-Introduction-Biopesticides in ICM.pptx
 
ISO/IEC 27001, ISO/IEC 42001, and GDPR: Best Practices for Implementation and...
ISO/IEC 27001, ISO/IEC 42001, and GDPR: Best Practices for Implementation and...ISO/IEC 27001, ISO/IEC 42001, and GDPR: Best Practices for Implementation and...
ISO/IEC 27001, ISO/IEC 42001, and GDPR: Best Practices for Implementation and...
 
How to Manage Your Lost Opportunities in Odoo 17 CRM
How to Manage Your Lost Opportunities in Odoo 17 CRMHow to Manage Your Lost Opportunities in Odoo 17 CRM
How to Manage Your Lost Opportunities in Odoo 17 CRM
 
How to Build a Module in Odoo 17 Using the Scaffold Method
How to Build a Module in Odoo 17 Using the Scaffold MethodHow to Build a Module in Odoo 17 Using the Scaffold Method
How to Build a Module in Odoo 17 Using the Scaffold Method
 
BBR 2024 Summer Sessions Interview Training
BBR  2024 Summer Sessions Interview TrainingBBR  2024 Summer Sessions Interview Training
BBR 2024 Summer Sessions Interview Training
 
Liberal Approach to the Study of Indian Politics.pdf
Liberal Approach to the Study of Indian Politics.pdfLiberal Approach to the Study of Indian Politics.pdf
Liberal Approach to the Study of Indian Politics.pdf
 
The Diamonds of 2023-2024 in the IGRA collection
The Diamonds of 2023-2024 in the IGRA collectionThe Diamonds of 2023-2024 in the IGRA collection
The Diamonds of 2023-2024 in the IGRA collection
 
Digital Artefact 1 - Tiny Home Environmental Design
Digital Artefact 1 - Tiny Home Environmental DesignDigital Artefact 1 - Tiny Home Environmental Design
Digital Artefact 1 - Tiny Home Environmental Design
 
PIMS Job Advertisement 2024.pdf Islamabad
PIMS Job Advertisement 2024.pdf IslamabadPIMS Job Advertisement 2024.pdf Islamabad
PIMS Job Advertisement 2024.pdf Islamabad
 
Hindi varnamala | hindi alphabet PPT.pdf
Hindi varnamala | hindi alphabet PPT.pdfHindi varnamala | hindi alphabet PPT.pdf
Hindi varnamala | hindi alphabet PPT.pdf
 
Natural birth techniques - Mrs.Akanksha Trivedi Rama University
Natural birth techniques - Mrs.Akanksha Trivedi Rama UniversityNatural birth techniques - Mrs.Akanksha Trivedi Rama University
Natural birth techniques - Mrs.Akanksha Trivedi Rama University
 

Levels of Measurement.pdf

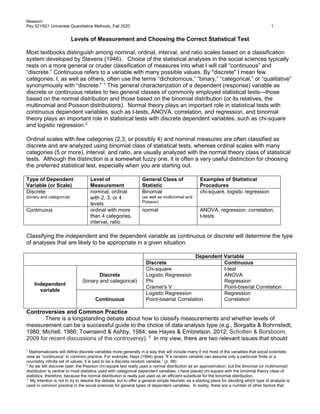
  • 1. Newsom Psy 521/621 Univariate Quantitative Methods, Fall 2020 1 Levels of Measurement and Choosing the Correct Statistical Test Most textbooks distinguish among nominal, ordinal, interval, and ratio scales based on a classification system developed by Stevens (1946). Choice of the statistical analyses in the social sciences typically rests on a more general or cruder classification of measures into what I will call “continuous” and “discrete.” Continuous refers to a variable with many possible values. By "discrete" I mean few categories. I, as well as others, often use the terms “dichotomous,” “binary,” “categorical,” or “qualitative” synonymously with “discrete.” 1 This general characterization of a dependent (response) variable as discrete or continuous relates to two general classes of commonly employed statistical tests—those based on the normal distribution and those based on the binomial distribution (or its relatives, the multinomial and Poisson distributions). Normal theory plays an important role in statistical tests with continuous dependent variables, such as t-tests, ANOVA, correlation, and regression, and binomial theory plays an important role in statistical tests with discrete dependent variables, such as chi-square and logistic regression.2 Ordinal scales with few categories (2,3, or possibly 4) and nominal measures are often classified as discrete and are analyzed using binomial class of statistical tests, whereas ordinal scales with many categories (5 or more), interval, and ratio, are usually analyzed with the normal theory class of statistical tests. Although the distinction is a somewhat fuzzy one, it is often a very useful distinction for choosing the preferred statistical test, especially when you are starting out. Type of Dependent Variable (or Scale) Level of Measurement General Class of Statistic Examples of Statistical Procedures Discrete (binary and categorical) nominal, ordinal with 2, 3, or 4 levels Binomial (as well as multinomial and Poisson) chi-square, logistic regression Continuous ordinal with more than 4 categories, interval, ratio normal ANOVA, regression, correlation, t-tests Classifying the independent and the dependent variable as continuous or discrete will determine the type of analyses that are likely to be appropriate in a given situation. Dependent Variable Discrete Continuous Independent variable Discrete (binary and categorical) Chi-square Logistic Regression Phi Cramer's V t-test ANOVA Regression Point-biserial Correlation Continuous Logistic Regression Point-biserial Correlation Regression Correlation Controversies and Common Practice There is a longstanding debate about how to classify measurements and whether levels of measurement can be a successful guide to the choice of data analysis type (e.g., Borgatta & Bohrnstedt, 1980; Michell, 1986; Townsend & Ashby, 1984; see Hayes & Embretson, 2012; Scholten & Borsboom, 2009 for recent discussions of the controversy). 3 In my view, there are two relevant issues that should 1 Mathematicians will define discrete variables more generally in a way that will include many if not most of the variables that social scientists view as “continuous” in common practice. For example, Hays (1994) gives “If a random variable can assume only a particular finite or a countably infinite set of values, it is said to be a discrete random variable.” (p. 98) 2 As we will discover later, the Pearson chi-square test really uses a normal distribution as an approximation, but the binomial (or multinomial) distribution is central to most statistics used with categorical dependent variables. I have placed chi-square with the binomial theory class of statistics, therefore, because the normal distribution is really just used as an efficient substitute for the binomial distribution. 3 My intention is not to try to resolve the debate, but to offer a general simple heuristic as a starting place for deciding which type of analysis is used in common practice in the social sciences for general types of dependent variables. In reality, there are a number of other factors that
  • 2. Newsom Psy 521/621 Univariate Quantitative Methods, Fall 2020 2 be distinguished from one another. The first issue is a more philosophical concern about whether psychological (or other social) phenomena can be reliably and validly represented by numeric ordinal data. I happen to believe that there is a wealth of psychometric research that has already established this to be the case (e.g., Bendig, 1954; Symonds, 1924; Matell & Jacoby, 1971), but I will leave this controversy to those more qualified to consider deep epistemological dilemmas (which are, frankly, often over my head). The second issue is more of an empirical or statistical question about whether scales, such as Likert-type scales, with some sufficient number of several ordinal response options will provide accurate results when normal distribution statistical tests (e.g., t-tests, ANOVA, OLS regression) are used. There seems to be fairly good evidence from simulation studies that suggests that if there are 5 or more ordered categories there is relatively little harm in treating these ordinal variables as continuous (e.g., Johnson & Creech, 1983; Muthén & Kaplan, 1985; Zumbo & Zimmerman, 1993; Taylor, West, & Aiken, 2006). There appears to be added benefit to additional ordinal values up to some point (at least to 7- or 9-point scales). Note that this distinction applies to the dependent variable used in the analysis to the response categories used in a survey whenever multiple items are combined (e.g., by computing the mean or sum)—a composite measure that will have many values and will usually be considered continuous. There are other concerns that are important, such as the distribution of the variable. Normal distribution statistics, such as OLS regression and ANOVA, are remarkably robust to small or moderate departures from normality if sample sizes are even moderate (e.g., N = 20-40; Myers, Well, & Lorch, 2010; Stonehouse & Forrester, 1998), more substantial departures can usually be addressed with robust approaches (e.g., robust standard errors in regression or structural modeling, bootstrap estimates). When sample sizes are small and distributions are highly nonnormal, nonparametric tests (e.g., Mann- Whitney U test, Kruskal-Wallis ANOVA) may be optimal (see Sheskin, 2011, for an extensive list). Ordinal Analyses The contrast between discrete and continuous variables is an oversimplification. There really is a big gray area when there are 3 or 4 ordinal categories. Although in practice, most researchers only tend to use binomial and normal theory statistics, there is another class of statistical tests specifically designed for ordinal scales that are becoming increasingly available in software packages. There are several excellent references for ordinal statistical tests (Agresti, 1984, 2002; Cliff, 1996; Wickens, 1989). For regression models, Long’s (1997) book is a very good, although technical, treatment. There is likely to be some statistical power advantage to using ordinal statistics over binomial statistics, and there is likely to be some accuracy gained in the statistical tests for using ordinal statistics over normal theory statistics when there are few categories or for certain other data conditions. Problems with Crude Categorization and Artificial Dichotomization One needs to be careful about converting continuous variables into dichotomous or categorical variables. One example is the practice of doing a “median split,” which puts those with scores above and below the median into two categories, but other methods of artificial categorization can be just as problematic. Generally, a great deal of useful information is discarded, but other statistical issues arise. Although many papers have been published as far back as the 1940s on this topic, the practice of dichotomizing continuous variables is still quite prevalent. A paper by MacCullum, Zhang, Preacher, and Rucker (2002) is a superb overview of the problems and potentially serious consequences of this practice. DeCoster and colleagues (2009) discuss a few of the exceptions in which fewer crude categories may be useful. The same concerns apply, of course, to what measures we choose to employ for measuring underlying variables that are truly continuous. References and Further Readings Agresti, A. (1984). Analysis of ordinal categorical data. NY: Wiley. Agresti, A. (2002.) Categorical Data Analysis, second edition. NY: Wiley. must be considered in deciding on the most appropriate and statistically accurate analysis, including the distribution of the dependent variable, whether it is count data, and sample size among others. Think about the system I propose here as a kind of analysis triage or grand organizational scheme and trust that I will cover some of the caveats and other special considerations as we go along.
  • 3. Newsom Psy 521/621 Univariate Quantitative Methods, Fall 2020 3 Bendig, A. W. (1954). Reliability and the number of rating scale categories. The Journal of Applied Psychology, 38, 38±40. Borgatta, E.F., and Bohrnstedt, G.W. (1980). Level of measurement - Once over again. Sociological Methods and Research, 9, 147-160. Cliff, N. (1996). Ordinal methods for behavioral data analysis. Mahwah, NJ: Erbaum. DeCoster, J., Iselin, A. M. R., & Gallucci, M. (2009). A conceptual and empirical examination of justifications for dichotomization. Psychological methods, 14(4), 349-366. Hayes, H., & Embretson, S.E. Psychological measurement: Scaling and analysis. In H. Cooper; P.M. Camic, D.L. Long, A.T. Panter, and D. Rindskopf (Eds). APA handbook of research methods in psychology, Vol 1: Foundations, planning, measures, and psychometrics (pp. 163- 179) Washington, DC: American Psychological Association. Hays, W.L. (1994). Statistics, Fifth Edition. Belmont, CA: Wadsworth. Johnson, D.R., & Creech, J.C. (1983) Ordinal measures in multiple indicator models: A simulation study of categorization error. American Sociological Review, 48, 398-407. Long, J.S. (1997). Regression models for categorical and limited dependent variables. Thousand Oaks, CA: Sage. MacCallum, R.X., Zhang, S., Preacher, K.J., & Rucker, D.D. (2002). On the practice of dichotomization of quantitative variables. Psychological Methods, 7, 1-40. Matell, M. S., & Jacoby, J. (1971). Is there an optimal number of alternatives for Likert scale items? Study. Educational and psychological measurement, 31, 657-674. Michell, J. (1986). Measurement scales and statistics: A clash of paradigms. Psychological Bulletin, 100, 398_407. Muthén, B., & Kaplan, D. (1985). A comparison of some methodologies for the factor analysis of non‐normal Likert variables. British Journal of Mathematical and Statistical Psychology, 38(2), 171-189. Myers, J. L., Well, A., & Lorch, R. F. (2010). Research design and statistical analysis. New York: Routledge. Scholten, A. Z., & Borsboom, D. (2009). A reanalysis of Lord’s statistical treatment of football numbers. Journal of Mathematical Psychology, 53(2), 69-75. Sheskin, D. J. (2011). Handbook of parametric and nonparametric statistical procedures, fifth edition. Raleigh, NC: Chapman & Hall/CRC Press. Stevens, S.S. (1946). On the theory of scales of measurement. Science, 103, 677-680. Stonehouse, J. M., & Forrester, G. J. (1998). Robustness of the t and U tests under combined assumption violations. Journal of Applied Statistics, 25, 63-74. Symonds, P. M. (1924). On the loss of reliability in ratings due to coarseness of the scale. Journal of Experimental Psychology, 7, 456-461. Taylor, A. B., West, S. G., & Aiken, L. S. (2006). Loss of power in logistic, ordinal logistic, and probit regression when an outcome variable is coarsely categorized. Educational and psychological measurement, 66(2), 228-239. Townsend, J. T. and Ashby, F. G. (1984), Measurement Scales and Statistics: The Misconception Misconceived, Psychological Bulletin, 96, pp. 394-401. Wickens, T.D. (1989). Multiway contingency tables analysis for the social sciences. Hillsdale, NJ: Erlbaum. Zumbo, B.D., & Zimmerman, D.W. (1993). Is the selection of statistical methods governed by level of measurement? Canadian Psychology, 34, 390-400.