SlideShare a Scribd company logo
Clinical Trials
Lessons Learned From a Direct Data Entry
Phase 2 Clinical Trial Under a US
Investigational New Drug Application
Jules T. Mitchel, MBA, PhD1
, Judith M. Schloss Markowitz, MS1
, Hua (Helen) Yin, MS1
,
Dean Gittleman, MS1
, Timothy Cho, BS1
, Yong Joong Kim, MS1
, Joonhyuk Choi, BS1
,
Mitchell D. Efros, MD, FACS2
, Kerri Weingard, ANP, MS, BSN, RN2
,
Vadim Tantsyura, MS, MA3
, and Dario Carrara, PhD4
Abstract
In order to assess the impact of direct data entry (DDE) on the clinical trial process, a single-site, phase 2 clinical trial, under a US
investigational new drug application (IND), was performed where the clinical site entered each subject’s data into an electronic
data capture (EDC) system at the time of the office visit and the clinical research team implemented a risk-based monitoring
(RBM) plan. For DDE, the trial used EDC for data collection and the electronic clinical trial record (eCTR) as the subject’s elec-
tronic source (eSource) record. A clinical data monitoring plan (CDMoP) defined the scope of source document verification, the
frequency and scope of online data review, and the criteria for when to perform onsite monitoring. As a result of this novel
approach to clinical research operations, (1) there were no protocol violations as screening errors were picked up prior to treat-
ment; (2) because there were minimal transcription errors from paper source records to the EDC system, there was a major
reduction in onsite monitoring compared to comparable studies that use paper source records; (3) EDC edit checks were able
to be modified early in the course of the clinical trial; (4) compliance issues were identified in real time and corrected; (5) there
was rapid transparency and detection of safety issues; and (6) the clinical site indicated that there were major cost savings overall
and estimated that just in terms of data entry, it was able to save 70 hours of labor by not using paper as the original source
records. It is postulated that once the pharmaceutical industry adopts DDE and RBM, there will be major increases in productivity
for sponsors, clinical sites, and CROs, as well as reduced time to database lock and the statistical analyses. In addition to the pro-
ductivity increases, these processes and tools will improve data integrity and quality and potentially reduce overall monitoring
resources and efforts by an estimated 50% to 60%.
Keywords
direct data entry, EDC, data management, risk-based monitoring
Introduction
In order to encourage the use of direct data entry (DDE), in
2006, the Clinical Data Interchange Standards Consortium
(CDISC) Electronic Source Data Interchange Working Group
addressed the leveraging of the CDISC standards when elec-
tronic source data are used within clinical trials.1
In 2007, FDA
acknowledged that original data can be ‘‘recorded by direct
entry into a computerized system.’’2
In 2010, both FDA and
EMA discussed the advantages of DDE and proposed guidance
to the pharmaceutical industry on what issues to address when
moving from paper to electronic (eSource) records.3,4
In 2011,
EMA and FDA issued draft guidances on risk-based monitor-
ing of clinical trials.5,6
These latter documents were, in part, the
result of work by the Clinical Trials Transformation Initiative,
a public–private partnership formally established in 2008 by
the FDA and Duke University to identify practices that,
through broad adoption, will increase the quality and efficiency
1
Target Health Inc, New York, NY, USA
2
AccuMed Research, Garden City, NY, USA
3
NECDQ Consulting, Danbury, CT, USA
4
Ferring Galeschines Labor AG, Basel, Switzerland
Submitted 28-Feb-2012; accepted 24-Apr-2012.
Corresponding Author:
Jules T. Mitchel, Target Health Inc, 261 Madison Avenue, New York, NY 10016,
USA (email: jmitchel@targethealth.com)
Drug Information Journal
46(4) 464-471
ª The Author(s) 2012
Reprints and permission:
sagepub.com/journalsPermissions.nav
DOI: 10.1177/0092861512449530
http://dij.sagepub.com
of clinical trials.7
Clearly, the roles of clinical research associ-
ates (CRAs)8
and data managers9
have changed in the world of
electronic data capture (EDC). In addition, there is now a
movement toward rational approaches to the conduct and mon-
itoring of clinical trials based on a shift to risk-based monitor-
ing (RBM),10
quality-by-design methods,11
and DDE.12
Methods
A US investigational new drug application (IND), with a com-
prehensive protocol section addressing DDE and RBM, was
cleared by FDA in 2011. The clinical trial was a phase 2 study
performed at a single site and was designed to evaluate the
pharmacokinetics of a topically applied drug product in a
patient population. The clinical research site was based at an
established urology practice located in the New York metropol-
itan area. The site had experience with EDC systems but had
never worked directly with Target Health Incorporated. Target
Health monitored the clinical site, managed the study budget,
performed data management, analyzed the study results, and
wrote the clinical study report. Except for the site’s experience
in clinical research and willingness to participate in the study
and provide active feedback, there were no unique characteris-
tics of the clinical site that would undermine extrapolation of
the current results to the wider clinical research community.
The sponsor agreed that for the clinical program, in lieu of
requiring the clinical site to first enter source data on a piece
of paper and then transcribe the data into an EDC system, the
site would perform DDE of subject data into the EDC system
during the office visit, similar to what is done when electronic
medical records (EMRs) are used. Prior to submitting the pro-
tocol to the IND, discussions were held with the FDA to ensure
that the approach to DDE would comply with 21 Code of Fed-
eral Regulations part 11 rules and regulations. In addition, to
ensure compliance with CDISC, EMA, and FDA requirements
that the site have sole control and continuous access to the elec-
tronic source (eSource) record, an electronic clinical trial record
(eCTR) was created before the data were transmitted to the EDC
database. For the eCTR, a transaction rule was configured such
that at the time of data entry, a Web-based pdf file was created
that was transferred electronically to a read-only eCTR Viewer,
which acted as a ‘‘trusted third party’’ environment. Only when
this transaction was electronically confirmed were the data then
transmitted to the EDC database. The clinical site had control of
user access to the eCTR Viewer, and the system maintained an
audit trail of all changes to the eSource records. At any point dur-
ing the study the clinical site could generate a bookmarked pdf
copy of individual electronic case report forms (eCRFs) or the
eCRFs for all subjects.
In addition to using an eSource method, the clinical data mon-
itoring plan (CDMoP) allowed for centralized monitoring as
well as risk-based monitoring of certain data that were collected
initially using paper records (eg, 2 questionnaires and paper
printouts from the site’s EMR). Finally, a decision log (of the
issues that arose during the study and their resolution) was main-
tained in Excel, and an online monitoring report, fully integrated
with the EDC system, maintained an online electronic Issues and
Resolution Log associated with central and onsite monitoring.
In order to perform risk-based monitoring, online reports
were created to track the following:
1. Key inclusion and exclusion criteria
2. Data entry status
3. CRA review status of the eCRF forms
4. Edit checks that fired for each form and specific variables
5. Time for query resolution
6. Medications
7. Adverse events
In addition, the EDC system supported the following:
1. Online qualification, initiation, interim, and closeout visit
reports, all with eSignatures
2. Online MedWatch Form 3500a and the Council for Interna-
tional Organizations of Medical Sciences (CIOMS) forms
3. Coding of adverse events, medications, and medical
history
To maintain data confidentiality, certain identifiers and results
have been masked.
Results
Study Timelines
At the time of site qualification, the site staff were asked
whether they were willing to participate in the clinical trial and
to be part of an innovative program in DDE. They immediately
agreed. After institutional review board (IRB) approval was
obtained, screening of study subjects was completed in 14 days,
treatment in 44 days, and database lock within 19 days of the
last patient’s last visit (Table 1).
Table 1. Study timelines.
Task Day
Clinical site qualified 0
Institutional review board approval 7
Clinical trial initiated 18
Screening of 42 study subjects initiated 24
Treatment begins with 20 subjects 38
Last patient last visit 82
Soft lock of individual completed subjects 94
Signing by investigator of eCRFs 95
Database lock 101
Mitchel et al 465
Source Document Verification
The CDMoP noted that since the study was primarily using
DDE, the following paper source records, if available, were
to be reviewed against the eCRF record:
1. Demographic data derived from the site’s EMRs
2. Medical history
3. Patient-reported outcome (PRO) forms
At each onsite monitoring visit, the monitor was to determine
whether any additional paper source records existed. In terms of
monitoring, the CDMoP required that the CRA do the following:
1. Be present at the first patient visit that involved blood sam-
pling and processing.
2. Request EDC changes immediately to refine the edit
checks to allow for better data flow, as needed.
3. Perform a daily review of all entered eCRF data.
4. Review online reports daily.
5. Review all new central laboratory data.
6. Review eCRF data entry procedures with the clinical site,
as needed.
Nosourcedocumentverification(SDV) wasperformedremotely.
The results of onsite SDV are presented in Table 2. Only 1 tran-
scription error was found in over 200 reviewed records. Once this
observation was made, it was decided that there was no reason to
perform additional onsite SDV as there was no identified risk
based on the observed incidence of transcription errors.
Visit Schedule
In order to assist the clinical site to ensure subject compli-
ance with the planned study visits, once the initial treatment
was scheduled, the EDC system automatically created a
study schedule that could be provided to each subject
(Table 3). The site coordinator was also able to use the visit
schedule to quickly assess compliance with the treatment
schedule.
Table 2. Onsite source document verification.
Subject Data Verified
% Verified for
Treated Subjects
% Verified for
Screen Failures Observations
Patient’s identity consistent in source
documents and eCRFs (ie, demographic
data consistent, including age, race, and date
of birth
100% 100% No transcription errors
Informed consent signed prior to subject’s
participation in the trial
100% 100% No transcription errors
Medical history 20% N/A No errors
Blood draw times vs paper source 100% for 2 periods N/A One minor transcription error as a
result of reviewing 160 data fields
Table 3. Visit schedule.
Visit No. Expected Date Actual Date
Signed
Informed Consent
02 Jun 2011
Thursday
Screening
(Day –14 - Day 0)
02 Jun 2011
Thursday
Visit 2 (Day 1) 02 Jun 11 Thursday - 16 Jun 11 Thursday
06 Jun 2011
Monday
Visit 3 (Day 2) 07 Jun 2011 Tuesday - 09 Jun 2011 Thursday
07 Jun 2011
Tuesday
Visit 4 (Day 7) 10 Jun 2011 Friday - 14 Jun 2011 Tuesday
13 Jun 2011
Monday
466 Drug Information Journal 46(4)
Real-Time Monitoring of eCRF Data
The EDC system tracked the date and time of data entry as well
as the date and time of eCRF review by the CRA. To evaluate
time to initial data review, the Registration, Demographics,
Medical History, Visit Date, Vital Signs, and Clinical Summary
forms were selected as performance indicators (Table 4).
Table 4 summarizes the time from data entry to initial data
review by the CRA for 6 representative forms. The median
time to initial review for Clinical Summary form was the short-
est (18 minutes) and Vital Signs form the longest (7 hours and 1
minute). One issue detected was the absence of a backup plan
during an annual vacation by one of the CRAs. Once remedied,
form review generally occurred within minutes or 1 to 2 hours
of data entry. Figure 1 illustrates the time in hours from data
entry to initial data review by the CRA combining the 6 repre-
sentative forms. The majority of forms were reviewed within 1
business day, and approximately 75% of forms were reviewed
within 1 business day.
Data Entry Status
In order to support risk-based monitoring, a series of reports
were configured to evaluate critical metrics that in themselves
were able to provide operational signals. Table 5 provides a
real-time snapshot of the status of subject enrollment as well
as the status of the reviewed forms. Once the top-line review
was made, it was possible to drill down to the data entry status
of individual subjects.
Navigation
In order for the CRA to quickly review the data entry status for
a given subject, a color-coded navigation report was config-
ured. In Table 6, except for the screening data, no other data are
entered for subject 04, who was a screen failure. In contrast,
all forms were entered and reviewed for subjects 22 and 23 for
visits 2, 3, and 4.
When the site or CRA viewed the data for individual
subjects, a form navigation module (see Table 7) was available.
Table 4. Time to initial review of data entry forms (h:min).
Registration Demographics Medical History Visit Date Vital Signs Clinical Summary
(n ¼ 42) (n ¼ 42) (n ¼ 142) (n ¼ 83) (n ¼ 120) (n ¼ 20)
Maximum 51:53 75:14 446:31 109:04 147:08 24:06
75th percentile 03:42 03:19 22:25 07:20 08:34 00:46
Median 01:39 01:15 02:25 01:59 07:01 00:18
25th percentile 00:23 01:15 00:43 00:20 02:15 00:07
Minimum 00:01 00:01 00:01 00:01 00:07 00:03
1
5
10
25
50
75
90
95
99 100
0
20
40
60
80
100
120
0.02 0.07 0.13 0.6 2.4 7.7 32.3 91.5 243.8 446.5
Cumulative%
Time to Initial Review (hours)
Figure 1. Time to CRF review during centralized monitoring.
Table 5. Example of the status of data entry.
# of
Subjects
Entered
# of
Screen
Failures
# of
Subjects
Treated
# of
Pages
Entered
# of
Pages
Reviewed
# of
Subjects
Locked
# of
Subjects
Signed
35 5 30 4562 4562 35 35
)elpmaxe(nwodkaerBstcejbuS
14 105 105 YES YES
23 193 193 YES YES
Mitchel et al 467
Table 6. Data entry status by visit.
Subject No. Screening (Day –14 - Day 0) Visit 2 (Day 1) Visit 3 (Day 2) Visit 4 (Day 7)
04 19 May 2011
22 19 May 2011 06 Jun 2011 07 Jun 2011 13 Jun 2011
23 19 May 2011 06 Jun 2011 07 Jun 2011 13 Jun 2011
Table 7. Data entry status by form.
Subject 07
Screening Visit Date Demographics Medical History
Visit 2 (Day 1) Visit Date Eligibility Vital Signs
Visit 4 (Day 7) Vital Signs Blood Sampling Drug Administration
Visit 5 (Day 22) Visit Date Pre-Dose Vital Signs Blood Sampling
End Of Trial End Of Trial
AE Adverse Event
Medications Medications
Table 8. Query frequency by form report.
Form
Pending
Monitor Reply
Pending
Site Reply
Resolved Total
Adverse Event 0 0 2 2
Concomitant Medication 4 8 18 30
Demographics 0 0 3 3
Medical History 5 5 0 10
Sample Collection 8 12 12 32
Physical Examination 0 0 4 4
Table 9. Query frequency by edit check.
Edit ID
Pending
Monitor Reply
Pending
Site Reply
Resolved Total
Med-10 6 8 1 15
AE-15 0 0 1 1
Drug-18 0 0 7 7
Lab-08 0 0 1 1
Skin-10 3 9 0 12
Demog-06 0 0 20 20
Visit-007 10 2 8 20
Vitals-010 0 0 1 1
468 Drug Information Journal 46(4)
This color-coded module allowed the clinical research team to
see which forms had been reviewed using the following color
codes: (1) not been entered (green); (2) have data (blue); (3)
have been reviewed (gold); and (4) have been reviewed and
locked by the data manager role (red).
Edit Checks
A total of 261 edit checks were fired and a total of 360 queries
were issued for the 3948 eCRF pages that were entered. Table 8
illustrates an example of a midstudy report of the number of
queries generated by form and the status of their review. The
frequency of queries per form was a good indicator of the status
of data quality, how well the clinical study site understood the
protocol, and possible design issues of the EDC system.
In order to better understand the causes of queries and fired
edits checks, an online report was configured to assess the
status of edit checks by variable (Table 9). By evaluating the
outcomes of this table, the clinical research team could focus
on specific data quality issues.
Data Review
While the metrics described here were very useful to evaluate
operational signals, looking at data over time is also very use-
ful. It is especially valuable when outcomes appear to differ
between sites or when a sponsor needs a comfort level that sub-
jects are responding to treatment. In Table 10, the CRA and
clinical team were able to assess a critical PRO between screen-
ing and the end of the study and to see that a positive outcome
was occurring within the trial.
Online Monitoring Reports
The online monitoring report function allowed the CRAs and
project managers to manage site monitoring totally within the
EDC system, as demonstrated in Table 11. There was no need
to mechanically copy and paste information already captured in
the EDC system. Table 11 illustrates part of the monitoring report
where the status of the study subjects is obtained directly from the
EDC system and the CRA entered responses to online prompts.
There were 57 items tracked within the online monitoring
reports that required follow-up. This online tool allowed both
the CRA and project manager to track the status of all outstand-
ing items. Table 12 illustrates some of the findings and resolu-
tions. By doing real-time data review and logging findings
within the monitoring reports, the CRA was able to identify
potential protocol violations during the screening period and
immediately inform the site about these potential violations.
eCTR Deliverable
During the study, the clinical sited was able create a book-
marked pdf copy of the eCTR of each individual study subject
Table 10. Change in a patient-reported outcome (PRO).
PID
Total PRO Score
Difference
Screening Visit 12
01 53 35 –18
02 30 35 5
03 28 30 2
04 34 28 –6
05 34 37 3
06 53 45 –8
07 38 39 1
08 35 32 –3
09 47 46 –1
Table 11. Online monitoring report.
Study Status and Subject Enrollment Yes No N/A Comment
?yrotcafsitasssergorpydutsdnatnemllornesI
Is the subject enrollment log current and accurate? Enrollment Log not being used
13CIdengisohwstcejbuSforebmuN
Derived From EDC Database
1eruliaFneercS
0detaerTstcejbuSforebmuN
03stcejbuSevitcAforebmuN
0detelpmoCstcejbuSforebmuN
Mitchel et al 469
or all study subjects. At the end of the study after database
lock, the sponsor provided an electronic copy of each sub-
ject’s eCTR to the study site, as well as maintained the eCTR
‘‘live.’’
Cost Savings
Under normal monitoring guidelines and with full SDV, it was
anticipated that the CRA would have had to spend 4 full days at
the clinical site plus travel time and preparation. In reality,
there was only 1 full-day monitoring visit at the time of the ini-
tial treatment phase and a 2-hour monitoring visit during the
course of the study. Thus, even if there were 2 full days of mon-
itoring for this study when using DDE, at an average cost of
US$3000 per monitoring visit, there would have been a cost
savings of US$6000 (2 visits) for the monitoring phase of this
single-center study.
Discussion and Conclusions
The Tufts Center for the Study of Drug Development recently
published the first global benchmark for CRA workload and
utilization indicating that CRAs worldwide spent approxi-
mately 20% of their time traveling and devoted only 41% of
their time at clinical trial sites.13
In addition, the study found
that CRA workload and time allocation vary widely by geo-
graphic region, with US-based study monitors spending more
time traveling and on site than their counterparts elsewhere.
European study monitors spend relatively more time perform-
ing off-site monitoring and administrative tasks.
Clearly, implementation of DDE, real-time monitoring at
the time of data entry, and risk-based monitoring will have pos-
itive effects on the clinical monitoring and data management
functions within the pharmaceutical and medical device indus-
tries. One of the biggest effects will be associated with the abil-
ity to see and evaluate data as they are being entered rather than
waiting days or weeks compared with the paper process. Since
transcription errors from paper records to an EDC system are
virtually eliminated,14
the clinical team can now have a com-
fort level that what is being observed in real time in the EDC
system is an accurate representation of the study subject’s data.
In addition, once the data are entered and monitored, often
within minutes of the office visit, the site can be queried imme-
diately. As a result, there is a good chance that the query will
be answered with data fresh in the mind of the study coordi-
nator. As a result, when the study subject leaves the office,
there is virtually nothing to do until the following office visit.
While the current report describes a single investigator
study, a multicenter study with 6 clinical sites designed to treat
Table 12. Online monitoring report—follow-up list.
Date Issue Follow-up Action
Date of
Resolution
27 May
2011
Patient 30 has RA.
Called the site and indicated to
the coordinator that since the
patient has RA, he is a screen
failure.
31 May
2011
26 May
2011
Study coordinator called regarding an
obese subject who had sleep apnea. He
had lost weight and no more apnea
anymore. Is this patient eligible?
Answer was no, as exclusion
criteria is history of sleep
apnea.
31 May
2011
26 May
2011
Patient 222 has a history of MS. Emailed site to SF patient.
13 Jun
2011
06 Jul
2011
Requested from Support that the
deviation from vital sign report be
removed.
Done
13 Jul
2011
06 Jul
2011
Medical History Page was incorrect.
Emailed Support to fix.
Fixed
13 Jul
2011
07 Jul
2011
The subject is scheduled for a Saturday
with blood draws.
Discussed with UUU from LAB.
Bloods will be picked up on
Saturday and LAB will analyze
them Sunday.
10 Jul
2011
08 Jul
2011
Confirmed with the study coordinator at
site that they have all the information
necessary for the samples
Confirmed
14 Jul
2011
470 Drug Information Journal 46(4)
120 patients over 6 months is ongoing. The study is being man-
aged with just 1 CRA, the investigators and coordinators have
transitioned to DDE in a seamless manner, and there have been
no unexpected issues relating to DDE. In addition, a phase 3
study with 200 subjects is planned for Q3 2012 with 20 sites
with extensive training planned at the Investigator meeting to
address EDC, DDE, eCTR and the eTrial Master File.
It can be concluded that once the pharmaceutical industry
broadly adopts DDE and risk-based monitoring, the following
will result:
1. Significant increases in productivity for both the sponsors,
clinical sites, and contract research organizations (CROs)
as travel time and SDV will be reduced
2. Significant reductions in overall monitoring costs, as
onsite monitoring visits could possibly be scaled back by
50% to 60%
3. Earlier detection and analyses of adverse events resulting
in enhanced patient safety
Acknowledgments
The authors thank Joyce Hays, MS, CEO of Target Health Inc, for
reviewing the manuscript. For this publication, Target Health Incor-
porated’s e*CRF1
was used for EDC and Target’s e*CRF1
Viewer
was used to access the eSource records.
Declaration of Conflicting Interests
The author(s) declared no potential conflicts of interest with respect to
the research, authorship, and/or publication of this article.
Funding
The author(s) received no financial support for the research, authorship,
and/or publication of this article.
References
1. Clinical Data Interchange Standards Consortium. Leveraging the
CDISC Standards to Facilitate the use of Electronic Source Data
within Clinical Trials Clinical Data Interchange Standards Con-
sortium. http://www.cdisc.org/stuff/contentmgr/files/0/2f6eca8f0
df7caac5bbd4fadfd76d575/miscdocs/esdi.pdf. Published Novem-
ber 2006.
2. FDA. Guidance for industry, computerized systems used in
clinical investigations; US Department of Health and Human Ser-
vices. http://www.fda.gov/OHRMS/DOCKETS/98fr/04d-0440-
gdl0002.pdf. Published May 2007.
3. FDA. Guidance for industry electronic source documentation in
clinical investigations. http://www.fda.gov/downloads/Drugs/
GuidanceComplianceRegulatoryInformation/Guidances/UCM239
052.pdf. Published December 2010.
4. EMA. Reflection paper on expectations for electronic source data
and data transcribed to electronic data collection tools in clinical
trials (EMA/INS/GCP/454280/2010). http://www.phtcorp.com/pdf/
EMAReflectionPaper.pdf. Published June 2010.
5. FDA. Guidance for industry oversight of clinical investigations—
a risk-based approach to monitoring [draft]. http://www.fda.gov/
downloads/Drugs/GuidanceComplianceRegulatoryInformation/
Guidances/UCM269919.pdf. Published August 2011.
6. EMA. Reflection paper on risk based quality management in clin-
ical trials (EMA/INS/GCP/394194/2011). http://www.ema.europa.
eu/docs/en_GB/document_library/Scientific_guideline/2011/08/
WC500110059.pdf. Published August 2011.
7. Morrison B, Cochran C, Giangrandec J, et al. Monitoring the
quality of conduct of clinical trials: a survey of current practices.
Clin Trials. 2011;8:342-349.
8. Mitchel J, Jurewicz E, Flynn-Fuchs K, et al. The role of CRAs in
the development and implementation of Internet-based clinical
trial applications: new career opportunities. Monitor. October
2005:17-21.
9. Mitchel J, Kim YJ, Choi JH, et al. The impact of electronic data
capture (EDC) on clinical data management—perspectives from
the present into the Future. Monitor. August 2008:37-41.
10. Tantsyura V, Grimes I, Mitchel J. et al. Risk-based source data
verification approaches: pros and cons. Drug Information
Journal. 2010;44:745-756.
11. Ball L, Meeker-O’Connell A. Building quality into clinical trials.
Monitor. December 2011:11-16.
12. Mitchel J, Schloss-Markowitz J. Risk based monitoring time for
change. International Clinical Trials. February 2011:22-29.
13. Getz K. Study monitor workload high & varied with wide disparity
by global region. Tufts CSDD Impact Report. January/February
2012:1-4.
14. Mitchel J, Kim YJ, Choi JH, et al. Evaluation of data entry errors
and data changes to an electronic data capture (EDC) clinical trial
database. Information Journal. 2011;45:421-430.
Mitchel et al 471

More Related Content

What's hot

CDM_Process_Overview_Katalyst HLS
CDM_Process_Overview_Katalyst HLSCDM_Process_Overview_Katalyst HLS
CDM_Process_Overview_Katalyst HLS
Katalyst HLS
 
Clinical data-management-overview
Clinical data-management-overviewClinical data-management-overview
Clinical data-management-overview
Acri India
 
CLINICAL DATA MANGEMENT (CDM)
CLINICAL DATA MANGEMENT(CDM)CLINICAL DATA MANGEMENT(CDM)
CLINICAL DATA MANGEMENT (CDM)
ISF COLLEGE OF PHARMACY MOGA
 
Emerging Trends in Clinical Data Management
Emerging Trends in Clinical Data ManagementEmerging Trends in Clinical Data Management
Emerging Trends in Clinical Data Management
Arshad Mohammed
 
Protocol Understanding_Katalyst HLS
Protocol Understanding_Katalyst HLSProtocol Understanding_Katalyst HLS
Protocol Understanding_Katalyst HLS
Katalyst HLS
 
Data Management Plan_Katalyst HLS
Data Management Plan_Katalyst HLSData Management Plan_Katalyst HLS
Data Management Plan_Katalyst HLS
Katalyst HLS
 
clinical data management
clinical data managementclinical data management
clinical data management
sopi_1234
 
Study setup_Clinical Data Management_Katalyst HLS
Study setup_Clinical Data Management_Katalyst HLSStudy setup_Clinical Data Management_Katalyst HLS
Study setup_Clinical Data Management_Katalyst HLS
Katalyst HLS
 
FDA Electronic Health Record Data in Clinical Research
FDA Electronic Health Record Data in Clinical ResearchFDA Electronic Health Record Data in Clinical Research
FDA Electronic Health Record Data in Clinical Research
Target Health, Inc.
 
Who needs fast data? - Journal for Clinical Studies
Who needs fast data? - Journal for Clinical Studies Who needs fast data? - Journal for Clinical Studies
Who needs fast data? - Journal for Clinical Studies
KCR
 
Introduction to clinical data management
Introduction to clinical data managementIntroduction to clinical data management
Introduction to clinical data management
shrinu07
 
ICU Patient Deterioration Prediction : A Data-Mining Approach
ICU Patient Deterioration Prediction : A Data-Mining ApproachICU Patient Deterioration Prediction : A Data-Mining Approach
ICU Patient Deterioration Prediction : A Data-Mining Approach
csandit
 
Clinical Data Management
Clinical Data ManagementClinical Data Management
Clinical Data Management
Mahesh Koppula
 
Electronic Data Capture & Remote Data Capture
Electronic Data Capture & Remote  Data CaptureElectronic Data Capture & Remote  Data Capture
Electronic Data Capture & Remote Data Capture
CRB Tech
 
Clinical data management india as a hub
Clinical data management india as a hubClinical data management india as a hub
Clinical data management india as a hubBhaswat Chakraborty
 
Case report form and application
Case report  form  and  applicationCase report  form  and  application
Case report form and application
Irene Vadakkan
 
eSource: What You Need To Know
eSource: What You Need To KnoweSource: What You Need To Know
eSource: What You Need To Know
www.datatrak.com
 
Clinical data management and software packages final edc and rdc
Clinical data management and software packages final edc and rdcClinical data management and software packages final edc and rdc
Clinical data management and software packages final edc and rdc
Pristyn Research Solutions
 
How eSource Solutions are Impacting Clinical Research Sites, Patients, Regula...
How eSource Solutions are Impacting Clinical Research Sites, Patients, Regula...How eSource Solutions are Impacting Clinical Research Sites, Patients, Regula...
How eSource Solutions are Impacting Clinical Research Sites, Patients, Regula...
Target Health, Inc.
 

What's hot (19)

CDM_Process_Overview_Katalyst HLS
CDM_Process_Overview_Katalyst HLSCDM_Process_Overview_Katalyst HLS
CDM_Process_Overview_Katalyst HLS
 
Clinical data-management-overview
Clinical data-management-overviewClinical data-management-overview
Clinical data-management-overview
 
CLINICAL DATA MANGEMENT (CDM)
CLINICAL DATA MANGEMENT(CDM)CLINICAL DATA MANGEMENT(CDM)
CLINICAL DATA MANGEMENT (CDM)
 
Emerging Trends in Clinical Data Management
Emerging Trends in Clinical Data ManagementEmerging Trends in Clinical Data Management
Emerging Trends in Clinical Data Management
 
Protocol Understanding_Katalyst HLS
Protocol Understanding_Katalyst HLSProtocol Understanding_Katalyst HLS
Protocol Understanding_Katalyst HLS
 
Data Management Plan_Katalyst HLS
Data Management Plan_Katalyst HLSData Management Plan_Katalyst HLS
Data Management Plan_Katalyst HLS
 
clinical data management
clinical data managementclinical data management
clinical data management
 
Study setup_Clinical Data Management_Katalyst HLS
Study setup_Clinical Data Management_Katalyst HLSStudy setup_Clinical Data Management_Katalyst HLS
Study setup_Clinical Data Management_Katalyst HLS
 
FDA Electronic Health Record Data in Clinical Research
FDA Electronic Health Record Data in Clinical ResearchFDA Electronic Health Record Data in Clinical Research
FDA Electronic Health Record Data in Clinical Research
 
Who needs fast data? - Journal for Clinical Studies
Who needs fast data? - Journal for Clinical Studies Who needs fast data? - Journal for Clinical Studies
Who needs fast data? - Journal for Clinical Studies
 
Introduction to clinical data management
Introduction to clinical data managementIntroduction to clinical data management
Introduction to clinical data management
 
ICU Patient Deterioration Prediction : A Data-Mining Approach
ICU Patient Deterioration Prediction : A Data-Mining ApproachICU Patient Deterioration Prediction : A Data-Mining Approach
ICU Patient Deterioration Prediction : A Data-Mining Approach
 
Clinical Data Management
Clinical Data ManagementClinical Data Management
Clinical Data Management
 
Electronic Data Capture & Remote Data Capture
Electronic Data Capture & Remote  Data CaptureElectronic Data Capture & Remote  Data Capture
Electronic Data Capture & Remote Data Capture
 
Clinical data management india as a hub
Clinical data management india as a hubClinical data management india as a hub
Clinical data management india as a hub
 
Case report form and application
Case report  form  and  applicationCase report  form  and  application
Case report form and application
 
eSource: What You Need To Know
eSource: What You Need To KnoweSource: What You Need To Know
eSource: What You Need To Know
 
Clinical data management and software packages final edc and rdc
Clinical data management and software packages final edc and rdcClinical data management and software packages final edc and rdc
Clinical data management and software packages final edc and rdc
 
How eSource Solutions are Impacting Clinical Research Sites, Patients, Regula...
How eSource Solutions are Impacting Clinical Research Sites, Patients, Regula...How eSource Solutions are Impacting Clinical Research Sites, Patients, Regula...
How eSource Solutions are Impacting Clinical Research Sites, Patients, Regula...
 

Similar to Lessons Learned From a DDE Phase 2 CT, 2012

computers in clinical development
 computers in clinical development computers in clinical development
computers in clinical development
SUJITHA MARY
 
ecoa clinical trials.pdf
ecoa clinical trials.pdfecoa clinical trials.pdf
ecoa clinical trials.pdf
procth2
 
Streamlining Data Collection eCRF Design and Machine Learning
Streamlining Data Collection eCRF Design and Machine LearningStreamlining Data Collection eCRF Design and Machine Learning
Streamlining Data Collection eCRF Design and Machine Learning
ijtsrd
 
Challenges and Opportunities Around Integration of Clinical Trials Data
Challenges and Opportunities Around Integration of Clinical Trials DataChallenges and Opportunities Around Integration of Clinical Trials Data
Challenges and Opportunities Around Integration of Clinical Trials Data
CitiusTech
 
Retina Today (Nov-Dec 2014): The Clinical Data Management Process
Retina Today (Nov-Dec 2014): The Clinical Data Management ProcessRetina Today (Nov-Dec 2014): The Clinical Data Management Process
Retina Today (Nov-Dec 2014): The Clinical Data Management Process
Statistics & Data Corporation
 
Impact of Risk-Based Monitoring and eSource Methodologies on Clinical Sites, ...
Impact of Risk-Based Monitoring and eSource Methodologies on Clinical Sites, ...Impact of Risk-Based Monitoring and eSource Methodologies on Clinical Sites, ...
Impact of Risk-Based Monitoring and eSource Methodologies on Clinical Sites, ...
Target Health, Inc.
 
Revelatory Trends in Clinical Research and Data Management
Revelatory Trends in Clinical Research and Data ManagementRevelatory Trends in Clinical Research and Data Management
Revelatory Trends in Clinical Research and Data Management
Sagar Ghotekar
 
A Pharma/CRO Partnership in the Design and Execution of Paperless Clinical Tr...
A Pharma/CRO Partnership in the Design and Execution of Paperless Clinical Tr...A Pharma/CRO Partnership in the Design and Execution of Paperless Clinical Tr...
A Pharma/CRO Partnership in the Design and Execution of Paperless Clinical Tr...
Target Health, Inc.
 
Clinical Data Management
Clinical Data ManagementClinical Data Management
Clinical Data Management
DABBETA DIVYA
 
Database Designing in CDM
Database Designing in CDMDatabase Designing in CDM
Database Designing in CDM
ClinosolIndia
 
CDM.pptx
CDM.pptxCDM.pptx
CDM.pptx
SmarteeMalode
 
Research methodologies that result in data collecting from the patient medica...
Research methodologies that result in data collecting from the patient medica...Research methodologies that result in data collecting from the patient medica...
Research methodologies that result in data collecting from the patient medica...
Pubrica
 
Clinical data management
Clinical data managementClinical data management
Clinical data management
Ajay Murali
 
NS1450X - Computerized Systems in Clinical Research
NS1450X - Computerized Systems in Clinical ResearchNS1450X - Computerized Systems in Clinical Research
NS1450X - Computerized Systems in Clinical Research
Judson Chase
 
EXAMINING THE EFFECT OF FEATURE SELECTION ON IMPROVING PATIENT DETERIORATION ...
EXAMINING THE EFFECT OF FEATURE SELECTION ON IMPROVING PATIENT DETERIORATION ...EXAMINING THE EFFECT OF FEATURE SELECTION ON IMPROVING PATIENT DETERIORATION ...
EXAMINING THE EFFECT OF FEATURE SELECTION ON IMPROVING PATIENT DETERIORATION ...
IJDKP
 
Factors affecting validity of arterial blood gases results among critically i...
Factors affecting validity of arterial blood gases results among critically i...Factors affecting validity of arterial blood gases results among critically i...
Factors affecting validity of arterial blood gases results among critically i...
Alexander Decker
 
PREDICTIVE ANALYTICS IN HEALTHCARE SYSTEM USING DATA MINING TECHNIQUES
PREDICTIVE ANALYTICS IN HEALTHCARE SYSTEM USING DATA MINING TECHNIQUESPREDICTIVE ANALYTICS IN HEALTHCARE SYSTEM USING DATA MINING TECHNIQUES
PREDICTIVE ANALYTICS IN HEALTHCARE SYSTEM USING DATA MINING TECHNIQUES
cscpconf
 
citc-rwe-8dec2021_v2.pdf
citc-rwe-8dec2021_v2.pdfcitc-rwe-8dec2021_v2.pdf
citc-rwe-8dec2021_v2.pdf
ssuser660bb1
 
Professor Dipak Kalra Digital Health Assembly 2015
Professor Dipak Kalra Digital Health Assembly 2015Professor Dipak Kalra Digital Health Assembly 2015
Professor Dipak Kalra Digital Health Assembly 2015
DHA2015
 

Similar to Lessons Learned From a DDE Phase 2 CT, 2012 (20)

computers in clinical development
 computers in clinical development computers in clinical development
computers in clinical development
 
ecoa clinical trials.pdf
ecoa clinical trials.pdfecoa clinical trials.pdf
ecoa clinical trials.pdf
 
Streamlining Data Collection eCRF Design and Machine Learning
Streamlining Data Collection eCRF Design and Machine LearningStreamlining Data Collection eCRF Design and Machine Learning
Streamlining Data Collection eCRF Design and Machine Learning
 
Challenges and Opportunities Around Integration of Clinical Trials Data
Challenges and Opportunities Around Integration of Clinical Trials DataChallenges and Opportunities Around Integration of Clinical Trials Data
Challenges and Opportunities Around Integration of Clinical Trials Data
 
Retina Today (Nov-Dec 2014): The Clinical Data Management Process
Retina Today (Nov-Dec 2014): The Clinical Data Management ProcessRetina Today (Nov-Dec 2014): The Clinical Data Management Process
Retina Today (Nov-Dec 2014): The Clinical Data Management Process
 
Impact of Risk-Based Monitoring and eSource Methodologies on Clinical Sites, ...
Impact of Risk-Based Monitoring and eSource Methodologies on Clinical Sites, ...Impact of Risk-Based Monitoring and eSource Methodologies on Clinical Sites, ...
Impact of Risk-Based Monitoring and eSource Methodologies on Clinical Sites, ...
 
Revelatory Trends in Clinical Research and Data Management
Revelatory Trends in Clinical Research and Data ManagementRevelatory Trends in Clinical Research and Data Management
Revelatory Trends in Clinical Research and Data Management
 
A Pharma/CRO Partnership in the Design and Execution of Paperless Clinical Tr...
A Pharma/CRO Partnership in the Design and Execution of Paperless Clinical Tr...A Pharma/CRO Partnership in the Design and Execution of Paperless Clinical Tr...
A Pharma/CRO Partnership in the Design and Execution of Paperless Clinical Tr...
 
Delta GMP Data Integrity Sept2016
Delta GMP Data Integrity Sept2016Delta GMP Data Integrity Sept2016
Delta GMP Data Integrity Sept2016
 
Clinical Data Management
Clinical Data ManagementClinical Data Management
Clinical Data Management
 
Database Designing in CDM
Database Designing in CDMDatabase Designing in CDM
Database Designing in CDM
 
CDM.pptx
CDM.pptxCDM.pptx
CDM.pptx
 
Research methodologies that result in data collecting from the patient medica...
Research methodologies that result in data collecting from the patient medica...Research methodologies that result in data collecting from the patient medica...
Research methodologies that result in data collecting from the patient medica...
 
Clinical data management
Clinical data managementClinical data management
Clinical data management
 
NS1450X - Computerized Systems in Clinical Research
NS1450X - Computerized Systems in Clinical ResearchNS1450X - Computerized Systems in Clinical Research
NS1450X - Computerized Systems in Clinical Research
 
EXAMINING THE EFFECT OF FEATURE SELECTION ON IMPROVING PATIENT DETERIORATION ...
EXAMINING THE EFFECT OF FEATURE SELECTION ON IMPROVING PATIENT DETERIORATION ...EXAMINING THE EFFECT OF FEATURE SELECTION ON IMPROVING PATIENT DETERIORATION ...
EXAMINING THE EFFECT OF FEATURE SELECTION ON IMPROVING PATIENT DETERIORATION ...
 
Factors affecting validity of arterial blood gases results among critically i...
Factors affecting validity of arterial blood gases results among critically i...Factors affecting validity of arterial blood gases results among critically i...
Factors affecting validity of arterial blood gases results among critically i...
 
PREDICTIVE ANALYTICS IN HEALTHCARE SYSTEM USING DATA MINING TECHNIQUES
PREDICTIVE ANALYTICS IN HEALTHCARE SYSTEM USING DATA MINING TECHNIQUESPREDICTIVE ANALYTICS IN HEALTHCARE SYSTEM USING DATA MINING TECHNIQUES
PREDICTIVE ANALYTICS IN HEALTHCARE SYSTEM USING DATA MINING TECHNIQUES
 
citc-rwe-8dec2021_v2.pdf
citc-rwe-8dec2021_v2.pdfcitc-rwe-8dec2021_v2.pdf
citc-rwe-8dec2021_v2.pdf
 
Professor Dipak Kalra Digital Health Assembly 2015
Professor Dipak Kalra Digital Health Assembly 2015Professor Dipak Kalra Digital Health Assembly 2015
Professor Dipak Kalra Digital Health Assembly 2015
 

Lessons Learned From a DDE Phase 2 CT, 2012

  • 1. Clinical Trials Lessons Learned From a Direct Data Entry Phase 2 Clinical Trial Under a US Investigational New Drug Application Jules T. Mitchel, MBA, PhD1 , Judith M. Schloss Markowitz, MS1 , Hua (Helen) Yin, MS1 , Dean Gittleman, MS1 , Timothy Cho, BS1 , Yong Joong Kim, MS1 , Joonhyuk Choi, BS1 , Mitchell D. Efros, MD, FACS2 , Kerri Weingard, ANP, MS, BSN, RN2 , Vadim Tantsyura, MS, MA3 , and Dario Carrara, PhD4 Abstract In order to assess the impact of direct data entry (DDE) on the clinical trial process, a single-site, phase 2 clinical trial, under a US investigational new drug application (IND), was performed where the clinical site entered each subject’s data into an electronic data capture (EDC) system at the time of the office visit and the clinical research team implemented a risk-based monitoring (RBM) plan. For DDE, the trial used EDC for data collection and the electronic clinical trial record (eCTR) as the subject’s elec- tronic source (eSource) record. A clinical data monitoring plan (CDMoP) defined the scope of source document verification, the frequency and scope of online data review, and the criteria for when to perform onsite monitoring. As a result of this novel approach to clinical research operations, (1) there were no protocol violations as screening errors were picked up prior to treat- ment; (2) because there were minimal transcription errors from paper source records to the EDC system, there was a major reduction in onsite monitoring compared to comparable studies that use paper source records; (3) EDC edit checks were able to be modified early in the course of the clinical trial; (4) compliance issues were identified in real time and corrected; (5) there was rapid transparency and detection of safety issues; and (6) the clinical site indicated that there were major cost savings overall and estimated that just in terms of data entry, it was able to save 70 hours of labor by not using paper as the original source records. It is postulated that once the pharmaceutical industry adopts DDE and RBM, there will be major increases in productivity for sponsors, clinical sites, and CROs, as well as reduced time to database lock and the statistical analyses. In addition to the pro- ductivity increases, these processes and tools will improve data integrity and quality and potentially reduce overall monitoring resources and efforts by an estimated 50% to 60%. Keywords direct data entry, EDC, data management, risk-based monitoring Introduction In order to encourage the use of direct data entry (DDE), in 2006, the Clinical Data Interchange Standards Consortium (CDISC) Electronic Source Data Interchange Working Group addressed the leveraging of the CDISC standards when elec- tronic source data are used within clinical trials.1 In 2007, FDA acknowledged that original data can be ‘‘recorded by direct entry into a computerized system.’’2 In 2010, both FDA and EMA discussed the advantages of DDE and proposed guidance to the pharmaceutical industry on what issues to address when moving from paper to electronic (eSource) records.3,4 In 2011, EMA and FDA issued draft guidances on risk-based monitor- ing of clinical trials.5,6 These latter documents were, in part, the result of work by the Clinical Trials Transformation Initiative, a public–private partnership formally established in 2008 by the FDA and Duke University to identify practices that, through broad adoption, will increase the quality and efficiency 1 Target Health Inc, New York, NY, USA 2 AccuMed Research, Garden City, NY, USA 3 NECDQ Consulting, Danbury, CT, USA 4 Ferring Galeschines Labor AG, Basel, Switzerland Submitted 28-Feb-2012; accepted 24-Apr-2012. Corresponding Author: Jules T. Mitchel, Target Health Inc, 261 Madison Avenue, New York, NY 10016, USA (email: jmitchel@targethealth.com) Drug Information Journal 46(4) 464-471 ª The Author(s) 2012 Reprints and permission: sagepub.com/journalsPermissions.nav DOI: 10.1177/0092861512449530 http://dij.sagepub.com
  • 2. of clinical trials.7 Clearly, the roles of clinical research associ- ates (CRAs)8 and data managers9 have changed in the world of electronic data capture (EDC). In addition, there is now a movement toward rational approaches to the conduct and mon- itoring of clinical trials based on a shift to risk-based monitor- ing (RBM),10 quality-by-design methods,11 and DDE.12 Methods A US investigational new drug application (IND), with a com- prehensive protocol section addressing DDE and RBM, was cleared by FDA in 2011. The clinical trial was a phase 2 study performed at a single site and was designed to evaluate the pharmacokinetics of a topically applied drug product in a patient population. The clinical research site was based at an established urology practice located in the New York metropol- itan area. The site had experience with EDC systems but had never worked directly with Target Health Incorporated. Target Health monitored the clinical site, managed the study budget, performed data management, analyzed the study results, and wrote the clinical study report. Except for the site’s experience in clinical research and willingness to participate in the study and provide active feedback, there were no unique characteris- tics of the clinical site that would undermine extrapolation of the current results to the wider clinical research community. The sponsor agreed that for the clinical program, in lieu of requiring the clinical site to first enter source data on a piece of paper and then transcribe the data into an EDC system, the site would perform DDE of subject data into the EDC system during the office visit, similar to what is done when electronic medical records (EMRs) are used. Prior to submitting the pro- tocol to the IND, discussions were held with the FDA to ensure that the approach to DDE would comply with 21 Code of Fed- eral Regulations part 11 rules and regulations. In addition, to ensure compliance with CDISC, EMA, and FDA requirements that the site have sole control and continuous access to the elec- tronic source (eSource) record, an electronic clinical trial record (eCTR) was created before the data were transmitted to the EDC database. For the eCTR, a transaction rule was configured such that at the time of data entry, a Web-based pdf file was created that was transferred electronically to a read-only eCTR Viewer, which acted as a ‘‘trusted third party’’ environment. Only when this transaction was electronically confirmed were the data then transmitted to the EDC database. The clinical site had control of user access to the eCTR Viewer, and the system maintained an audit trail of all changes to the eSource records. At any point dur- ing the study the clinical site could generate a bookmarked pdf copy of individual electronic case report forms (eCRFs) or the eCRFs for all subjects. In addition to using an eSource method, the clinical data mon- itoring plan (CDMoP) allowed for centralized monitoring as well as risk-based monitoring of certain data that were collected initially using paper records (eg, 2 questionnaires and paper printouts from the site’s EMR). Finally, a decision log (of the issues that arose during the study and their resolution) was main- tained in Excel, and an online monitoring report, fully integrated with the EDC system, maintained an online electronic Issues and Resolution Log associated with central and onsite monitoring. In order to perform risk-based monitoring, online reports were created to track the following: 1. Key inclusion and exclusion criteria 2. Data entry status 3. CRA review status of the eCRF forms 4. Edit checks that fired for each form and specific variables 5. Time for query resolution 6. Medications 7. Adverse events In addition, the EDC system supported the following: 1. Online qualification, initiation, interim, and closeout visit reports, all with eSignatures 2. Online MedWatch Form 3500a and the Council for Interna- tional Organizations of Medical Sciences (CIOMS) forms 3. Coding of adverse events, medications, and medical history To maintain data confidentiality, certain identifiers and results have been masked. Results Study Timelines At the time of site qualification, the site staff were asked whether they were willing to participate in the clinical trial and to be part of an innovative program in DDE. They immediately agreed. After institutional review board (IRB) approval was obtained, screening of study subjects was completed in 14 days, treatment in 44 days, and database lock within 19 days of the last patient’s last visit (Table 1). Table 1. Study timelines. Task Day Clinical site qualified 0 Institutional review board approval 7 Clinical trial initiated 18 Screening of 42 study subjects initiated 24 Treatment begins with 20 subjects 38 Last patient last visit 82 Soft lock of individual completed subjects 94 Signing by investigator of eCRFs 95 Database lock 101 Mitchel et al 465
  • 3. Source Document Verification The CDMoP noted that since the study was primarily using DDE, the following paper source records, if available, were to be reviewed against the eCRF record: 1. Demographic data derived from the site’s EMRs 2. Medical history 3. Patient-reported outcome (PRO) forms At each onsite monitoring visit, the monitor was to determine whether any additional paper source records existed. In terms of monitoring, the CDMoP required that the CRA do the following: 1. Be present at the first patient visit that involved blood sam- pling and processing. 2. Request EDC changes immediately to refine the edit checks to allow for better data flow, as needed. 3. Perform a daily review of all entered eCRF data. 4. Review online reports daily. 5. Review all new central laboratory data. 6. Review eCRF data entry procedures with the clinical site, as needed. Nosourcedocumentverification(SDV) wasperformedremotely. The results of onsite SDV are presented in Table 2. Only 1 tran- scription error was found in over 200 reviewed records. Once this observation was made, it was decided that there was no reason to perform additional onsite SDV as there was no identified risk based on the observed incidence of transcription errors. Visit Schedule In order to assist the clinical site to ensure subject compli- ance with the planned study visits, once the initial treatment was scheduled, the EDC system automatically created a study schedule that could be provided to each subject (Table 3). The site coordinator was also able to use the visit schedule to quickly assess compliance with the treatment schedule. Table 2. Onsite source document verification. Subject Data Verified % Verified for Treated Subjects % Verified for Screen Failures Observations Patient’s identity consistent in source documents and eCRFs (ie, demographic data consistent, including age, race, and date of birth 100% 100% No transcription errors Informed consent signed prior to subject’s participation in the trial 100% 100% No transcription errors Medical history 20% N/A No errors Blood draw times vs paper source 100% for 2 periods N/A One minor transcription error as a result of reviewing 160 data fields Table 3. Visit schedule. Visit No. Expected Date Actual Date Signed Informed Consent 02 Jun 2011 Thursday Screening (Day –14 - Day 0) 02 Jun 2011 Thursday Visit 2 (Day 1) 02 Jun 11 Thursday - 16 Jun 11 Thursday 06 Jun 2011 Monday Visit 3 (Day 2) 07 Jun 2011 Tuesday - 09 Jun 2011 Thursday 07 Jun 2011 Tuesday Visit 4 (Day 7) 10 Jun 2011 Friday - 14 Jun 2011 Tuesday 13 Jun 2011 Monday 466 Drug Information Journal 46(4)
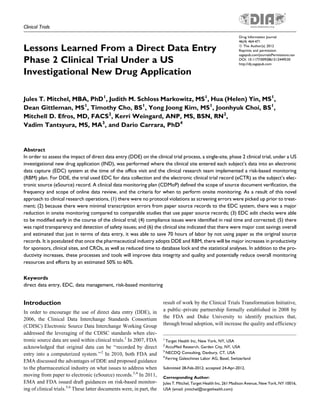
  • 4. Real-Time Monitoring of eCRF Data The EDC system tracked the date and time of data entry as well as the date and time of eCRF review by the CRA. To evaluate time to initial data review, the Registration, Demographics, Medical History, Visit Date, Vital Signs, and Clinical Summary forms were selected as performance indicators (Table 4). Table 4 summarizes the time from data entry to initial data review by the CRA for 6 representative forms. The median time to initial review for Clinical Summary form was the short- est (18 minutes) and Vital Signs form the longest (7 hours and 1 minute). One issue detected was the absence of a backup plan during an annual vacation by one of the CRAs. Once remedied, form review generally occurred within minutes or 1 to 2 hours of data entry. Figure 1 illustrates the time in hours from data entry to initial data review by the CRA combining the 6 repre- sentative forms. The majority of forms were reviewed within 1 business day, and approximately 75% of forms were reviewed within 1 business day. Data Entry Status In order to support risk-based monitoring, a series of reports were configured to evaluate critical metrics that in themselves were able to provide operational signals. Table 5 provides a real-time snapshot of the status of subject enrollment as well as the status of the reviewed forms. Once the top-line review was made, it was possible to drill down to the data entry status of individual subjects. Navigation In order for the CRA to quickly review the data entry status for a given subject, a color-coded navigation report was config- ured. In Table 6, except for the screening data, no other data are entered for subject 04, who was a screen failure. In contrast, all forms were entered and reviewed for subjects 22 and 23 for visits 2, 3, and 4. When the site or CRA viewed the data for individual subjects, a form navigation module (see Table 7) was available. Table 4. Time to initial review of data entry forms (h:min). Registration Demographics Medical History Visit Date Vital Signs Clinical Summary (n ¼ 42) (n ¼ 42) (n ¼ 142) (n ¼ 83) (n ¼ 120) (n ¼ 20) Maximum 51:53 75:14 446:31 109:04 147:08 24:06 75th percentile 03:42 03:19 22:25 07:20 08:34 00:46 Median 01:39 01:15 02:25 01:59 07:01 00:18 25th percentile 00:23 01:15 00:43 00:20 02:15 00:07 Minimum 00:01 00:01 00:01 00:01 00:07 00:03 1 5 10 25 50 75 90 95 99 100 0 20 40 60 80 100 120 0.02 0.07 0.13 0.6 2.4 7.7 32.3 91.5 243.8 446.5 Cumulative% Time to Initial Review (hours) Figure 1. Time to CRF review during centralized monitoring. Table 5. Example of the status of data entry. # of Subjects Entered # of Screen Failures # of Subjects Treated # of Pages Entered # of Pages Reviewed # of Subjects Locked # of Subjects Signed 35 5 30 4562 4562 35 35 )elpmaxe(nwodkaerBstcejbuS 14 105 105 YES YES 23 193 193 YES YES Mitchel et al 467
  • 5. Table 6. Data entry status by visit. Subject No. Screening (Day –14 - Day 0) Visit 2 (Day 1) Visit 3 (Day 2) Visit 4 (Day 7) 04 19 May 2011 22 19 May 2011 06 Jun 2011 07 Jun 2011 13 Jun 2011 23 19 May 2011 06 Jun 2011 07 Jun 2011 13 Jun 2011 Table 7. Data entry status by form. Subject 07 Screening Visit Date Demographics Medical History Visit 2 (Day 1) Visit Date Eligibility Vital Signs Visit 4 (Day 7) Vital Signs Blood Sampling Drug Administration Visit 5 (Day 22) Visit Date Pre-Dose Vital Signs Blood Sampling End Of Trial End Of Trial AE Adverse Event Medications Medications Table 8. Query frequency by form report. Form Pending Monitor Reply Pending Site Reply Resolved Total Adverse Event 0 0 2 2 Concomitant Medication 4 8 18 30 Demographics 0 0 3 3 Medical History 5 5 0 10 Sample Collection 8 12 12 32 Physical Examination 0 0 4 4 Table 9. Query frequency by edit check. Edit ID Pending Monitor Reply Pending Site Reply Resolved Total Med-10 6 8 1 15 AE-15 0 0 1 1 Drug-18 0 0 7 7 Lab-08 0 0 1 1 Skin-10 3 9 0 12 Demog-06 0 0 20 20 Visit-007 10 2 8 20 Vitals-010 0 0 1 1 468 Drug Information Journal 46(4)
  • 6. This color-coded module allowed the clinical research team to see which forms had been reviewed using the following color codes: (1) not been entered (green); (2) have data (blue); (3) have been reviewed (gold); and (4) have been reviewed and locked by the data manager role (red). Edit Checks A total of 261 edit checks were fired and a total of 360 queries were issued for the 3948 eCRF pages that were entered. Table 8 illustrates an example of a midstudy report of the number of queries generated by form and the status of their review. The frequency of queries per form was a good indicator of the status of data quality, how well the clinical study site understood the protocol, and possible design issues of the EDC system. In order to better understand the causes of queries and fired edits checks, an online report was configured to assess the status of edit checks by variable (Table 9). By evaluating the outcomes of this table, the clinical research team could focus on specific data quality issues. Data Review While the metrics described here were very useful to evaluate operational signals, looking at data over time is also very use- ful. It is especially valuable when outcomes appear to differ between sites or when a sponsor needs a comfort level that sub- jects are responding to treatment. In Table 10, the CRA and clinical team were able to assess a critical PRO between screen- ing and the end of the study and to see that a positive outcome was occurring within the trial. Online Monitoring Reports The online monitoring report function allowed the CRAs and project managers to manage site monitoring totally within the EDC system, as demonstrated in Table 11. There was no need to mechanically copy and paste information already captured in the EDC system. Table 11 illustrates part of the monitoring report where the status of the study subjects is obtained directly from the EDC system and the CRA entered responses to online prompts. There were 57 items tracked within the online monitoring reports that required follow-up. This online tool allowed both the CRA and project manager to track the status of all outstand- ing items. Table 12 illustrates some of the findings and resolu- tions. By doing real-time data review and logging findings within the monitoring reports, the CRA was able to identify potential protocol violations during the screening period and immediately inform the site about these potential violations. eCTR Deliverable During the study, the clinical sited was able create a book- marked pdf copy of the eCTR of each individual study subject Table 10. Change in a patient-reported outcome (PRO). PID Total PRO Score Difference Screening Visit 12 01 53 35 –18 02 30 35 5 03 28 30 2 04 34 28 –6 05 34 37 3 06 53 45 –8 07 38 39 1 08 35 32 –3 09 47 46 –1 Table 11. Online monitoring report. Study Status and Subject Enrollment Yes No N/A Comment ?yrotcafsitasssergorpydutsdnatnemllornesI Is the subject enrollment log current and accurate? Enrollment Log not being used 13CIdengisohwstcejbuSforebmuN Derived From EDC Database 1eruliaFneercS 0detaerTstcejbuSforebmuN 03stcejbuSevitcAforebmuN 0detelpmoCstcejbuSforebmuN Mitchel et al 469
  • 7. or all study subjects. At the end of the study after database lock, the sponsor provided an electronic copy of each sub- ject’s eCTR to the study site, as well as maintained the eCTR ‘‘live.’’ Cost Savings Under normal monitoring guidelines and with full SDV, it was anticipated that the CRA would have had to spend 4 full days at the clinical site plus travel time and preparation. In reality, there was only 1 full-day monitoring visit at the time of the ini- tial treatment phase and a 2-hour monitoring visit during the course of the study. Thus, even if there were 2 full days of mon- itoring for this study when using DDE, at an average cost of US$3000 per monitoring visit, there would have been a cost savings of US$6000 (2 visits) for the monitoring phase of this single-center study. Discussion and Conclusions The Tufts Center for the Study of Drug Development recently published the first global benchmark for CRA workload and utilization indicating that CRAs worldwide spent approxi- mately 20% of their time traveling and devoted only 41% of their time at clinical trial sites.13 In addition, the study found that CRA workload and time allocation vary widely by geo- graphic region, with US-based study monitors spending more time traveling and on site than their counterparts elsewhere. European study monitors spend relatively more time perform- ing off-site monitoring and administrative tasks. Clearly, implementation of DDE, real-time monitoring at the time of data entry, and risk-based monitoring will have pos- itive effects on the clinical monitoring and data management functions within the pharmaceutical and medical device indus- tries. One of the biggest effects will be associated with the abil- ity to see and evaluate data as they are being entered rather than waiting days or weeks compared with the paper process. Since transcription errors from paper records to an EDC system are virtually eliminated,14 the clinical team can now have a com- fort level that what is being observed in real time in the EDC system is an accurate representation of the study subject’s data. In addition, once the data are entered and monitored, often within minutes of the office visit, the site can be queried imme- diately. As a result, there is a good chance that the query will be answered with data fresh in the mind of the study coordi- nator. As a result, when the study subject leaves the office, there is virtually nothing to do until the following office visit. While the current report describes a single investigator study, a multicenter study with 6 clinical sites designed to treat Table 12. Online monitoring report—follow-up list. Date Issue Follow-up Action Date of Resolution 27 May 2011 Patient 30 has RA. Called the site and indicated to the coordinator that since the patient has RA, he is a screen failure. 31 May 2011 26 May 2011 Study coordinator called regarding an obese subject who had sleep apnea. He had lost weight and no more apnea anymore. Is this patient eligible? Answer was no, as exclusion criteria is history of sleep apnea. 31 May 2011 26 May 2011 Patient 222 has a history of MS. Emailed site to SF patient. 13 Jun 2011 06 Jul 2011 Requested from Support that the deviation from vital sign report be removed. Done 13 Jul 2011 06 Jul 2011 Medical History Page was incorrect. Emailed Support to fix. Fixed 13 Jul 2011 07 Jul 2011 The subject is scheduled for a Saturday with blood draws. Discussed with UUU from LAB. Bloods will be picked up on Saturday and LAB will analyze them Sunday. 10 Jul 2011 08 Jul 2011 Confirmed with the study coordinator at site that they have all the information necessary for the samples Confirmed 14 Jul 2011 470 Drug Information Journal 46(4)
  • 8. 120 patients over 6 months is ongoing. The study is being man- aged with just 1 CRA, the investigators and coordinators have transitioned to DDE in a seamless manner, and there have been no unexpected issues relating to DDE. In addition, a phase 3 study with 200 subjects is planned for Q3 2012 with 20 sites with extensive training planned at the Investigator meeting to address EDC, DDE, eCTR and the eTrial Master File. It can be concluded that once the pharmaceutical industry broadly adopts DDE and risk-based monitoring, the following will result: 1. Significant increases in productivity for both the sponsors, clinical sites, and contract research organizations (CROs) as travel time and SDV will be reduced 2. Significant reductions in overall monitoring costs, as onsite monitoring visits could possibly be scaled back by 50% to 60% 3. Earlier detection and analyses of adverse events resulting in enhanced patient safety Acknowledgments The authors thank Joyce Hays, MS, CEO of Target Health Inc, for reviewing the manuscript. For this publication, Target Health Incor- porated’s e*CRF1 was used for EDC and Target’s e*CRF1 Viewer was used to access the eSource records. Declaration of Conflicting Interests The author(s) declared no potential conflicts of interest with respect to the research, authorship, and/or publication of this article. Funding The author(s) received no financial support for the research, authorship, and/or publication of this article. References 1. Clinical Data Interchange Standards Consortium. Leveraging the CDISC Standards to Facilitate the use of Electronic Source Data within Clinical Trials Clinical Data Interchange Standards Con- sortium. http://www.cdisc.org/stuff/contentmgr/files/0/2f6eca8f0 df7caac5bbd4fadfd76d575/miscdocs/esdi.pdf. Published Novem- ber 2006. 2. FDA. Guidance for industry, computerized systems used in clinical investigations; US Department of Health and Human Ser- vices. http://www.fda.gov/OHRMS/DOCKETS/98fr/04d-0440- gdl0002.pdf. Published May 2007. 3. FDA. Guidance for industry electronic source documentation in clinical investigations. http://www.fda.gov/downloads/Drugs/ GuidanceComplianceRegulatoryInformation/Guidances/UCM239 052.pdf. Published December 2010. 4. EMA. Reflection paper on expectations for electronic source data and data transcribed to electronic data collection tools in clinical trials (EMA/INS/GCP/454280/2010). http://www.phtcorp.com/pdf/ EMAReflectionPaper.pdf. Published June 2010. 5. FDA. Guidance for industry oversight of clinical investigations— a risk-based approach to monitoring [draft]. http://www.fda.gov/ downloads/Drugs/GuidanceComplianceRegulatoryInformation/ Guidances/UCM269919.pdf. Published August 2011. 6. EMA. Reflection paper on risk based quality management in clin- ical trials (EMA/INS/GCP/394194/2011). http://www.ema.europa. eu/docs/en_GB/document_library/Scientific_guideline/2011/08/ WC500110059.pdf. Published August 2011. 7. Morrison B, Cochran C, Giangrandec J, et al. Monitoring the quality of conduct of clinical trials: a survey of current practices. Clin Trials. 2011;8:342-349. 8. Mitchel J, Jurewicz E, Flynn-Fuchs K, et al. The role of CRAs in the development and implementation of Internet-based clinical trial applications: new career opportunities. Monitor. October 2005:17-21. 9. Mitchel J, Kim YJ, Choi JH, et al. The impact of electronic data capture (EDC) on clinical data management—perspectives from the present into the Future. Monitor. August 2008:37-41. 10. Tantsyura V, Grimes I, Mitchel J. et al. Risk-based source data verification approaches: pros and cons. Drug Information Journal. 2010;44:745-756. 11. Ball L, Meeker-O’Connell A. Building quality into clinical trials. Monitor. December 2011:11-16. 12. Mitchel J, Schloss-Markowitz J. Risk based monitoring time for change. International Clinical Trials. February 2011:22-29. 13. Getz K. Study monitor workload high & varied with wide disparity by global region. Tufts CSDD Impact Report. January/February 2012:1-4. 14. Mitchel J, Kim YJ, Choi JH, et al. Evaluation of data entry errors and data changes to an electronic data capture (EDC) clinical trial database. Information Journal. 2011;45:421-430. Mitchel et al 471