
Recommended
Recommended
More Related Content
Similar to Lesikar−Flatley−Rentz Business Communication Making Conn.docx
Similar to Lesikar−Flatley−Rentz Business Communication Making Conn.docx (20)
More from SHIVA101531
More from SHIVA101531 (20)
Recently uploaded
Recently uploaded (20)
Lesikar−Flatley−Rentz Business Communication Making Conn.docx
- 1. Lesikar−Flatley−Rentz: Business Communication: Making Connections in a Digital World, 11th Edition IV. Fundamentals of Report Writing 13. Graphics © The McGraw−Hill Companies, 2008 c h a p t e r t h i r t e e n Graphics L E A R N I N G O B J E C T I V E S Upon completing this chapter, you will be able to use graphics effectively in business reports. To reach this goal, you should be able to 1 Plan which parts of your report should be communicated by graphics. 2 Explain the general mechanics of constructing graphics—size, layout, type, rules and borders, color and cross-hatching, clip art, background, numbering, titles, title placement, and footnotes and acknowledgments.
- 2. 3 Construct textual graphics such as tables, pull quotes, fl owcharts, and process charts. 4 Construct and use visual graphics such as bar charts, pie charts, line charts, scatter diagrams, and maps. 5 Avoid common errors and ethical problems when constructing and using graphics. 6 Place and interpret graphics effectively. Lesikar−Flatley−Rentz: Business Communication: Making Connections in a Digital World, 11th Edition IV. Fundamentals of Report Writing 13. Graphics © The McGraw−Hill Companies, 2008 CHAPTER 13 Graphics 413 I N T R O D U C T O R Y S I T U A T I O N Graphics In your management job at Pinnacle, you proofread reports prepared by your co-workers. Because Pinnacle uses chemicals in its products, many of the reports are highly technical and complex. Many others, especially those com-
- 3. ing from fi nance and sales, are fi lled with facts and fi gures. In your judgment, most of the reports you have proofread are hard to understand. The one you are looking at now is packed with page after page of sales statistics. Your mind quickly gets lost in the mass of details. Why didn’t the writer take the time to summarize the more important fi gures in a chart? And why didn’t the writer put some of the details in tables? Many of the other reports you have been reading, especially the technical ones, are in equal need of graphics. Bar charts, pie charts, and maps would certainly help explain some of the concepts discussed. If only report writers would understand that words alone sometimes cannot communicate clearly—that words sometimes need to be supplemented with visual communication techniques. If the writers of your reports studied the following review of graphics, your job would be easier and more enjoyable. So would the jobs of the readers of those reports. In many of your reports you will need to use graphics to help convey information quickly and accurately. Graphics both grab attention and are retained longer. By graph- ics we mean any form of illustration: charts, pictures, diagrams, maps. Although tables and bulleted lists are predominantly text, their format permits us to include them here. Also, most computer presentation programs include these formats. PLANNING THE GRAPHICS You should plan the graphics for a report soon after you organize your fi ndings. Your planning of graphics should be based on the need to communicate. Graphics serve one main purpose—to communicate—and you should use them
- 4. primarily for that purpose. Graphics can clarify complex or diffi cult information, emphasize facts, add coherence, summarize data, and provide interest. Additionally, today’s data mining and visualiza- tion tools help writers fi lter the vast amount of data that are gathered and stored regu- larly. Of course, well-constructed graphics also enhance the appearance of a report. In selecting graphics, you should review the information that your report will con- tain, looking for any possibility of improving communication of the report through the use of graphics. Specifi cally, you should look for complex information that visual presentation can make clear, for information too detailed to be covered in words, and for information that deserves special emphasis. Of course, you will want to plan with your reader in mind. You will choose graph- ics appropriate to both the content and context where they are presented. The time and money you spend on gathering information or creating a graphic should be balanced in terms of the importance of the message you want to convey. Thus, you construct graph- ics to help the reader understand the report more quickly, easily, and completely. As you plan the graphics, remember that unlike info graphics that stand alone, report graphics should supplement the writing or speaking—not take its place. They should help the wording by covering the more diffi cult parts, emphasizing the important points, and presenting details. But the words should carry the main message—all of it.
- 5. DETERMINING THE GENERAL MECHANICS OF CONSTRUCTION In constructing graphics, you will be concerned with various mechanical matters. The most common are summarized in the following paragraphs. • A graphic is any form of illustration. • You should plan the use of graphics as you plan your report. • In planning their use, look for information that they can help communicate. • Plan graphics with your reader in mind. • But remember that graphics supplement and do not replace the writing Lesikar−Flatley−Rentz: Business Communication: Making Connections in a Digital World, 11th Edition IV. Fundamentals of Report Writing
- 6. 13. Graphics © The McGraw−Hill Companies, 2008 414 PART 4 Fundamentals of Report Writing Size Determination One of the fi rst decisions you must make in constructing a graphic is determining its size. This decision should not be arbitrary, and it should not be based on conve- nience. You should give the graphic the size that its contents and importance justify. If a graphic is simple (with only two or three quantities), a quarter page might be more than enough and a full page would be too much unless its importance needed empha- sis. But if a graphic must display complex or detailed information, a full page might be justifi ed. With extremely complex, involved information, you may need to use more than a full page. When you do, make certain that this large page is inserted and folded so that the readers can open it easily. The fold you select will be determined by the size of the page. You simply have to experiment until you fi nd a convenient fold. Layout Arrangement You should determine the layout (shape) of the graphic by size and content require- ments. Sometimes a tall, narrow rectangle (portrait) is the answer; sometimes the answer is a short, wide rectangle or a full-page rectangle (landscape). You simply consider the logical possibilities and select the one that appears
- 7. best. Type Type used in graphics throughout a report is generally consistent in both style and font. Style refers to the look of the type such as bold or italics; font refers to the look of the letters such as with or without feet (serif or sans serif). Occasionally you may want to vary the type, but do so by design for some special reason. Be aware that even the design of the font you choose will convey a message, a message that should work with the text content and design. If your reader will be viewing the document on screen in Word 2007 or on a Vista computer with ClearType, be sure to use one of the fonts optimized for use with ClearType such as Cambria or Calibri. They were designed to render well on the screen, and Microsoft’s research has confi rmed that they enable people to read faster and more accurately, leading to a 7 percent average increase in productivity.1 Size is another variable to watch. The size you choose should look appropriate in the context in which it is used. Your top priority in choosing type style, font, and size should be readability. Rules and Borders You should use rules and borders when they help the appearance of the graphic. Rules help distinguish one section or graphic from another, while borders help sepa-
- 8. rate graphics from the text. In general, you should place borders around graphics that 1 Bill Hill, Microsoft Project Manager, video interview, 29 May 2006 <http://download.microsoft.com/download/ 8/1/c/81cdb151-0aae-4f50-ab44- 654b5f7ae0db/cleartype_2005.wmv>. • Make each graphic the size that its contents justify. • Graphics larger than a page are justifi ed if they contain enough information. • Size and contents determine the shape of graphics. • Choose a type to help convey the message clearly. • Choose a type size that is readable. • Use rules and borders when they help appearance. Lesikar−Flatley−Rentz: Business Communication:
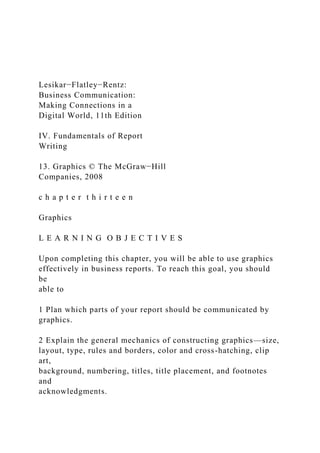
- 9. Making Connections in a Digital World, 11th Edition IV. Fundamentals of Report Writing 13. Graphics © The McGraw−Hill Companies, 2008 CHAPTER 13 Graphics 415 occupy less than a full page. You also can place borders around full-page graphics, but such borders serve little practical value. Except in cases in which graphics simply will not fi t into the normal page layout, you should not extend the borders of graphics beyond the normal page margins. Color and Cross-Hatching Color and cross-hatching, appropriately used, help readers see comparisons and dis- tinctions (see Figure 13–1). In fact, research has found that color in graphics improves the comprehension, retention, and ease of extracting information. Also, both color and cross-hatching add to the attractiveness of the report. Because color is especially effec- tive for this purpose, you should use it whenever practical and appropriate. Clip Art Today you can get good-looking clip art easily—so easily in fact that some writers often overuse it. Although clip art can add interest and bring the reader into a graphic
- 10. effectively, it also can overpower and distract the reader. The general rule is to keep in mind the purpose your clip art is serving: to help the reader understand the content. It should be appropriate in both its nature and size. It also should be appropriate in its representation of gender, race, and age. Also, if it is copyrighted, you need permission to use it. Background Background colors, photos, and art for your graphics should be chosen carefully. The color should provide high contrast with the data and not distract from the main mes- sage. Photos, especially faded photos, that are well chosen can add interest and draw the reader in. However, photos as well as other art can send other messages and evoke emotions not appropriate or desirable for the message the graphic conveys. Addition- ally, when graphics are used cross-culturally, you will want to be sure the message your background sends is the one you intended by testing or reviewing it with the intended receivers. Numbering Except for minor tabular displays, pull quotes, and clip art, you should number all the graphics in the report. Many schemes of numbering are available to you, depending on the make-up of the graphics. If you have many graphics that fall into two or more categories, you may number each of the categories consecutively. For example, if your
- 11. report is illustrated by six tables, fi ve charts, and six maps, you may number these graphics Table I, Table II, . . . Table VI; Chart 1, Chart 2, . . . Chart 5; and Map 1, Map 2, . . . Map 6. But if your graphics comprise a wide mixture of types, you may number them in two groups: tables and fi gures. Figures, a miscellaneous grouping, may include all types other than tables. To illustrate, consider a report containing three tables, two maps, three Figure 13–1 Color versus Cross- hatched Pie • Color and cross-hatching can improve graphics. • Use clip art to help your reader understand your message. • Background color, photos, and art should enhance the message of the graphic. • Number graphics consecutively by type. • Figures are a miscellaneous grouping of types. Number tables separately.
- 12. Lesikar−Flatley−Rentz: Business Communication: Making Connections in a Digital World, 11th Edition IV. Fundamentals of Report Writing 13. Graphics © The McGraw−Hill Companies, 2008 416 PART 4 Fundamentals of Report Writing charts, one diagram, and one photograph. You could number these graphics Table I, Table II, and Table III and Figure 1, Figure 2, . . . Figure 7. By convention, tables are not grouped with other types of graphics. But it would not be wrong to group and number as fi gures all graphics other than tables even if the group contained suffi cient subgroups (charts, maps, and the like) to permit separate numbering of each of them. Construction of Titles and Captions Every graphic should have a title or caption that adequately describes its contents. A title is used with graphics displayed in oral presentations; a caption is used with graph- ics included in print documents. Like the headings used in other parts of the report, the title or caption of the graphic has the objective of concisely covering the contents.
- 13. As a check of content coverage, you might well use the journalist’s fi ve Ws: who, what, where, when, and why, and sometimes you also might use how. But because conciseness also is desired, it is not always necessary to include all the Ws in the title. The title or caption of a chart comparing the annual sales volume of the Texas and California territories of the Dell Company for the years 2006– 07 might be constructed as follows: Who: Dell Company What: Annual sales Where: Texas and California branches When: 2006–07 Why: For comparison The title or caption might read, “Comparative Annual Sales of Texas and California Territories of the Dell Company, 2006–07.” For even more conciseness, you could use a major title and subtitle. The major title might read, “A Texas and California Sales Comparison”; the subtitle might read, “Dell Company 2006– 07.” Similarly, the caption might read “A Texas and California Sales Comparison: Dell Company 2006–2007.” An alternative to this kind of topic heading is a talking heading. As you learned in Chapter 10, the talking heading tells the reader the nature of what is to follow. The same holds true for a graphic. In this case a talking heading might read, “Texas Leads California in Total Annual Sales for 2006.” In a sense, it gives the reader the main message of the
- 14. graphic. You’ll see another example of a talking heading in Figure 13–8, Illustration of a Bi-lateral Column Chart, which reads, “NASCAR Leads in Fan Base Growth.” Placement of Titles and Captions In documents, titles of tables conventionally appear above the tabular display; captions of all other types of graphics conventionally appear below it. In presentations, titles C O M M U N I C A T I O N M A T T E R S Clear Evidence of the Value of Accurate Charts “To what do you attribute your company’s success?” asked the interviewer. “A line chart,” replied the executive. “In the early years of our company, we had some real problems. Productivity was low, and we were losing money. So to impress our problem on our workers, I had a line chart painted on the wall of our main building. Every day, when the workers arrived, they saw our profi t picture. Well, the profi t line kept going down. It went from the third fl oor, to the second, to the fi rst, to ground level. Then we had to bring in digging equipment to keep the line going. But keep it going we did—until the line dramatically reversed direction.” “The workers fi nally got the message?” asked the interviewer. “No,” replied the executive, “the digger struck oil.” • The titles should describe content clearly (consider the fi ve Ws: who, what, where, when, why ).
- 15. • The conventional placement of titles is at the top for tables and at the bottom for charts. But many place all titles at the top. Lesikar−Flatley−Rentz: Business Communication: Making Connections in a Digital World, 11th Edition IV. Fundamentals of Report Writing 13. Graphics © The McGraw−Hill Companies, 2008 CHAPTER 13 Graphics 417 of both tables and other charts and illustrations are usually placed above the graphic. There has been a trend toward using title case type for all illustration titles and plac- ing the titles of both tables and fi gures at the top. In fact, most presentation programs default to the top. These practices are simple and logical; yet you should follow the conventional practices for the more formal reports. Footnotes and Acknowledgments Parts of a graphic sometimes require special explanation or elaboration. When this
- 16. happens, as when similar situations arise in connection with the text of the report, you should use footnotes. Such footnotes are concise explanations placed below the illustration and keyed to the part explained by means of a superscript (raised) number or symbol (asterisk, dagger, double dagger, and so on). Footnotes for tables are best placed immediately below the graphic presentation. Footnotes for other graphic forms follow the illustration when the title or caption is placed at the bottom of the graphic. Usually, a source acknowledgment is the bottom entry made in the graphic context. By source acknowledgment we mean a reference to the body or authority that deserves the credit for gathering the data used in the illustration. The entry consists simply of the word Source followed by a colon and the source name. A source note for data based on information gathered by the U.S. Department of Commerce might read like this: Source: U.S. Department of Commerce If you or your staff collected the data, you may either omit the source note or give the source as “Primary,” in which case the note would read like this: Source: Primary CONSTRUCTING TEXTUAL GRAPHICS Graphics for communicating report information fall into two general categories: those
- 17. that communicate primarily by their textual content (words and numerals) and those that communicate primarily by some form of picture. Included in the textual group are tables, pull quotes, and a variety of fl ow and process charts (Gantt, fl ow, organization, and such). Tables A table is an orderly arrangement of information in rows and columns. As we have noted, tables are not truly graphic (not really pictures). But they communicate like graphics, and they have many of the characteristics of graphics. Two basic types of tables are available to you: the general- purpose table and the special-purpose table. General-purpose tables cover a broad area of information. For example, a table reviewing the answers to all the questions in a survey is a general- purpose table. Such tables usually belong in the appendix. Special-purpose tables are prepared for one special purpose: to illustrate a particular part of the report. They contain information that could be included with related infor- mation in a general-purpose table. For example, a table presenting the answer to one of the questions in a survey is a special-purpose table. Such tables belong in the report text near the discussion of their contents. Aside from the title, footnotes, and source designation previously discussed, a table contains heads, columns, and rows of data, as shown in Figure 13–2. Row heads are the titles of the rows of data, and spanner heads are the titles of the columns. The span-
- 18. ner heads, however, may be divided into column heads, as they are often called. The construction of text tables is largely infl uenced by their purpose. Nevertheless, a few general construction rules may be listed: • If rows are long, the row heads may be repeated at the right. • Use footnotes to explain or elaborate. • Acknowledge the source of data with note below. • “Source: Primary” is the proper note for data you gathered. • Graphics fall into two general categories: (1) textual (words and numerals) and (2) visual (pictures). • A table is an orderly arrangement of information. • You may use general- purpose tables (those containing broad information), • or you may use special- purpose tables (those covering a specifi c area
- 19. of information). • See Figure 13–2 for details of table arrangement. Lesikar−Flatley−Rentz: Business Communication: Making Connections in a Digital World, 11th Edition IV. Fundamentals of Report Writing 13. Graphics © The McGraw−Hill Companies, 2008 418 PART 4 Fundamentals of Report Writing • The em dash (—) or the abbreviation n.a. (or N.A. or NA), but not the zero, is used to indicate data not available. • Footnote references to numbers in the table should be keyed with asterisks, daggers, double daggers, and such. Numbers followed by footnote reference numbers may cause confusion. Small letters of the alphabet can be used when many references are made. • Totals and subtotals should appear whenever they help the purpose of the table. The totals may be for each column and sometimes for each row.
- 20. Row totals are usually placed at the right; but when they need emphasis, they may be placed at the left. Likewise, column totals are generally placed at the bottom of the column, but they may be placed at the top when the writer wants to emphasize them. A ruled line (usually a double one) separates the totals from their components. • The units in which the data are recorded must be clear. Unit descriptions (bushels, acres, pounds, and the like) appropriately appear above the columns, as part of the headings or subheadings. If the data are in dollars, however, placing the dollar mark ($) before the fi rst entry in each column is suffi cient. Tabular information need not always be presented in formal tables. In fact, short arrangements of data may be presented more effectively as parts of the text. Such ar- rangements are generally made as either leaderwork or text tabulations. Leaderwork is the presentation of tabular material in the text without titles or rules. (Leaders are the repeated dots with intervening spaces.) Typically, a colon precedes the tabulation, as in this illustration: The August sales of the representatives in the Western Region were as follows: Charles B. Brown . . . . . . . . . . $33,517
- 21. Thelma Capp . . . . . . . . . . . . . 39,703 Bill E. Knauth . . . . . . . . . . . . . 38,198 Text tabulations are simple tables, usually with column heads and some rules. But they are not numbered, and they have no titles. They are made to read with the text, as in this example: In August the sales of the representatives in the Western Region increased sharply from those for the preceding month, as these fi gures show: Representative July Sales August Sales Increase Charles B. Brown $32,819 $33,517 $ 698 Thelma Capp 37,225 39,703 2,478 Bill E. Knauth 36,838 38,198 1,360 Table I—Worldwide Music Industry Revenues 2005–2010 (millions) *Some data for 2005 taken from 10K and 10Q filings SOURCE: eMarketer May 2006 ProjectedActual 2010
- 23. $434 2006 $31,465 $2,832 $1,274 Total music revenues Total digital music revenues Mobile music revenues Table number and title Spanner heads Column heads Row heads Footnote Source acknowledgment • Tabular information also can be presented as (1) leaderwork (as illustrated here), or • (2) text tabulations (as illustrated here).
- 24. Figure 13–2 Good Arrangement of the Parts of a Typical Table Lesikar−Flatley−Rentz: Business Communication: Making Connections in a Digital World, 11th Edition IV. Fundamentals of Report Writing 13. Graphics © The McGraw−Hill Companies, 2008 CHAPTER 13 Graphics 419 Pull Quotes The pull quote is a textual visual that is often overlooked yet extremely useful in em- phasizing key points. It is also useful when the text or content of the report does not lend itself naturally or easily to other graphics. By selecting a key sentence, copying it to a text box, enlarging it, and perhaps even enhancing it with a new font, style, or col- or, a writer can break up the visual boredom of a full page or screen of text. Drawing software lets users easily wrap text around shapes as well as along curves and irregular lines. Figure 13–3 shows an example that is simple yet effective in both drawing the reader’s attention to a key point and adding visual interest to a page. Bullet Lists
- 25. Bullet lists are listings of points arranged with bullets (•) to set them off. These lists can have a title that covers all the points, or they can appear without titles, as they ap- pear at various places in this book. When you use this arrangement, make the points grammatically parallel. If the points have subparts, use sub- bullets for them. Make the sub-bullets different by color, size, shape, or weight. Darts, check marks, squares, or triangles can be used for the secondary bullets. Flowcharts and Process Charts If you have studied business management, you know that administrators use a variety of specialized charts in their work. Often these charts are a part of the information presented in reports. Perhaps the most common of these is the organization chart (see Figure 13–4). These charts show hierarchy of positions, divisions, departments, and such in an organization. Gantt charts are graphic presentations that show planning and • Pull quotes emphasize key concepts. • Bullet lists show points set off by a bullet symbol. Figure 13–3 Illustration of a Pull Quote SOURCE: Harvard Business Review Dec. 2005: 90.
- 26. • Various specialized management charts are useful in reports—for example, organization charts, Gantt charts, and fl owcharts. Lesikar−Flatley−Rentz: Business Communication: Making Connections in a Digital World, 11th Edition IV. Fundamentals of Report Writing 13. Graphics © The McGraw−Hill Companies, 2008 420 PART 4 Fundamentals of Report Writing Rosemary Lenaghan Stephen Acord Lydia Liedman Mary Sanchez Megan O'Conner Paul Wong Marie Murphy Eulalia Gomez Terrance Lenaghan Matthew Gregory
- 27. Kathleen Meersman Cecelia Kubicek Troy Payton Zeke Smith Emma York Marina Munson Janet Wingler Carolynn Workman Controller Jane Adami VP. R&D Robert Edwards VP. Marketing Chris VanLerBerghe Executive Assistant Diana Chan President Chart 4 Organization Chart for the U.S. Corporate Office of Thankyoutoo.com, 2007 Carol Acord VP. PR Owen Smith VP. MIS Figure 13–4 Illustration of an Organization Chart
- 28. Figure 13–5 Illustration of a Flowchart Search with Google Follow link to source Revise search strategy Evaluate credibility of source Potential sources? Useful source? No Yes Yes No No Yes Potential sources?
- 29. Add to Unique Favorites folder End search Enough sources? Go to other resources Select topic Figure 5 The Process of Searching with Google No Yes Lesikar−Flatley−Rentz: Business Communication: Making Connections in a Digital World, 11th Edition IV. Fundamentals of Report Writing 13. Graphics © The McGraw−Hill Companies, 2008
- 30. CHAPTER 13 Graphics 421 scheduling activities. As the word implies, a fl owchart (see Figure 13–5) shows the sequence of activities in a process. Traditionally, fl owcharts use specifi c designs and symbols to show process variations. A variation of the organization and fl owchart is the decision tree. This chart helps one follow a path to an appropriate decision. You can easily construct these charts with presentation and drawing software. CONSTRUCTING VISUAL GRAPHICS The truly visual types of graphics include a variety of forms: charts and illustrations. Charts are graphics built with raw data and include bar, pie, and line charts and all their variations and combinations. Illustrations includes maps, diagrams, drawings, photos, cartoons, and such. Bar and Column Charts Simple bar and column charts compare differences in quantities by differences in the lengths of the bars representing those quantities. You should use them primarily to show comparisons of quantity changes at a moment in time. As shown in Figure 13–6, the main parts of the bar chart are the bars and the grid (the fi eld on which the bars are placed). The bars, which may be arranged horizontally or vertically (also called a column chart), should be of equal width. You should identify each bar or column, usually with a caption at the left or bottom. The grid (fi eld) on
- 31. which the bars are placed is usually needed to show the magnitudes of the bars, and the units (dollars, pounds, miles, and such) are identifi ed by the scale caption below. When you need to compare quantities of two or three different values in one chart, you can use a clustered (or multiple) bar chart. Cross-hatching, colors, or the like on the bars distinguish the different kinds of information (see Figure 13–7). Somewhere within the chart, a legend (explanation) gives a key to the differences in the bars. Because clustered bar charts can become cluttered, usually you should limit compari- sons to three to fi ve kinds of information in one of them. When you need to show plus and minus differences, you can use bilateral column charts. The columns of these charts begin at a central point of reference and may go either up or down, as illustrated in Figure 13–8. Bar titles appear either within, above, or below the bars, depending on which placement fi ts best. Bilateral column charts are especially good for showing percentage changes, but you may use them for any series in which plus and minus quantities are present. • Visual graphics include data-generated charts, photographs, and artwork. • Simple bar and column charts compare differences in quantities by varying bar lengths.
- 32. • Clustered bar charts are useful in comparing two or three kinds of quantities. • When you need to show plus and minus differences, bilateral column charts are useful. $0 $2 0,0 00 Professional degrees Doctorate degree Master’s degree Bachelor’s degree Associate’s degree Some college, no degree Ed uc at io
- 33. na l L ev el Average Annual Earnings SOURCE: U.S. Census Bureau, Annual Demographic Survey, 2005. High school graduate 9th to 12th grade Less than 9th grade $4 0,0 00 $6 0,0 00 $1 00 ,00 0 $1 20 ,00
- 34. 0 $8 0,0 00 $1 40 ,00 0 Chart 6 Educational Attainment and Annual Earnings $115,292 $93,096 $67,361 $53,581 $37,480 $35,970 $30,640 $20,082 $22,232 Figure 13–6
- 35. Illustration of a Bar Chart Lesikar−Flatley−Rentz: Business Communication: Making Connections in a Digital World, 11th Edition IV. Fundamentals of Report Writing 13. Graphics © The McGraw−Hill Companies, 2008 422 PART 4 Fundamentals of Report Writing If you need to compare subdivisions of columns, you can use a stacked (subdivided) column chart. As shown in Figure 13–9, such a chart divides each column into its parts. It distinguishes these parts by color, cross-hatching, or the like; and it explains these differences in a legend. Subdivided columns may be diffi cult for your reader to interpret since both the beginning and ending points need to be found. Then the reader has to subtract to fi nd the size of the column component. Clustered column charts or pie charts do not introduce this possibility for error. Another feature that can lead to reader error in interpreting bar and column chart data is the use of three dimensions when only two variables are being compared. One study evaluated the speed and accuracy of readers’ interpretation of two-
- 36. dimensional columns on two-dimensional axes with three- dimensional columns on two- dimensional axes and three-dimensional columns on three- dimensional axes. The results showed that readers were able to extract information from the column chart fastest and most accurately when it was presented in the simple two- dimensional 0% 10% Percentage 20% 30% 40% 50% 60% 70% 80% 90% Chart 7 Where Students Shop for Back-to-School Items Fall 2005 Discount store Department store College bookstore Office supply store Online Specialty store Home store Drug store
- 37. Juniors Seniors Graduate students Sophomores Freshmen SOURCE: National Retail Federation. Figure 13–7 Illustration of a Clustered Bar Chart SOURCE: Fortune 5 Sep. 2005: 56. Chart 8 NASCAR Leads in Fan Base Growth Percentage change, 1997–2004 Pe rc en ta ge 30 25 20 15
- 38. 10 5 0 –5 –10 –20 –15 24.6 NASCARNHLNBAMLBNFL –1.6 –1.3 –13.9 –10.2 Figure 13–8 Illustration of a Bilateral Column Chart • To compare subdivisions of columns, use a stacked bar chart. • Two-dimensional columns on two- dimensional axes are
- 39. easiest for readers to use. Lesikar−Flatley−Rentz: Business Communication: Making Connections in a Digital World, 11th Edition IV. Fundamentals of Report Writing 13. Graphics © The McGraw−Hill Companies, 2008 CHAPTER 13 Graphics 423 column on the two-dimensional axis.2 Therefore, unless more than two variables are used, choosing the two-dimensional presentation over the three- dimensional form is usually better. A special form of stacked (subdivided) column chart is used to compare the subdivisions of percentages. In this form, all the bars are equal in length, for each represents 100 percent. Only the subdivisions within the bars vary. The objective of this form is to compare differences in how wholes are divided. The component parts may be labeled, as shown in Figure 13–10, but they also may be explained in a legend. • You also can use such
- 40. a chart for comparing subdivisions of percentages. Sp en di ng Freshmen $0 $200 $400 $600 $800 $1,000 $1,200 $1,400 $1,600 $1,800 Sophomores Juniors Seniors Graduate students Supplies
- 41. Shoes Clothing Textbooks Dorm furnishings Electronics Chart 9 Back to College Spending by Students Fall 2005 SOURCE: National Retail Federation. Classification Figure 13–9 Illustration of a Stacked Column Chart Figure 13–10 Illustration of a 100 Percent Stacked Column Chart 1999 0% 20% 40%
- 42. 60% 80% 100% 2000 2001 2002 2003 20052004 Chart 10 Software Reliability: Common Vulnerabilities and Exposures SOURCE: Communications of the ACM June 2006: 58. Year Logic flaws Data reference failures Interface failures Input/output errors OS Interface flaws 2 Theophilus B. A. Addo, “The Effects of Dimensionality in Computer Graphics,” Journal of Business Communication 31 (1994): 253. Lesikar−Flatley−Rentz: Business Communication: Making Connections in a Digital World, 11th Edition
- 43. IV. Fundamentals of Report Writing 13. Graphics © The McGraw−Hill Companies, 2008 424 PART 4 Fundamentals of Report Writing Figure 13–11 Illustration of a Pictograph 0 5 20 25 30 35 40 45 France Country Av er ag
- 44. e Nu m be r o fD ay s Chart 11 Vacation Days Allotted per Year to Working Adults in Select Countries Worldwide, 2006 Germany UK Canada Australia US 10 15 SOURCE: Communications of the ACM June 2006: 58. Pictographs A pictograph is a bar or column chart that uses bars made of pictures. The pictures are typically drawings of the items being compared. For example, the number of vacation days in selected countries, instead of being shown by ordinary bars (formed by straight lines), could be shown by bar drawings of harmrmocks. This type of column chart is a pictograph (see Figure 13–11).
- 45. In constructing a pictograph, you should follow the procedures you used in con- structing bar and column charts and two special rules. First, you must make all the pic- ture units equal in size. That is, you must base the comparisons wholly on the number of picture units used and never on variation in the areas of the units. The reason for this rule is obvious. The human eye is grossly inadequate when comparing geometric designs that vary in more than one dimension. Second, you should select pictures or symbols that fi t the information to be illustrated. In comparing the cruise lines of the world, for example, you might use ships. In comparing computers used in the world’s major countries, you might use computers. The meaning of the drawings you use must be immediately clear to the readers. Pie Charts The most frequently used chart in comparing the subdivisions of wholes is the pie chart (see Figure 13–12). As the name implies, pie charts show the whole of the information being studied as a pie (circle), and the parts of this whole as slices of the pie. The slices may be distinguished by labeling and color or cross-hatching. A single slice can be emphasized by exploding—pulling out—a piece. Because it is hard to judge the values of the slices with the naked eye, it is good to include the percentage values within or near each slice. Also, placing a label near each slice makes it quicker for the reader to understand the items being compared than using a legend to
- 46. identify components. A good rule to follow is to begin slicing the pie at the 12 o’clock position and then to move around clockwise. It is also good to arrange the slices in descending order from largest to smallest. Line Charts Line charts are useful in showing changes of information over time. For example, changes in prices, sales totals, employment, or production over a period of years can be shown well in a line chart. • Pictographs are bar or column charts made with pictures. • Pie charts show subdivisions of a whole. • In constructing pictographs, follow the procedure for making bar and column charts, plus two special rules. • Line charts show changes over time. Lesikar−Flatley−Rentz: Business Communication: Making Connections in a Digital World, 11th Edition
- 47. IV. Fundamentals of Report Writing 13. Graphics © The McGraw−Hill Companies, 2008 CHAPTER 13 Graphics 425 In constructing a line chart, you draw the information to be illustrated as a continu- ous line on a grid. The grid is the area in which the line is displayed. It is scaled to show time changes from left to right across the chart (X-axis) and quantity changes from bottom to top (Y-axis). You should mark clearly the scale values and the time periods. They should be in equal increments. You also may compare two or more series on the same line chart (see Figure 13–13). In such a comparison, you should clearly distinguish the lines by color or form (dots, dashes, dots and dashes, and the like). You should clearly label them on the chart or by a legend somewhere in the chart. But the number of series that you may compare on one line chart is limited. As a practical guide, the maximum number is fi ve to eight. It is also possible to show parts of a series by use of an area chart. Such a chart, however, can show only one series. You should construct this type of chart, as shown in Figure 13–14, with a top line representing the total of the series. Then, starting from the base, you should cumulate the parts, beginning with the largest and ending with the
- 48. smallest. You may use cross-hatching or coloring to distinguish the parts. Line charts that show a range of data for particular times are called variance or hi-lo charts. Some variance charts show high and low points as well as the mean, median, or mode. When used to chart daily stock prices, they typically include closing price in addition to the high and low. When you use points other than high and low, be sure to make it clear what these points are. Ho ur s pe r p er so n SOURCE: Fortune 4 September 2003: 135. 1997 2003 2005 2007 0 50 100 150 200
- 49. 250 300 1999 2001 Year Chart 13 Time Spent Annually on Various Media Consumer internet Newspapers Music Videogames Magazines Books Home video Box office Projected Figure 13–13 Illustration of a Line Chart Natural emissions, 33.30% Man-made emissions, 33.30% Natural recycling of existing deposits1,
- 50. 33.30% Chart 12 Mercury Rising: Contributions to Global Mercury Emissions 1From natural and man-made sources recycled by winds and ocean currents. SOURCE: U.N. Environment Programme Global Mercury Assessment; Environmental Protection Agency. Figure 13–12 Illustration of a Pie Chart • The line appears on a grid (a scaled area) and is continuous. • Two or more lines may appear on one chart. • Area charts show the makeup of a series. • Variance charts show high and low points— sometimes more. Footnote: The Wall Street Journal, 20 April 2006: A10. Lesikar−Flatley−Rentz:
- 51. Business Communication: Making Connections in a Digital World, 11th Edition IV. Fundamentals of Report Writing 13. Graphics © The McGraw−Hill Companies, 2008 426 PART 4 Fundamentals of Report Writing Ball in orange: $33 and above Balls in blue: $25 and below Chart 15 Golf Ball Characteristics with Price Soft cover/ firm core 10. Maxfli Noodle ($20) 11. Maxfli Revolution ($33) 12. Maxfli XS Tour ($18) 13. Nike Power Dist. Feel-Speed ($16) 14. Nike Power Dist. Ti Velocity ($16) 15. Nike Tour Accuracy ($40) 16. Nike Tour Accuracy DD ($40) 17. Nike Tour Accuracy TW ($40) 18. Pinnacle Gold Distance ($13) 19. Pinnacle Gold Distance Lady ($11) 20. Pinnacle Power Core Dist. ($15) 21. Pinnacle Power Core Feel ($15) 22. Precept Extra Distance ($24) 23. Precept Laddie ($21)
- 52. 24. Precept MC Lady ($20) 25. Precept Tour Premium LS ($35) 26. Slazenger Black Label ($39) 27. Srixon Hi-Brid Tour ($36) 28. Strata Tour Professional ($24) 29. Strata Tour Ultimate ($38) 30. Strata Tour Ultimate 2 ($37) 31. Titleist NXT Distance ($25) 32. Titleist NXT Tour ($25) 33. Titleist Pro V1 ($45) 34. Titleist Professional ($38) 35. Top-Flite XL 3000 Super Feel ($18) 36. Top-Flite XL 3000 Super Long ($18) 37. Top-Flite XL 3000 Super Spin ($18) 38. Top-Flite XL 3000 S. Straight ($18) 39. Wilson Staff Pro Dist. Straight ($23) 40. Wilson Staff Pro Dist. Women’s ($22) 41. Wilson Staff True Distance ($40) 42. Wilson Staff True Tour ($40) Index of balls (Typical “street” price a dozen) 1. Callaway CB1 Blue ($25) 2. Callaway CB1 Red ($25) 3. Callaway CTU 30 Blue ($40) 4. Callaway CTU 30 Red ($40) 5. Callaway HX Blue ($44) 6. Callaway HX Red ($44) 7. Dunlop Advanced Ti ($9) 8. Dunlop LoCo ($17) 9. Maxfli A10 ($40) SOFT FIRM
- 53. COVER HARDNESS CO M PR ES SI ON Firm cover/ firm core Soft cover/ soft core Firm cover/ soft core 29 27 28 15 30 40 32 33 1 25 16 5
- 55. 31 24 11 21 LO W HI GH 23 4 Figure 13–15 Illustration of a Scatter Diagram Chart 14 Individual Tax Filing Method Used and Projected 2004 to 2012 Re tu rn s in M ill io
- 56. ns Year SOURCE: Internal Revenue Service. 200620052004 0 60 20 40 80 100 120 160 140 2007 2008 2009 2010 2011 2012 Total individual electronic returns Total individual paper returns Projected Figure 13–14
- 57. Illustration of an Area Chart SOURCE: Golf Digest July 2002: 61. Lesikar−Flatley−Rentz: Business Communication: Making Connections in a Digital World, 11th Edition IV. Fundamentals of Report Writing 13. Graphics © The McGraw−Hill Companies, 2008 CHAPTER 13 Graphics 427 Scatter Diagrams Scatter diagrams are often considered another variation of the line chart. Although they do use X and Y axes to plot paired values, the points stand alone without a line drawn through them. For example, a writer might use a scatter diagram in a report on digital cameras to plot values for price and resolution of several cameras. While clustering the points allows users to validate hunches about cause and effect, they can only be interpreted for correlation—the direction and strength relationships. The points can reveal positive, negative, or no relationships. Additionally, by examining
- 58. the tightness of the points, the user can see the strength of the relationship. The closer the points are to a straight line, the stronger the relationship. In Figure 13–15, the paired values are Cover Hardness and Compression. Maps You also may use maps to communicate quantitative as well as physical (or geographic) information. Statistical maps are useful primarily when quantitative information is to be compared by geographic areas. On such maps, the geographic areas are clearly out- lined, and some graphic technique is used to show the differences between areas (see Figure 13–16). Quantitative maps are particularly useful in illustrating and analyzing complex data. Traffi c patterns on a website could be mapped as well as patterns in a retail store. Physical or geographic maps (see Figure 13–17) can show distributions as • Scatter diagrams show direction and strength of paired values. • Maps show quantitative and geographic information. Chart 16 Sex Ratio of the Total U.S. Population: 2004 Data Classes Males/100 Females
- 59. 100.3–103.2 97.7–99.3 95.7–97.3 93.6–95.4 88.5–93.2 SOURCE: U.S. Census Bureau, 2004 American Community Survey. Figure 13–16 Illustration of a Map (quantitative) Lesikar−Flatley−Rentz: Business Communication: Making Connections in a Digital World, 11th Edition IV. Fundamentals of Report Writing 13. Graphics © The McGraw−Hill Companies, 2008 428 PART 4 Fundamentals of Report Writing well as specifi c locations. Of the numerous techniques available to you, these are the most common: • Showing differences of areas by color, shading, or cross- hatching is perhaps the most popular technique (see Figure 13–16). Of course, maps using this technique must have a legend to explain the quantitative meanings of the various colors,
- 60. cross-hatchings, and so forth. • Graphics, symbols, or clip art may be placed within each geographic area to depict the quantity for that area or geographic location. • Placing the quantities in numerical form within each geographic area is another widely used technique. Combination Charts Combination charts often serve readers extremely well by allowing them to see rela- tionships of different kinds of data. The example in Figure 13– 18 shows the reader the price of stock over time (the trend) as well as the volume of sales over time (compari- sons). It allows the reader to detect whether the change in volume affects the price of the stock. This kind of information would be diffi cult to get from raw data. Three-Dimensional Graphics Until now you have learned that three-dimensional graphs are generally undesirable. However, we have mostly been referring to the three- dimensional effect applied to • Here are some specifi c instructions for statistical maps. Figure 13–17 Illustration of a Map (Physical) • With multiple variables, 3D graphics can help
- 61. readers understand the data better. • Sometimes a combination of chart types is effective. Lesikar−Flatley−Rentz: Business Communication: Making Connections in a Digital World, 11th Edition IV. Fundamentals of Report Writing 13. Graphics © The McGraw−Hill Companies, 2008 CHAPTER 13 Graphics 429 graphics with two variables. But when you actually have three or more variables, pre- senting them in three dimensions is an option. It is the difference between the raised pie chart versus the ball. Adding a third dimension to a pie chart by “raising” it (includ- ing a shadow) will not enhance its information value, but if you actually have three- dimensional data, putting it in the form of a ball will enable your readers to see it from multiple perspectives and gain additional information. In fact, Francis Crick, a Nobel prize-winner for discovering the structure of DNA, once revealed it was not until he
- 62. and his collaborators took a sheet of paper, cut it, and twisted it that they understood the confi guration of DNA. Today we have sophisticated statistics, graphics, and data mining tools to help us fi lter and see our data from multiple perspectives. These three-dimensional tools are beginning to make their way from science labs into business settings. Several factors seem to be driving the trend. Businesses large and small are collecting and attempting to analyze extremely large amounts of detailed data. They are analyzing not only their own data but also data on their competitors. And advances in hardware, software, and web-based applications are making it easier to graphically represent both quantitative and qualitative data. Although 3D graphics help writers display the results of their data analysis, they change how readers look at information and may take some time getting used to. These tools enable users both to see data from new perspectives and to interact with it. They allow users to free themselves from two dimensions and give them ways to stretch their insights and see new possibilities. These graphics can help businesses make time- ly decisions through leveraging their corporate information assets. Figure 13–19 shows a three-dimensional visual thesaurus for the word graph. The color of its node and the distance of the node from the centroid refl ect the degree of similarity between the node and the centroid, something you cannot get from a tradi- tional thesaurus. Here the closer the synonym to graph, the
- 63. redder or hotter it is and the more similar to the word. In this case chart is hotter than drawing, and drawing is hotter than outline. Using 3-D graphic tools clearly has a place and use. They are especially good for helping to analyze large data sets with multiple variables, query them, and interpret them. In deciding whether to use a three-dimensional representation such as this one or a two-dimensional one such as one you might see at <http://www.visualthesaurus. com>, you need to consider your audience, the context, and goal of your communica- tion. Overall, multidimensional presentation on paper is diffi cult; multiple representa- tions can be made from separate two-dimensional views, but not always effectively. MayJun Jul Aug Sep Oct Nov Dec 06 Feb Mar Apr –20% Volume ©BigCharts.com DE Weekly 5/24/06 DJIA –10% +20% +10% +0%
- 64. +30% +40% +50% M ill io ns 30 20 10 0 SOURCE: Big Charts 24 May 2006. Figure 13–18 Illustration of a Combination Chart, Comparing the Dow Jones Average to the volume and Weekly Change Range of Deere Common Stock • 3D graphics facilitate analyzing large data sets.
- 65. • 3D graphics facilitate seeing data from a new perspective. • Tools allow users to interact with their data. Lesikar−Flatley−Rentz: Business Communication: Making Connections in a Digital World, 11th Edition IV. Fundamentals of Report Writing 13. Graphics © The McGraw−Hill Companies, 2008 430 PART 4 Fundamentals of Report Writing If the document is being presented online or digitally where the reader can rotate it to see perspectives, it is likely to be much more effective with a larger number of readers. Writers should take care to use three-dimensional graphics appropriately. Photographs Cameras are everywhere today. If we do not have them in our phones, we might have them in a credit card size or even smaller. And free and for-fee photos are readily available on the Internet, too. In documents, photos can serve useful communication
- 66. purposes. They can be used to document things and events as well as show products, processes, or services. You could use the photo in Figure 13–20 as a metaphor for the concept of a hole in a company’s computer security (someone getting in) or the loss of corporate intelligence (something getting out). Today photos, like data-generated graphics, can easily be manipulated. A writer’s job is to use them ethically, including getting permission when needed and presenting them objectively. Graph Plan Persuasion Chart Map Scheme Drawing Outline Image DiagramFigure 13–19 Illustration of a Three- Dimensional Graphic Figure 13–20
- 67. Illustration of a Photo SOURCE: http://www.wilmascope.org/ Lesikar−Flatley−Rentz: Business Communication: Making Connections in a Digital World, 11th Edition IV. Fundamentals of Report Writing 13. Graphics © The McGraw−Hill Companies, 2008 CHAPTER 13 Graphics 431 Other Graphics The types of graphics discussed thus far are the ones most commonly used. Other types also may be helpful. Diagrams (see Figure 13–21) and drawings (see Figure 13–22) may help simplify a complicated explanation or description. Icons are another useful type of graphic. You can create new icons and use them consistently, or you can draw from an existing body of icons with easily recognized meanings, such as . Even carefully selected cartoons can be used effectively. Video clips and animation are now used in electronic documents. See the text website for some examples. For all practical purposes, any graphic is acceptable as long as it helps
- 68. communicate the true story. The possibilities are almost unlimited. Visual Integrity3 In writing an objective report, you are ethically bound to present data and visuals in ways that enable readers to interpret them easily and accurately. By being aware of some of the common errors made in presenting graphics, you learn how to avoid them as well as how to spot them in other documents. Even when errors are not deliberately created to deceive a reader, they cause loss of credibility with the reader—casting doubt on the document as well as on other work you have completed. Both data- generated graphics and visual graphics can misrepresent information. Writers need to be diligent in applying high quality standards when using them. Blind Spot: No visibility for 30 feet behind truck. Stay back 20–25 car lengths. Blind Spot: Leave 4 car lengths between vehicles Blind Spot: Pass through, don’t linger Blind Spot: Don’t linger 3 For an excellent expanded discussion of graphic errors, see Gerald E. Jones, How to Lie with Charts (San Jose, CA: iUniverse.com, 2001).
- 69. Figure 13–21 Illustration of a Diagram Figure 13–22 Illustration of a Drawing • Other graphics available to you are diagrams, drawings, and even cartoons. • Business writers are ethically bound to present data that readers can extract easily and accurately. SOURCE: U.S. Department of Transportation, Share the Road Safely Program. Illustration by Zeke Smith © 2003. Lesikar−Flatley−Rentz: Business Communication: Making Connections in a Digital World, 11th Edition IV. Fundamentals of Report Writing 13. Graphics © The McGraw−Hill Companies, 2008
- 70. 432 PART 4 Fundamentals of Report Writing Data-generated Graphs Two categories of common errors in using graphs are errors of scale and errors of for- mat. Another more diffi cult category of error is inaccurate or misleading presentation of context. Errors of scale include problems with uniform scale size, scale distortion, and zero points. You need to be sure that all the dimensions from left to right (X axis) are equal, and the dimensions from the bottom to the top (Y axis) are equal. Otherwise, as you see here, an incorrect picture would be shown. • Common errors are errors of scale, format, and context presentation. 200620042003 0 60 40 20 80 100 120
- 71. 140 2005 2007 200620042003 0 100 80 20 110 120 130 140 2005 2007 200620042003 0 60 40 20 80 100 120
- 72. 140 2005 2007 200620042003 0 60 40 20 80 100 120 140 2005 2007 Scale distortion occurs when a graphic is stretched excessively horizontally or verti- cally to change the meaning it conveys to the reader. Expanding a scale can change the appearance of the line. For example if the values on a chart are plotted one-half unit apart, changes appear much more suddenly. Determining the distances that present the most accurate picture is a matter of judgment. Notice the different looks of the graphic show here when stretched vertically and horizontally. C O M M U N I C A T I O N M A T T E R S Words of Wisdom
- 73. Students must be sensitized in the importance of pictures that accompany written messages to the same extent that they are sensitized to the importance of nonverbal communication that accompanies messages. Shirley Kuiper, The University of South Carolina Rosemary Booth, The University of North Carolina at Charlotte Charles D. Bodkin, The University of North Carolina at Charlotte Shirley Kuiper, Rosemary Booth, and Charles D. Bodkin, “The Visual Portrayal of Women in IBM’s Think: A Longitudinal Analysis,” Journal of Business Communication 35 (1998): 259. Lesikar−Flatley−Rentz: Business Communication: Making Connections in a Digital World, 11th Edition IV. Fundamentals of Report Writing 13. Graphics © The McGraw−Hill Companies, 2008 CHAPTER 13 Graphics 433 Software programs enable writers to create a wide variety of graphics from small to
- 74. huge data sets. Errors of format come in a wide variety. Some of the more common ones include choice of wrong chart type, distracting use of grids and shading, misuse of typeface, and problems with labels. If a company used pie charts to compare expenses from one year to the next, readers might be tempted to draw conclusions that would be inappro- priate because, although the pies both represent 100 percent of the expenses, the size of the business and the expenses may have grown or shrunk drastically in a year’s time. If one piece of the pie had been colored or shaded in such a way as to make it stand out from the others, it could mislead readers. And, of course, small type or unlabeled, inconsistently labeled, or inappropriately labeled graphics clearly confuse readers. You need to be careful to present graphics that are both complete and accurate. Another ethical dilemma is accurately presenting context. Politicians are often de- liberately guilty of framing the issue to suit their cause. Business writers can avoid this deception both by attempting to frame the data objectively and by presenting the data 200520042003 0 600 400
- 75. 200 800 1000 1200 1400 2006 2007 200520042003 1300 1320 1310 1330 1340 1350 2006 2007 200520042003 0 1300 1250 1350 2006 2007 Finally, another type of scale error is violating the zero beginning of the series. For
- 76. accuracy, you should begin the scale at zero. But when all the information shown in the chart has high values, it is awkward to show the entire scale from zero to the highest value. For example, if the quantities compared range from 1320 to 1350 and the chart shows the entire area from zero to 1350, the line showing these quantities would be almost straight and very high on the chart. Your solution in this case is not to begin the scale at a high number (say 1300), for this would distort the information, but to begin at zero and show a scale break. Realize, however, that while this makes the differences easier to see, it does exaggerate the differences. You can see this here. Lesikar−Flatley−Rentz: Business Communication: Making Connections in a Digital World, 11th Edition IV. Fundamentals of Report Writing 13. Graphics © The McGraw−Hill Companies, 2008 434 PART 4 Fundamentals of Report Writing with the reader in mind. For example, one might look at the cost of attending college for the past 30 years. A line chart of the actual dollar cost over the years would show
- 77. a clear upward trend. However, to present the costs without factoring in infl ation dur- ing that 30-year period would distort the results. In Figure 13– 23, you can see that the actual cost of college tuition and fees in dollars adjusted for infl ation would show costs that are lower or equal to today’s costs. Visual Graphs Visual graphs, too, need to be used ethically. Writers need to be careful when choosing the information to represent and the visual elements to represent it. One area writers C O M M U N I C A T I O N M A T T E R S Practicing Visual Ethics As you have learned in this chapter, graphics can serve several useful purposes for the business writer. However, the writer needs to be accountable in using graphics to present images that in the eye and mind of the reader communicate accurately and completely. To do this, the careful writer pays attention to both the design and content of the graphic. These are particularly important, for readers often skim text but read the graphics. Research shows that people remember im- ages much better and longer than text. The following guides will help you in evaluating the graphics you use: • Does the visual’s design create accurate expectations? • Does the story told match the data? • Is the implied message congruent with the actual message?
- 78. • Will the impact of the visual on your audience be appropriate? • Does the visual convey all critical information free of distortion? • Are the data depicted accurately? Adapted from Donna S. Kienzler, “Visual Ethics,” Journal of Business Communication 34 (1997): 171–87. Tu iti on 198519801975 2005 $0 $2,000 $4,000 $6,000 $8,000 $10,000 1990 1995 2000 Chart 23 Average Annual Resident Undergraduate Tuition and Required Fees Constant & Current Dollars, Academic Years 1975 to 2005
- 79. Academic Year Current dollars Constant dollars SOURCE: Minnesota Higher Education Services Office, 2006. Figure 13–23 Illustration of Accuracy of Content Lesikar−Flatley−Rentz: Business Communication: Making Connections in a Digital World, 11th Edition IV. Fundamentals of Report Writing 13. Graphics © The McGraw−Hill Companies, 2008 CHAPTER 13 Graphics 435 need to watch is appropriate selection. Are people or things over- or underrepresented? Are the numbers of men and women appropriate for the context? Are their ages ap- propriate? Is ethnicity represented appropriately? Have colors been used appropriately and not to evoke or manipulate emotions? What about volume and size? Are the num-
- 80. ber of visuals and size appropriate for the emphasis the topic deserves? Are visuals presented accurately, free of distortion or alteration? Have photos been cropped to be consistent with the context? Writers need to carefully select and use visual graphs to maintain high integrity. PLACING AND INTERPRETING THE GRAPHICS For the best communication effect, you should place each graphic near the place where it is covered in writing. Exactly where on the page you should place it, however, should be determined by its size. If the graphic is small, you should place it within the text that discusses it. If it is a full page, you should place it on the page following the fi rst reference to the information it covers. Some writers like to place all graphics at the end of the report, usually in the appen- dix. This arrangement may save time in preparing the report, but it does not help the readers. They have to fl ip through pages every time they want to see a graphic. Com- mon sense requires that you place graphics in such a way as to help readers understand the report. Sometimes you may need to include graphics that do not fi t a specifi c part of the report. For example, you may have a graphic that is necessary for completeness but is not discussed in the report. Or you may have summary charts or tables that apply to the entire report but to no specifi c place in it. When such graphics are appropriate, you
- 81. should place them in the appendix. And you should refer to the appendix somewhere in the report. Graphics communicate most effectively when the readers see them at the right place in the report. Thus, you should refer the readers to them at the right place. That is, you should tell the readers when to look at a graphic and what to see. Of the many wordings used for this purpose, these are the most common: . . . , as shown in Figure 4, . . . . . . . , indicated in Figure 4, . . . . . . . , as a glance at Figure 4 reveals, . . . . . . (see Figure 4) . . . . If your graphic is carrying the primary message, as in a detailed table, you can just make an incidental reference to the information in the graphic, as in “Our increased sales over the last three years . . . .” However, if the words are carrying the primary message such as in the bar chart in Figure 13–14, you might start with a reference to the chart followed closely by a thorough interpretation. One good mantra to use is GEE, standing for generalization, example, and exception.4 You’ll start with a summary statement that reveals the big picture. In the case of Figure 13–14, you might say, “As Figure 14 shows, the num- ber of individuals fi ling tax returns electronically will grow from 65 million today to
- 82. 90 million in 2012.” After presenting the fi gure, you’ll give one or more supporting examples that call your readers’ attention to key fi ndings. Then you will give the ex- ception to the general trend, if there is one—for example, “In most years the increase is expected to be four million; however, in the fi rst year it will be fi ve million when easy-to-use web-based tax preparation software fi rst becomes available.” Your readers will appreciate well-chosen, well-designed, and well-explained graphics, and you will achieve powerful communication results. • Place the graphics near the fi rst place in the text in which you refer to them. • Placing graphics at the end of the report does not help the readers. • Graphics not discussed in the report belong in the appendix. • At the right place, incidentally invite the readers to look at the graphics. • Interpret using a generalization, example, exception (GEE) strategy.
- 83. 4 Jane E. Miller, “Implementing ‘Generalization, Example, Exceptions (GEE),’ ” The Chicago Guide to Writing about Numbers: The Effective Presentation of Quantitative Information (Chicago: The University of Chicago Press, 2004) 265. Lesikar−Flatley−Rentz: Business Communication: Making Connections in a Digital World, 11th Edition IV. Fundamentals of Report Writing 13. Graphics © The McGraw−Hill Companies, 2008 436 PART 4 Fundamentals of Report Writing 1. Because graphics are a part of the communication in a report, you should plan for them. • But remember that they supplement the writing; they do not replace it. • Use them wherever they help communicate the report information. 2. Construct each graphic carefully, following these general instructions: • Give each the size and arrangement that its contents and
- 84. importance justify. • Choose a readable type. New Clear Type fonts such as Calibri or Cambria improve on-screen readability. • Use rules, borders, and color when they help. • Use clip art and background appropriately. • Number the graphics consecutively by type. • Construct topic titles for them using the fi ve Ws (who, what, where, when, why) and one H (how) as a checklist. Alternatively, use the main message as a talking heading. • Use footnotes and acknowledgments when needed, placing them below the graphic. 3. Choose textual graphics to display data that are largely text based. • Use general-purpose tables for information that is broad in scope. • Use special-purpose tables for information that is specifi c in scope. • Use leaderwork or tabulations for short arrangement of data. • Use pull quotes to emphasize a key idea. • Use bullet lists to set off points.
- 85. • Use fl owcharts and process charts to show activity sequences. 4. In selecting a graphic, consider these primary uses of each: • Simple bar or column chart—shows quantity comparisons over time or over geographic distances. • Clustered bar or column chart—shows two or three quantities on one chart. • Bilateral column chart—shows plus and minus differences and is especially good for showing percentage changes. • Stacked or subdivided bar chart—used to compare differences in the division of wholes. • Pictograph—shows quantitative differences in picture form. • Pie chart—used to show how wholes are divided. • Line chart—useful in showing changes over time. Variations include belt charts, surface charts, and variance charts. • Scatter diagram—compares pairs of values. • Map—shows quantitative and physical differences by area. • Combination chart—used to show relationships between separate data sets. • Three-dimensional graphic—used to analyze and interpret
- 86. large data sets with three or more variables. • Photograph—used to document things and events or show products, processes, and services. Apply other graphics to serve special needs: • Diagrams and drawings. • Icons. SUMMARY BY LEARNING OBJECTIVES 1Determine which parts of your report should be communicated by graphics and where in the report the graphics should appear. 2Explain the general mechanics of constructing graphics— size, layout, type, rules and borders, color and cross-hatching, clip art, background, numbering, titles, title placement, and footnotes and acknowledgments. 3Construct textual graphics such as tables, pull quotes, fl owcharts, and process charts. 4Construct and use visual graphics such as
- 87. bar charts, pie charts, scatter diagrams, and maps. Lesikar−Flatley−Rentz: Business Communication: Making Connections in a Digital World, 11th Edition IV. Fundamentals of Report Writing 13. Graphics © The McGraw−Hill Companies, 2008 • Cartoons. • Video clips and animation. 5. Visual integrity applies to both data-generated graphics and visuals. • To present data objectively avoid these common errors : — Errors of scale—no uniform scale size, scale distortion, missing zero point. — Errors of format—wrong chart type, distracting use of grids and shading, misuse of typeface, and problems with labels. — Errors of context presentation. • Visuals need special attention to the following:
- 88. — Selection. — Color. — Volume and size. — Distortion, dropping, and alterations. 6. Place and interpret graphics effectively. • Place graphics near to the text part they illustrate. • Place in the appendix those that you do not discuss in the text. • Invite the readers to look at them at the appropriate place. • Interpret using a generalization, example, exception strategy. 5Avoid common errors and ethical problems when constructing and using graphics. 6Place and interpret graphics effectively. C R I T I C A L T H I N K I N G Q U E S T I O N S CHAPTER 13 Graphics 437 1 For the past 20 years, Professor Clark Kupenheimer has required that his students include fi ve graphics in the long, formal report he assigns them to prepare. Evaluate this requirement. 2 Because it was easier to do, a report writer prepared each of the graphics on a full page. Some of these
- 89. graphics were extremely complex; some were very simple. Comment on this practice. 3 A report has fi ve maps, four tables, one chart, one dia- gram, and one photograph. How would you number these graphics? 4 How would you number these graphics in a report: seven tables, six charts, nine maps? 5 Discuss the techniques that may be used to show quan- titative differences by area on a statistical map. 6 Select data that are ideally suited for presentation in three dimensions. Explain why use of a data visualiza- tion is good for this case. 7 Discuss the advantages and disadvantages of using pictographs. 8 Find a graph that uses scale breaks. Discuss the possible effects of its use on the reader. 9 Find a graphic with errors in format. Tell how you would correct the errors to present the chart’s data more clearly to the reader. 10 “I have placed every graphic near the place I write about it. The reader can see the graphic without any ad- ditional help from me. It just doesn’t make sense to di- rect the reader’s attention to the graphics with words.” Evaluate this comment. C R I T I C A L T H I N K I N G E X E R C I S E S 1 Construct a complete, concise title for a bar chart show-
- 90. ing annual attendance at home football (or basketball, or soccer) games at your school from 2000 to the present. 2 The chart prepared in Question 1 requires an explana- tion for the years 2005 to the present. In each of those years, one extra home game was played. Explain how you would provide the necessary explanation. 3 For each of the areas of information described on the following page, which form of graphic would you use? Explain your decision. Lesikar−Flatley−Rentz: Business Communication: Making Connections in a Digital World, 11th Edition IV. Fundamentals of Report Writing 13. Graphics © The McGraw−Hill Companies, 2008 438 PART 4 Fundamentals of Report Writing a. Record of annual sales for the Kenyon Company for the past 20 years. b. Comparison of Kenyon Company sales, by product, for this year and last year. c. Monthly production of the automobile industry in units.
- 91. d. Breakdown of how the average middle-income fam- ily in your state (or province) disposes of its income dollar. e. How middle-income families spend their income dol- lar as compared with how low-income families spend their income dollar. f. Comparison of sales for the past two years for each of the B&B Company’s 14 sales districts. The districts cover all 50 states, Canada, and Puerto Rico. g. National production of trucks from 1950 to present, broken down by manufacturer. h. Relationship between list price and gas mileage of alternative and gasoline-fueled cars. 4 For each of the following sets of facts, (a) determine the graphic (or graphics) that would be best, (b) defend your choice, and (c) construct the graphic. a. Average (mean) amount of life insurance owned by Fidelity Life Insurance Company policyholders. Classifi cation is by annual income. Income Average Life Insurance Under $30,000 $ 15,245 $30,000–34,999 24,460
- 92. $35,000–39,999 36,680 $40,000–44,999 49,875 $45,000–49,999 61,440 $50,000 and over 86,390 b. Profi ts and losses for Whole Foods Stores, by store, 2003–2007, in dollars. Store Year Able City Baker Charleston Total 2003 234,210 132,410 97,660 464,280 2004 229,110 –11,730 218,470 435,850 2005 238,430 –22,410 216,060 432,080 2006 226,730 68,650 235,510 530,890 2007 230,080 91,450 254,820 576,350 c. Share of real estate tax payments by ward for Bigg City, 2002 and 2007, in thousands of dollars. 2002 2007 Ward 1 17.1 21.3 Ward 2 10.2 31.8 Ward 3 19.5 21.1
- 93. Ward 4 7.8 18.2 City total 54.6 92.4 d. Percentage change in sales by employee, 2006–2007, District IV, Abbott, Inc. Employee Percentage Change Joan Abraham �7.3 Helen Calmes �2.1 Edward Sanchez �7.5 Clifton Nevers �41.6 Wilson Platt �7.4 Clara Ruiz �11.5 David Schlimmer �4.8 Phil Wirks �3.6 5 The basic blood types are O, A, B, and AB. These can be either positive or negative. With some basic research, determine what percentage of each type people in the United States have. Choose an appropriate graph type and create it to convey the data. 6 Through your research, fi nd the approximate milligrams of caffeine in the following items and create an appro-
- 94. priate graphic for Affi liated Food Products, Inc., to il- lustrate your fi ndings. 5-oz. cup of coffee (drip brewed) 7-oz. glass of iced tea 6-oz. glass of soda with caffeine 1-oz. dark chocolate, semisweet 7 Choose fi ve or six outdoor summer sport activities. In a graphic identify the activity and whether it affects car- diovascular, arms, legs, back, or abdominals. You can assume these activities can affect more than one fi tness zone. You work for the Parks and Recreation Depart- ment of a city of your choosing. Lesikar−Flatley−Rentz: Business Communication: Making Connections in a Digital World, 11th Edition IV. Fundamentals of Report Writing 12. Long, Formal Reports © The McGraw−Hill Companies, 2008 c h a p t e r t w e l v e Long, Formal Reports
- 95. L E A R N I N G O B J E C T I V E S Upon completing this chapter, you will be able to construct long, formal reports for important projects. To reach this goal, you should be able to 1 Describe the roles and contents and construct the prefatory parts of a long, formal report. 2 Organize the introduction of a long report by considering the likely readers and selecting the appropriate contents. 3 Prepare the body of a long, formal report by applying the advice in Chapter 10 and in other chapters. 4 Determine, based on the report’s purpose, the most effective way to end a report: a summary, a conclusion, a recommendation, or a combination of the three. 5 Describe the role and content of the appendix and bibliography of a report. 6 Prepare a structural coherence plan for a long, formal report. Lesikar−Flatley−Rentz: Business Communication:
- 96. Making Connections in a Digital World, 11th Edition IV. Fundamentals of Report Writing 12. Long, Formal Reports © The McGraw−Hill Companies, 2008 374 PART 4 Fundamentals of Report Writing I N T R O D U C T O R Y S I T U A T I O N Long, Formal Reports Assume the role of associate director of research, Midwestern Research, Inc. As your title indicates, research is your business. Perhaps it would be more accurate to say that research and reports are your business. Research is your primary activity, of course. But you must present your fi ndings to your customers. The most effi cient way of doing so is through reports. Typical of your work is your current assignment with Nokia, a manufacturer of mobile phones. The sales division of Nokia wants information that will help improve the effectiveness of its salespeople. Specifi cally, it wants answers to the question of what its salespeople can do to improve their performance. The information gathered will be used in revising the curriculum of Nokia’s sales training program. To fi nd the answer to the basic question, you plan to investigate three areas of sales activities: how salespeople use their time, how they fi nd prospects, and how they make sales presentations. You will get this information for two groups of Nokia salespeople: the successful and the unsuccessful. Next, you will compare the information you get from these two groups. You will compare the groups on the three areas of sales activity (the bases of comparison).
- 97. The differences you detect in these comparisons should identify the effective and the ineffective sales practices. Your next task will be to determine what your fi ndings mean. When you have done this, you will present your fi ndings, analyses, conclusions, and recommendations in a report to Nokia. Because Nokia executives will see the report as evidence of the work you did for the company, you will dress the report up. You know that what Nokia sees will affect what it thinks of your work. So you will use the formal arrangement that is traditional for reports of this importance. You will include the con- ventional prefatory pages. You will use headings to guide the readers through the text. And you will use graphics liberally to help tell the report story. If the situation calls for them, you may use appended parts. In other words, you will construct a report that matches the formality and importance of the situation. How to construct such reports is the subject of this chapter. Although not numerous, long, formal reports are highly important in business. They usually concern major investigations, which explains their length. They are usually prepared for high-level executives, which explains their formality. The advice in Chapter 10 about creating reports—determining the purpose, gath- ering information, and choosing a logical structure adapted to the readers—applies to long, formal reports as well. And much of the advice in Chapter 11 about propos- als can apply to long, formal proposals. We will not repeat this advice here. Instead, this chapter will focus on the special components of formal reports, emphasizing their purpose and design. For any given case, you will need to
- 98. decide which of these components to use and whether or not your report or proposal needs different special elements. As always, the facts of the situation and your readers’ preferences should be your guide. ORGANIZATION AND CONTENT OF LONGER REPORTS In determining the structure of longer, more formal reports, you should view your work much as architects view theirs. You have a number of parts to work with. Your task is to design from those parts a report that meets your reader’s needs. The fi rst parts in your case are the prefatory pages. As noted in Chapter 11, the longest, most formal reports contain all of these. As the length of the report and the formality of the situation decrease, certain changes occur. As the report architect, you must decide which arrangement of prefatory parts meets the length and formality re- quirements of your situation. • See Chapters 10 and 11 for advice about developing the contents and structure of reports and proposals. • Long, formal reports are important but not numerous in business. • Needs should determine
- 99. the structure of long, formal reports. • The need for the prefatory parts decreases as reports become shorter and less formal. Lesikar−Flatley−Rentz: Business Communication: Making Connections in a Digital World, 11th Edition IV. Fundamentals of Report Writing 12. Long, Formal Reports © The McGraw−Hill Companies, 2008 CHAPTER 12 Long, Formal Reports 375 To make this decision, you need to know these parts. Thus, we will describe them in the following pages. In addition, we will describe the remaining structure of the long- est, most formal report. As you proceed through these descriptions, it will be helpful to trace the parts through the illustration report at the end of this chapter. In addition, it will help to consult Appendix B for illustrations of page form. For convenience in the following discussion, the report parts are organized by groups. The fi rst group comprises the prefatory parts, the parts
- 100. that are most closely related to the formality and length of the report. Then comes the report proper, which, of course, is the meat of all reports. It is the report story. The fi nal group comprises the appended parts. These parts contain supplementary materials, information that is not essential to the report but may be helpful to some readers. In summary, the presentation follows this pattern: Prefatory parts: Title fl y. Title page. Authorization message. Transmittal message, preface, or foreword. Table of contents and list of illustrations. Executive summary. The report proper: Introduction. The report fi ndings (presented in two or more divisions). Summary, conclusion, or recommendation. Appended parts: Appendix. Bibliography. THE PREFATORY PARTS As you know from preceding discussion, there may be many variations in the prefa- tory parts of a formal report. Even so, the six parts covered in the following pages are generally included in longer reports. Title Fly The fi rst of the possible prefatory report pages is the title fl y (see page 387). It contains only the report title, and it is included solely for reasons of formality. Since the title appears again on the following page, the title fl y is somewhat
- 101. repetitive. But most books have one, and so do most formal reports. Although constructing the title fl y is simple, composing the title is not. In fact, on a per-word basis, the title requires more time than any other part of the report. This is as it should be, for titles should be carefully worded. Their goal is to tell the reader at a glance what the report does and does not cover. A good title fi ts the report like a glove. It covers all the report information tightly. • In determining which prefatory parts to include, you should know their roles and contents. • Thus, they are reviewed in the following pages. • The title fl y contains only the report title. • Construct titles to make them describe the report precisely. A long report can be daunting to readers. Be sure to provide prefatory material that invites them in and makes the key information easy to fi nd.
- 102. Lesikar−Flatley−Rentz: Business Communication: Making Connections in a Digital World, 11th Edition IV. Fundamentals of Report Writing 12. Long, Formal Reports © The McGraw−Hill Companies, 2008 376 PART 4 Fundamentals of Report Writing For completeness of coverage, you should build your titles around the fi ve Ws: who, what, where, when, why. Sometimes how may be important. In some problems, you will not need to use all the Ws. Nevertheless, they serve as a good checklist for completeness. For example, you might construct a title for the report described at the chapter beginning as follows: Who: Nokia What: Sales training recommendations Where: Implied (Nokia regional offi ces) When: 2008 Why: Understood (to improve sales training) How: Based on a 2008 study of company sales activities From this analysis comes this title: “Sales Training Recommendations for Nokia Based on a 2008 Study of Company Sales Activities.” For another example, take a report analyzing Petco’s 2008 advertising campaigns. This analysis would be appropriate:
- 103. Who: Petco What: Analysis of advertising campaigns Where: Not essential When: 2008 Why: Implied How: Not essential Thus, this title emerges: “Analysis of Petco’s 2008 Advertising Campaigns.” Obviously, you cannot write a completely descriptive title in a word or two. Ex- tremely short titles tend to be broad and general. They cover everything; they touch nothing. Even so, your goal is to be concise as well as complete. So you must seek the most economical word pattern consistent with completeness. In your effort to be concise and complete, you may want to use subtitles. Here is an example: “A 2007 Measure of Employee Morale at Florida Human Resource Offi ces: A Study Based on a Survey Using the Semantic Differential.” Title Page Like the title fl y, the title page presents the report title. In addition, it displays informa- tion essential to identifi cation of the report. In constructing your title page, you should include your complete identifi cation and that of the authorizer or recipient of the re- port. You also may include the date of writing, particularly if the date is not in the title. An example of a three-spot title page appears in the report at the end of the chapter. You can see a four-spot arrangement (used when writer and
- 104. reader are within the same organization) in Appendix B. Authorization Message Although not illustrated in the diagram of report structure in Chapter 11 or in the report at the end of this chapter, an authorization message can be a prefatory part. It was not shown in the diagram (Figure 11–1) because its presence in a report is not determined by formality or length but by whether the report was authorized in writing. A report authorized in writing should include a copy of the written authorization. This part usually follows the title page. As the report writer, you would not write the authorization message. But if you ever have to write one, handle it as you would a direct-order message. In the opening, authorize the research. Then cover the specifi c information that the reader needs in order to conduct it. This might include a clear description of the problem, time and money limitations, special instructions, and the due date. Close the message with an appropriate goodwill comment. • As a checklist, use who, what, where, when, why, and sometimes how. • One- or two-word titles are too broad. Subtitles can help conciseness. • The title page displays
- 105. the title, identifi cation of the writer and autho- rizer, and the date. • Include the authorization message if the report was authorized in writing. • Write the authorization message in the direct order: authorization, information about the problem, goodwill close. Lesikar−Flatley−Rentz: Business Communication: Making Connections in a Digital World, 11th Edition IV. Fundamentals of Report Writing 12. Long, Formal Reports © The McGraw−Hill Companies, 2008 CHAPTER 12 Long, Formal Reports 377 Transmittal Message, Foreword, Preface Most formal reports contain a personal message of some kind from the writer to the reader. In most business reports, the transmittal message performs this function. In some cases, particularly where the report is written for a group of readers, a foreword
- 106. or preface is used instead. The transmittal message transmits the report to the reader. In less formal situations, the report is transmitted orally or by email. In more formal situations, a letter does the job. But keep in mind that a written message merely substitutes for a face-to-face meeting. What you write in it is much like what you would say if you were face to face with the reader. This personal touch enhances the communication effect of your report. Because the goal of transmitting the report is positive, you should begin the transmit- tal message directly, without explanation or other delaying information. Your opening words should say, in effect, “Here is the report.” Tied to or following the transmittal of the report, you should briefl y identify the report goal, and you can refer to the authori- zation (who assigned the report, when, why). What else you include in the transmittal message depends on the situation. In gen- eral, you should include anything that would be appropriate in a face-to-face presen- tation. What would you say if you were handing the report to the reader? It would probably be something about the report—how to understand, use, or appreciate it. You might make suggestions about follow-up studies, advise about limitations of the report, or comments about side issues. In fact, you might include anything that helps the reader understand and value the report. Typically, the transmittal message ends with an appropriate goodwill comment. An expression of gratefulness for the assign-
- 107. ment or an offer to do additional research if necessary makes good closing material. When you combine the transmittal message with the executive summary (an accept- able arrangement), you follow the opening transmittal statement with a summary of the report highlights. In general, you follow the procedure for summarizing described in the discussion of the executive summary. Following the summary, you include appropriate talk about the report. Then you end with a goodwill comment. Because the transmittal message is a personal note to the reader, you may write in a personal style. In other words, you may use personal pronouns (you, I, we). In addition, you may write the message in conversational language that refl ects your personality. You may not want to use the personal style in very formal cases, however. For exam- ple, if you were writing a report for a committee of senators or for other high-ranking dignitaries, you might elect to write the transmittal message impersonally. But such instances are rare. In whatever style, you should convey genuine warmth to the contact with another human being. • The transmittal message is a personal message from the writer to the reader. • It substitutes for a face- to-face meeting.
- 108. • Its main goal is to transmit the report. • In addition, it includes helpful comments about the report. The close is goodwill. • A summary follows the opening when the executive summary and the transmittal message are combined. Playing possum doesn’t work anymore, Stephmeyer! I want that report by 5 P.M. or else! SOURCE: Copyright © Tribune Media Services, Inc. All rights reserved. Reprinted with permission. • The transmittal message is usually in personal style. Lesikar−Flatley−Rentz: Business Communication: Making Connections in a Digital World, 11th Edition IV. Fundamentals of Report Writing 12. Long, Formal Reports © The McGraw−Hill Companies, 2008
- 109. 378 PART 4 Fundamentals of Report Writing As noted previously, you may transmit reports to broad audiences in a foreword or a preface. Minor distinctions are sometimes drawn between forewords and prefaces. But for all practical purposes, they are the same. Both are preliminary messages from the writer to the reader. Although forewords and prefaces usually do not for- mally transmit the report, they do many of the other things transmittal messages do. Like transmittal messages, they seek to help the reader appreciate and understand the report. They may, for example, include helpful comments about the report—its use, interpretation, follow-up, and the like. In addition, they frequently contain expres- sions of indebtedness to those helpful in the research. Like transmittal messages, they are usually written in the fi rst person. But they are seldom as informal as some transmittal messages. There is no established pattern for arranging the contents of forewords and prefaces. Table of Contents, List of Illustrations If your report is long enough to need a guide to its contents, you should include a table of contents. This table is the report outline in fi nished form with page numbers. It previews the structure and contents of the report and helps readers fi nd what they most want to read. It is especially helpful to those readers who want to read only a few selected parts of the report—and there can be many such readers
- 110. for a given report or proposal. Because the table of contents is such an important reading support, be sure to follow the specifi c guidelines in Chapter 10 for preparing one. In addition to listing the text headings, the table of contents lists the parts of the report that appear before and after the report proper. Thus, it lists the prefatory parts (though not the title fl y or title page), the appended parts (bibliography, appendix), and the fi gures and tables that illustrate the report. Typically, the fi gures and tables appear as separate listings following the listings reviewed above. See the textbook website for instructions on how to generate a table of contents easily using Word. Executive Summary The executive summary (also called synopsis, abstract, epitome, précis, digest) is the report in miniature. It concisely summarizes whatever is important in the report. For some readers, the executive summary serves as a preview to the report. But it is written primarily for busy executives who may not have time to read the whole report. Perhaps C O M M U N I C A T I O N M A T T E R S A Questionable Example of Effective Reporting “How could I have hired this fellow Glutz?” the sales manager moaned as he read this fi rst report from his new salesper- son: “I have arrive in Detroit. Tomorry I will try to sell them companys here what ain’t never bought nothing from us.”
- 111. Before the sales manager could fi re this stupid fellow, Glutz’s second report arrived: “I done good here. Sold them bout haff a millun dollars wirth. Tomorry I try to sell to them there Smith Company folks what threw out that last feller what sold for us.” Imagine how the sales manager’s viewpoint changed when he read Glutz’s third report: “Today I seen them Smith folks and sole them bout a millun dollars wirth. Also after dinner I got too little sails mountin to bout half a millun dollars. Tomorry I going to do better.” The sales manager was so moved that he tacked Glutz’s reports on the company bulletin board. Below them he posted his note to all the salespeople: “I want all you should reed these reports wrote by Glutz who are on the road doin a grate job. Then you should go out and do like he done.” • For broad audiences, a foreword (or preface) is used. Forewords do not transmit the report—they comment about it. • Include a table of contents when the report is long enough to need a guide to its contents. • The table of contents lists text headings, prefatory parts, appended parts, and fi gures and tables. It gives page numbers. • Follow the guidelines in Chapter 10 for preparing
- 112. a table of contents. • The executive summary summarizes the report. Lesikar−Flatley−Rentz: Business Communication: Making Connections in a Digital World, 11th Edition IV. Fundamentals of Report Writing 12. Long, Formal Reports © The McGraw−Hill Companies, 2008 CHAPTER 12 Long, Formal Reports 379 they can get all they need to know by reading the executive summary. If they need to know more about any part, they can fi nd that part through the table of contents. Thus, they can fi nd out whatever they need to know quickly and easily. You construct the executive summary by reducing the parts of the report in order and in proportion. More specifi cally, you go through the report, selecting whatever is essential. You should include the basic information about the report, such as its origin and purpose. You should include the key facts and all the major analyses of the infor- mation presented. And you should include all the conclusions and recommendations
- 113. derived from these analyses. The fi nished product should be a miniature of the whole, with all the important ingredients. As a general rule, the executive summary is less than an eighth as long as the writing it summarizes. Because your goal is to cut the report to a fraction of its length, much of your suc- cess will depend on your skill in word economy. Loose writing is costly. But in your efforts to be concise, you are more likely to write in a dull style. You will need to avoid this tendency. The traditional executive summary reviews the report in the indirect order (intro- duction, body, conclusion). In recent years, however, the direct order has gained in popularity. This order shifts the conclusions and/or recommendations (as the case may be) to the major position of emphasis at the beginning. Direct- order executive sum- maries resemble the short reports described in Chapter 11. From this direct beginning, the summary moves to the introductory parts and then through the major highlights of the report in normal order. Diagrams of both arrangements appear in Figure 12–1. Whichever arrangement you choose, you will write the executive summary after the report proper is complete. • It includes the report purpose, highlights of the facts, analyses, conclusions, and recommendations—in proportion.
- 114. • Work on writing style in this part. • Either direct or indirect order is appropriate. Figure 12–1 Diagram of the Executive Summary in Indirect and Direct Order Executive summary (in indirect order) Executive summary (in direct order) I I II III IV V V
- 115. I II III IV II III IV V Lesikar−Flatley−Rentz: Business Communication: Making Connections in a Digital World, 11th Edition IV. Fundamentals of Report Writing 12. Long, Formal Reports © The McGraw−Hill Companies, 2008 380 PART 4 Fundamentals of Report Writing THE REPORT PROPER As noted in Chapter 11, the body of most longer reports is written in the indirect order (introduction, body, conclusion). But there are exceptions.