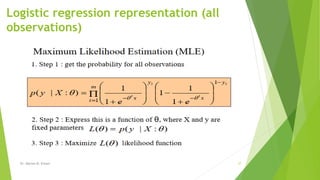
Logistic Regression
Dr. Marwa M. Emam
Faculty of computers and Information
Minia University
Dr. Marwa M. Emam 1
Agenda
 Introduction to Logistic Regression
 Logistic Regression Basics
 Model Representation
 Training the Model
 Examples and Applications
Dr. Marwa M. Emam 2
Overview
Dr. Marwa M. Emam 3
Classification Problem
 A classification problem is a type of supervised machine learning
problem where the goal is to assign data points or instances to one
of several predefined categories or classes.
 In a classification problem, the target variable is categorical, and
the objective is to learn a model that can accurately predict the
class label of new, unseen data points based on their features.
Dr. Marwa M. Emam 4
Classification Problem…
Here are some key characteristics of a classification
problem:
 Categorical Target Variable:
 In a classification problem, the target variable, often referred to as
the "class label," is a categorical variable. It can represent
different classes or categories. For example, in a spam email
classification problem, the classes might be "spam" and "not spam."
Dr. Marwa M. Emam 5
Classification Problem…
Here are some key characteristics of a
classification problem:
 Training Data:
 The model is trained on a dataset where each data point is
associated with a known class label. The dataset includes
features (independent variables) that describe the
characteristics of the data points.
Dr. Marwa M. Emam 6
Classification Problem…
Here are some key characteristics of a
classification problem:
 Model Building: The goal is to build a predictive model that can
generalize from the training data to make accurate predictions for
new, unseen data points.
 This typically involves choosing an appropriate algorithm, learning
the relationships between features and class labels, and
estimating model parameters.
Dr. Marwa M. Emam 7
Classification Problem…
Here are some key characteristics of a
classification problem:
 Prediction: Once the model is trained, it is used to predict the
class labels of new data points based on their feature values.
The output of the classification model is a class label or a
probability distribution over class labels.
Dr. Marwa M. Emam 8
Classification Problem…
Here are some key characteristics of a
classification problem:
 Evaluation: Classification models are evaluated using
various performance metrics, such as accuracy, precision,
recall, F1-score, and the area under the receiver
operating characteristic curve (ROC-AUC). These metrics
help assess the model's ability to make correct
classifications and identify any trade-offs between
different performance aspects.
Dr. Marwa M. Emam 9
Classification Problem…
Here are some key characteristics of a
classification problem:
 Applications: Classification problems are common in a wide range of
applications, including spam detection, sentiment analysis, image
recognition, medical diagnosis, fraud detection, and customer churn
prediction.
 Overall, classification problems are concerned with making informed
decisions based on data and assigning data points to the most
appropriate categories or classes. The choice of the classification
algorithm and the quality of the features used in the model are
critical factors in the success of a classification task.
Dr. Marwa M. Emam 10
Machine Learning Models
Dr. Marwa M. Emam 11
Logistic Regression
 Logistic regression is a statistical and machine learning technique
used for binary classification.
 It is a type of regression analysis that is well-suited for predicting
the probability of a binary outcome, such as yes/no, true/false,
1/0, or success/failure.
 Despite its name, logistic regression is a classification method
rather than a regression method.
Dr. Marwa M. Emam 12
Logistic Regression …
 The primary goal of logistic regression is to model the relationship
between a set of independent variables (features) and a binary
dependent variable (target) in such a way that it can predict the
probability of the binary outcome.
 The outcome is typically coded as 0 (for one class) and 1 (for the other
class).
 The logistic function (also known as the sigmoid function) plays a
crucial role in this process, as it transforms a linear combination of
the independent variables into probabilities between 0 and 1.
Dr. Marwa M. Emam
13
Logistic Regression …
 Supervised Learning:
 Logistic regression is a supervised learning algorithm, which means
it requires labeled training data to learn and make predictions.
 In supervised learning, the algorithm is provided with a dataset in
which each data point has an associated class label, indicating the
category to which it belongs. Logistic regression learns from this
labeled data and, using the patterns it discerns, can subsequently
make predictions for new, unlabeled data points.
Dr. Marwa M. Emam 14
Logistic Regression Objective
 The algorithm aims to assign data points into one of these two
classes by estimating the probability of belonging to the "1" or
"positive" class.
Dr. Marwa M. Emam 15
Logistic Function / Sigmoid function
 To estimate these probabilities, logistic regression uses the
sigmoid function (also known as the logistic function).
 The sigmoid function maps the linear combination of input
features to a value between 0 and 1.
 This mapping ensures that the output represents a valid
probability.
Dr. Marwa M. Emam
16
Logistic Regression Representation
 The logistic function is represented as:
 P(Y=1) = 1 / (1 + e^-(β0 + β1*X1 + β2*X2 + ... + βn*Xn))
• P(Y=1) is the probability that the dependent variable (Y) equals 1
(or belongs to the positive class).
• β0 is the intercept.
• β1, β2, ..., βn are the coefficients associated with the
independent variables X1, X2, ..., Xn.
 Logistic regression estimates the coefficients (β values) based
on the training data to make predictions. If the predicted
probability is greater than a predefined threshold (often 0.5),
the model assigns the data point to the positive class;
otherwise, it assigns it to the negative class.
Dr. Marwa M. Emam
17
Transforming Linearity into Probability:
 The sigmoid function's primary purpose is to transform the
linear combination of input features into a probability value
that falls within the range of 0 to 1.
 Probabilities: The output of the sigmoid function represents the
probability that a data point belongs to the "positive" class. For
example, if the output is 0.8, it suggests an 80% probability of
the event Y=1 occurring.
Dr. Marwa M. Emam 18
Sigmoid Function
Dr. Marwa M. Emam 19
Classification problem
 Tumor: Malignant/ Benign
Dr. Marwa M. Emam
20
Logistic Regression
 We have a set of feature vectors X with corresponding binary outputs
 We want to model p(y|x)
Dr. Marwa M. Emam 21
Odds Ratio
 The Odds Ratio (OR) is a crucial concept in logistic regression that quantifies
the relationship between a binary outcome and a predictor variable.
 In logistic regression, the odds ratio is used to understand how a one-unit
change in a predictor variable affects the odds of an event occurring. It
helps assess the strength and direction of the relationship between the
predictor and the binary outcome.
 The Odds Ratio is calculated as the ratio of the odds of an event occurring in
one group (exposure group) to the odds of the same event occurring in
another group (non-exposure group).
Dr. Marwa M. Emam 22
Odds Ratio
 To explain the idea behind logistic regression as a probabilistic model, let's
first introduce the odds ratio: the odds in favor of a particular event.
 Notations:
• p : probability of an event occurring
• 1 – p : probability of the event not occurring
• The odds ratio can be written as:
• Odds=
𝑷
𝟏−𝑷
• where p stands for the probability of the positive event. The
term positive event does not necessarily mean good, but refers
to the event that we want to predict, for example, the
probability that a patient has a certain disease; we can think of
the positive event as class label y =1.
Dr. Marwa M. Emam 23
Odds Ratio
 We can then define the logit function, which is simply the logarithm of
the odds ratio (log-odds):
 Logit (P)= 𝐥𝐨𝐠
𝑷
(𝟏−𝒑)
 The logit function takes as input values in the range 0 to 1 and
transforms them to values over the entire real-number range, which we
can use to express a linear relationship between feature values and the
log-odds:
Dr. Marwa M. Emam 24
Hypothesis function
Dr. Marwa M. Emam 25
Logistic regression: equation (ex. Only one
samle)
Dr. Marwa M. Emam 26
Logistic regression representation (all
observations)
Dr. Marwa M. Emam 27
Dr. Marwa M. Emam 28
Gradient ascent
 Now we could use an optimization algorithm such as gradient
ascent to maximize this log-likelihood function.
 Linear Regression:
 Logistic Regression:
Dr. Marwa M. Emam 29
Have a Nice Day …
Dr. Marwa M. Emam 30
Thanks
Dr. Marwa M. Emam 31

Machine Learning-Lec5.pdf_explain of logistic regression

  • 1.
    Logistic Regression Dr. MarwaM. Emam Faculty of computers and Information Minia University Dr. Marwa M. Emam 1
  • 2.
    Agenda  Introduction toLogistic Regression  Logistic Regression Basics  Model Representation  Training the Model  Examples and Applications Dr. Marwa M. Emam 2
  • 3.
  • 4.
    Classification Problem  Aclassification problem is a type of supervised machine learning problem where the goal is to assign data points or instances to one of several predefined categories or classes.  In a classification problem, the target variable is categorical, and the objective is to learn a model that can accurately predict the class label of new, unseen data points based on their features. Dr. Marwa M. Emam 4
  • 5.
    Classification Problem… Here aresome key characteristics of a classification problem:  Categorical Target Variable:  In a classification problem, the target variable, often referred to as the "class label," is a categorical variable. It can represent different classes or categories. For example, in a spam email classification problem, the classes might be "spam" and "not spam." Dr. Marwa M. Emam 5
  • 6.
    Classification Problem… Here aresome key characteristics of a classification problem:  Training Data:  The model is trained on a dataset where each data point is associated with a known class label. The dataset includes features (independent variables) that describe the characteristics of the data points. Dr. Marwa M. Emam 6
  • 7.
    Classification Problem… Here aresome key characteristics of a classification problem:  Model Building: The goal is to build a predictive model that can generalize from the training data to make accurate predictions for new, unseen data points.  This typically involves choosing an appropriate algorithm, learning the relationships between features and class labels, and estimating model parameters. Dr. Marwa M. Emam 7
  • 8.
    Classification Problem… Here aresome key characteristics of a classification problem:  Prediction: Once the model is trained, it is used to predict the class labels of new data points based on their feature values. The output of the classification model is a class label or a probability distribution over class labels. Dr. Marwa M. Emam 8
  • 9.
    Classification Problem… Here aresome key characteristics of a classification problem:  Evaluation: Classification models are evaluated using various performance metrics, such as accuracy, precision, recall, F1-score, and the area under the receiver operating characteristic curve (ROC-AUC). These metrics help assess the model's ability to make correct classifications and identify any trade-offs between different performance aspects. Dr. Marwa M. Emam 9
  • 10.
    Classification Problem… Here aresome key characteristics of a classification problem:  Applications: Classification problems are common in a wide range of applications, including spam detection, sentiment analysis, image recognition, medical diagnosis, fraud detection, and customer churn prediction.  Overall, classification problems are concerned with making informed decisions based on data and assigning data points to the most appropriate categories or classes. The choice of the classification algorithm and the quality of the features used in the model are critical factors in the success of a classification task. Dr. Marwa M. Emam 10
  • 11.
  • 12.
    Logistic Regression  Logisticregression is a statistical and machine learning technique used for binary classification.  It is a type of regression analysis that is well-suited for predicting the probability of a binary outcome, such as yes/no, true/false, 1/0, or success/failure.  Despite its name, logistic regression is a classification method rather than a regression method. Dr. Marwa M. Emam 12
  • 13.
    Logistic Regression … The primary goal of logistic regression is to model the relationship between a set of independent variables (features) and a binary dependent variable (target) in such a way that it can predict the probability of the binary outcome.  The outcome is typically coded as 0 (for one class) and 1 (for the other class).  The logistic function (also known as the sigmoid function) plays a crucial role in this process, as it transforms a linear combination of the independent variables into probabilities between 0 and 1. Dr. Marwa M. Emam 13
  • 14.
    Logistic Regression … Supervised Learning:  Logistic regression is a supervised learning algorithm, which means it requires labeled training data to learn and make predictions.  In supervised learning, the algorithm is provided with a dataset in which each data point has an associated class label, indicating the category to which it belongs. Logistic regression learns from this labeled data and, using the patterns it discerns, can subsequently make predictions for new, unlabeled data points. Dr. Marwa M. Emam 14
  • 15.
    Logistic Regression Objective The algorithm aims to assign data points into one of these two classes by estimating the probability of belonging to the "1" or "positive" class. Dr. Marwa M. Emam 15
  • 16.
    Logistic Function /Sigmoid function  To estimate these probabilities, logistic regression uses the sigmoid function (also known as the logistic function).  The sigmoid function maps the linear combination of input features to a value between 0 and 1.  This mapping ensures that the output represents a valid probability. Dr. Marwa M. Emam 16
  • 17.
    Logistic Regression Representation The logistic function is represented as:  P(Y=1) = 1 / (1 + e^-(β0 + β1*X1 + β2*X2 + ... + βn*Xn)) • P(Y=1) is the probability that the dependent variable (Y) equals 1 (or belongs to the positive class). • β0 is the intercept. • β1, β2, ..., βn are the coefficients associated with the independent variables X1, X2, ..., Xn.  Logistic regression estimates the coefficients (β values) based on the training data to make predictions. If the predicted probability is greater than a predefined threshold (often 0.5), the model assigns the data point to the positive class; otherwise, it assigns it to the negative class. Dr. Marwa M. Emam 17
  • 18.
    Transforming Linearity intoProbability:  The sigmoid function's primary purpose is to transform the linear combination of input features into a probability value that falls within the range of 0 to 1.  Probabilities: The output of the sigmoid function represents the probability that a data point belongs to the "positive" class. For example, if the output is 0.8, it suggests an 80% probability of the event Y=1 occurring. Dr. Marwa M. Emam 18
  • 19.
  • 20.
    Classification problem  Tumor:Malignant/ Benign Dr. Marwa M. Emam 20
  • 21.
    Logistic Regression  Wehave a set of feature vectors X with corresponding binary outputs  We want to model p(y|x) Dr. Marwa M. Emam 21
  • 22.
    Odds Ratio  TheOdds Ratio (OR) is a crucial concept in logistic regression that quantifies the relationship between a binary outcome and a predictor variable.  In logistic regression, the odds ratio is used to understand how a one-unit change in a predictor variable affects the odds of an event occurring. It helps assess the strength and direction of the relationship between the predictor and the binary outcome.  The Odds Ratio is calculated as the ratio of the odds of an event occurring in one group (exposure group) to the odds of the same event occurring in another group (non-exposure group). Dr. Marwa M. Emam 22
  • 23.
    Odds Ratio  Toexplain the idea behind logistic regression as a probabilistic model, let's first introduce the odds ratio: the odds in favor of a particular event.  Notations: • p : probability of an event occurring • 1 – p : probability of the event not occurring • The odds ratio can be written as: • Odds= 𝑷 𝟏−𝑷 • where p stands for the probability of the positive event. The term positive event does not necessarily mean good, but refers to the event that we want to predict, for example, the probability that a patient has a certain disease; we can think of the positive event as class label y =1. Dr. Marwa M. Emam 23
  • 24.
    Odds Ratio  Wecan then define the logit function, which is simply the logarithm of the odds ratio (log-odds):  Logit (P)= 𝐥𝐨𝐠 𝑷 (𝟏−𝒑)  The logit function takes as input values in the range 0 to 1 and transforms them to values over the entire real-number range, which we can use to express a linear relationship between feature values and the log-odds: Dr. Marwa M. Emam 24
  • 25.
  • 26.
    Logistic regression: equation(ex. Only one samle) Dr. Marwa M. Emam 26
  • 27.
    Logistic regression representation(all observations) Dr. Marwa M. Emam 27
  • 28.
    Dr. Marwa M.Emam 28
  • 29.
    Gradient ascent  Nowwe could use an optimization algorithm such as gradient ascent to maximize this log-likelihood function.  Linear Regression:  Logistic Regression: Dr. Marwa M. Emam 29
  • 30.
    Have a NiceDay … Dr. Marwa M. Emam 30
  • 31.