Downloaded 139 times
![Graphics 8
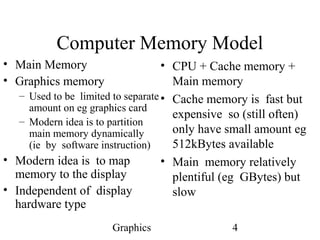
Coordinate Systems
• Pixel Coordinate System -
rows and columns
• Rectilinear
• Usually for graphics, we
start at top left corner and
work our way across and
down
• Same as raster orientation
• Array[row][column]
• Row major used in C
and C+ ( last index
moves fastest in
memory)
• Not all languages do
it this way - eg Fortran
uses column major
(first index moves
fastest)](https://image.slidesharecdn.com/lect02-fundamentals-140727131756-phpapp02/85/fundamentals-of-Computer-graphics-Computer-graphics-tutorials-8-320.jpg)
![Graphics 10
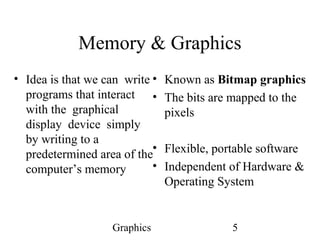
Drawing Space or Canvas
• Coordinate Systems
• Drawing Primitives
• Library of utilities
– eg drawDot( int x, int y);
– Or drawLine( x1, y1, x2, y2 );
• Usually we have “Primitive”
Models for coordinate spaces
and colours
• We do not want to write
our application programs
worrying about pixel
resolutions
• We may have libraries
that allow us to do so, but
often they will support
more general coordinates
• Eg real space
“normalised” coordinates
[0.0,1.0]](https://image.slidesharecdn.com/lect02-fundamentals-140727131756-phpapp02/85/fundamentals-of-Computer-graphics-Computer-graphics-tutorials-10-320.jpg)
The document provides a comprehensive overview of graphics fundamentals, including the historical evolution of graphical devices and models. It discusses computer memory structures, pixel representation, coordinate systems, and various graphical libraries used in programming, particularly with Java. Key concepts like drawing spaces, color models, and device interaction are highlighted, emphasizing the technological advancements in graphics processing and memory management.