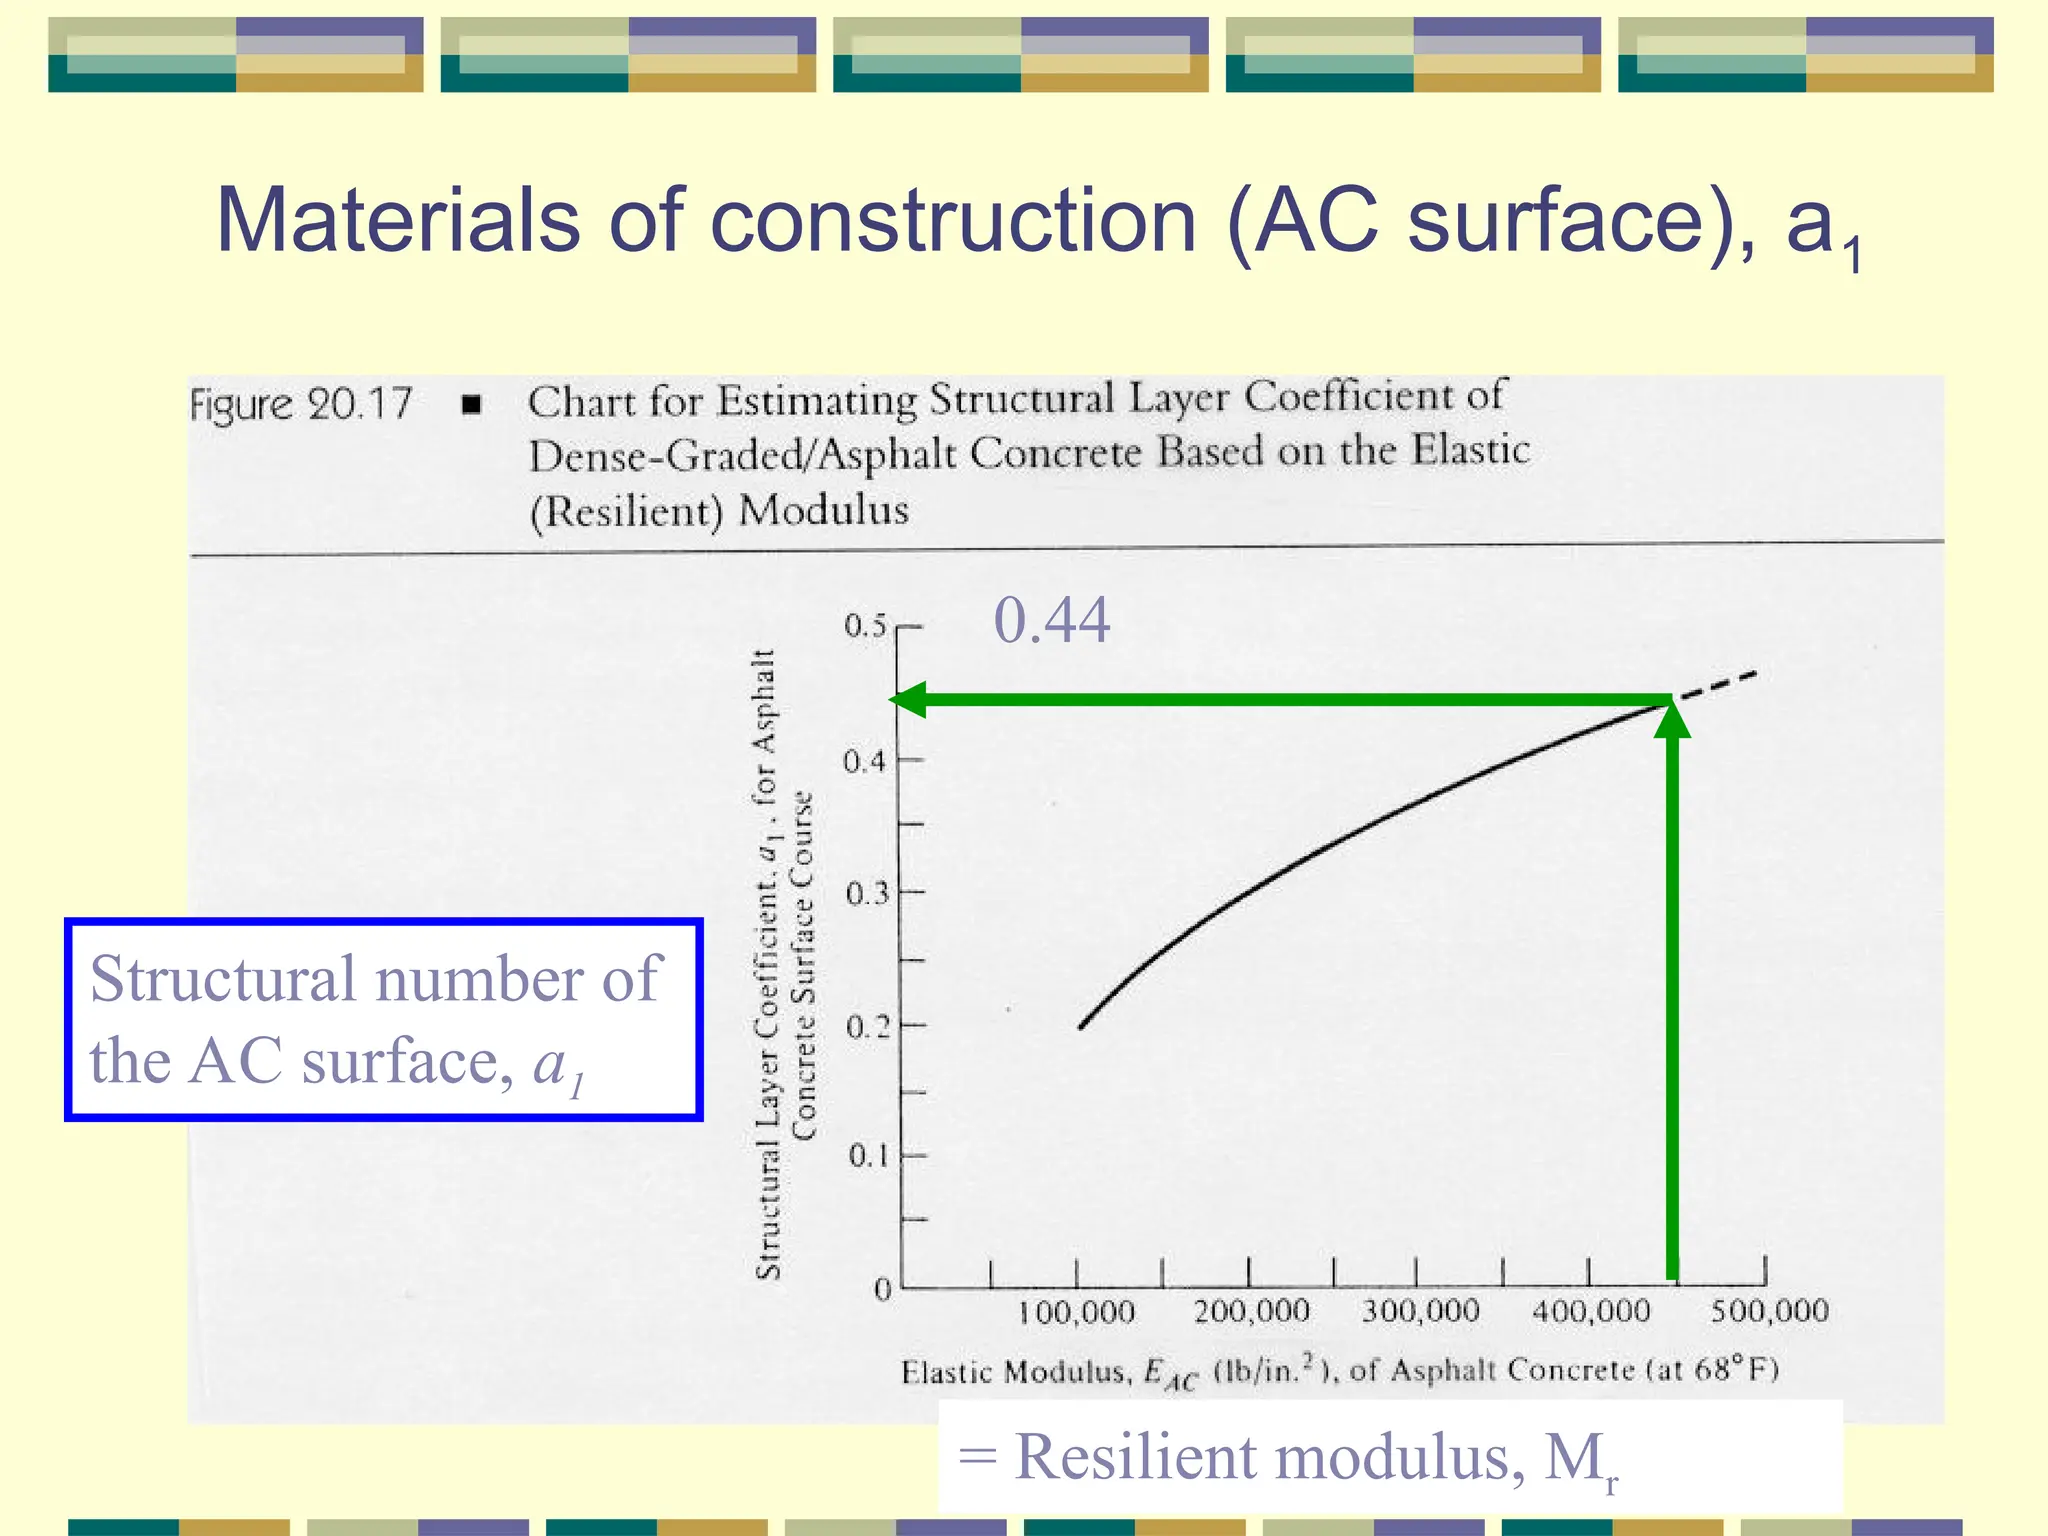
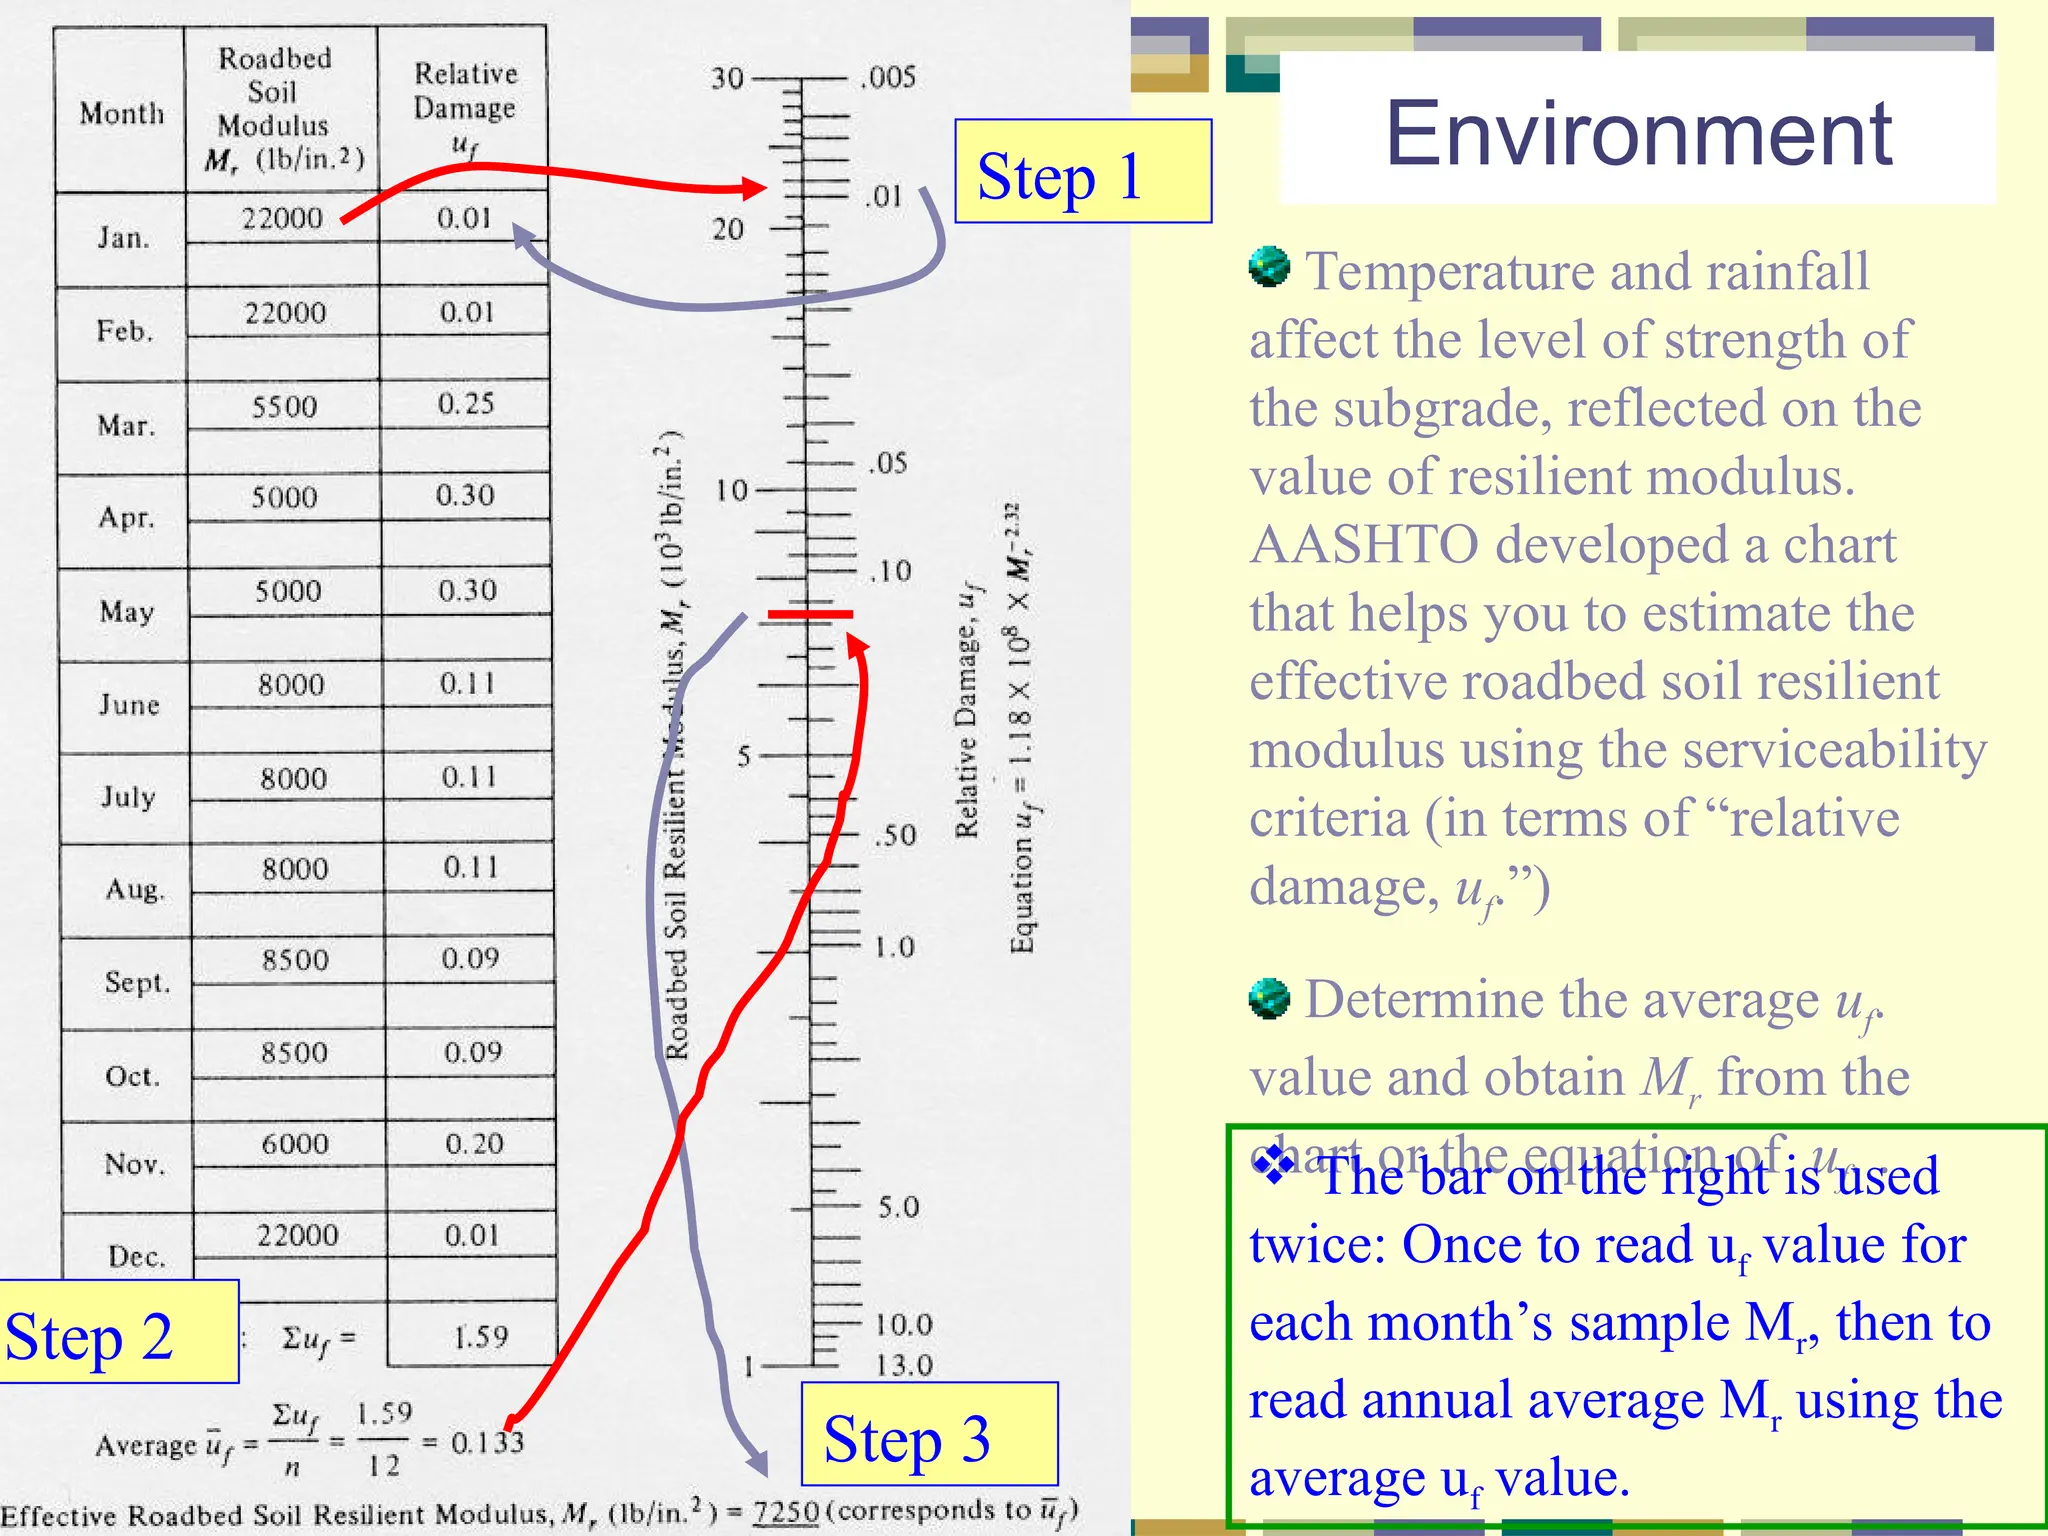
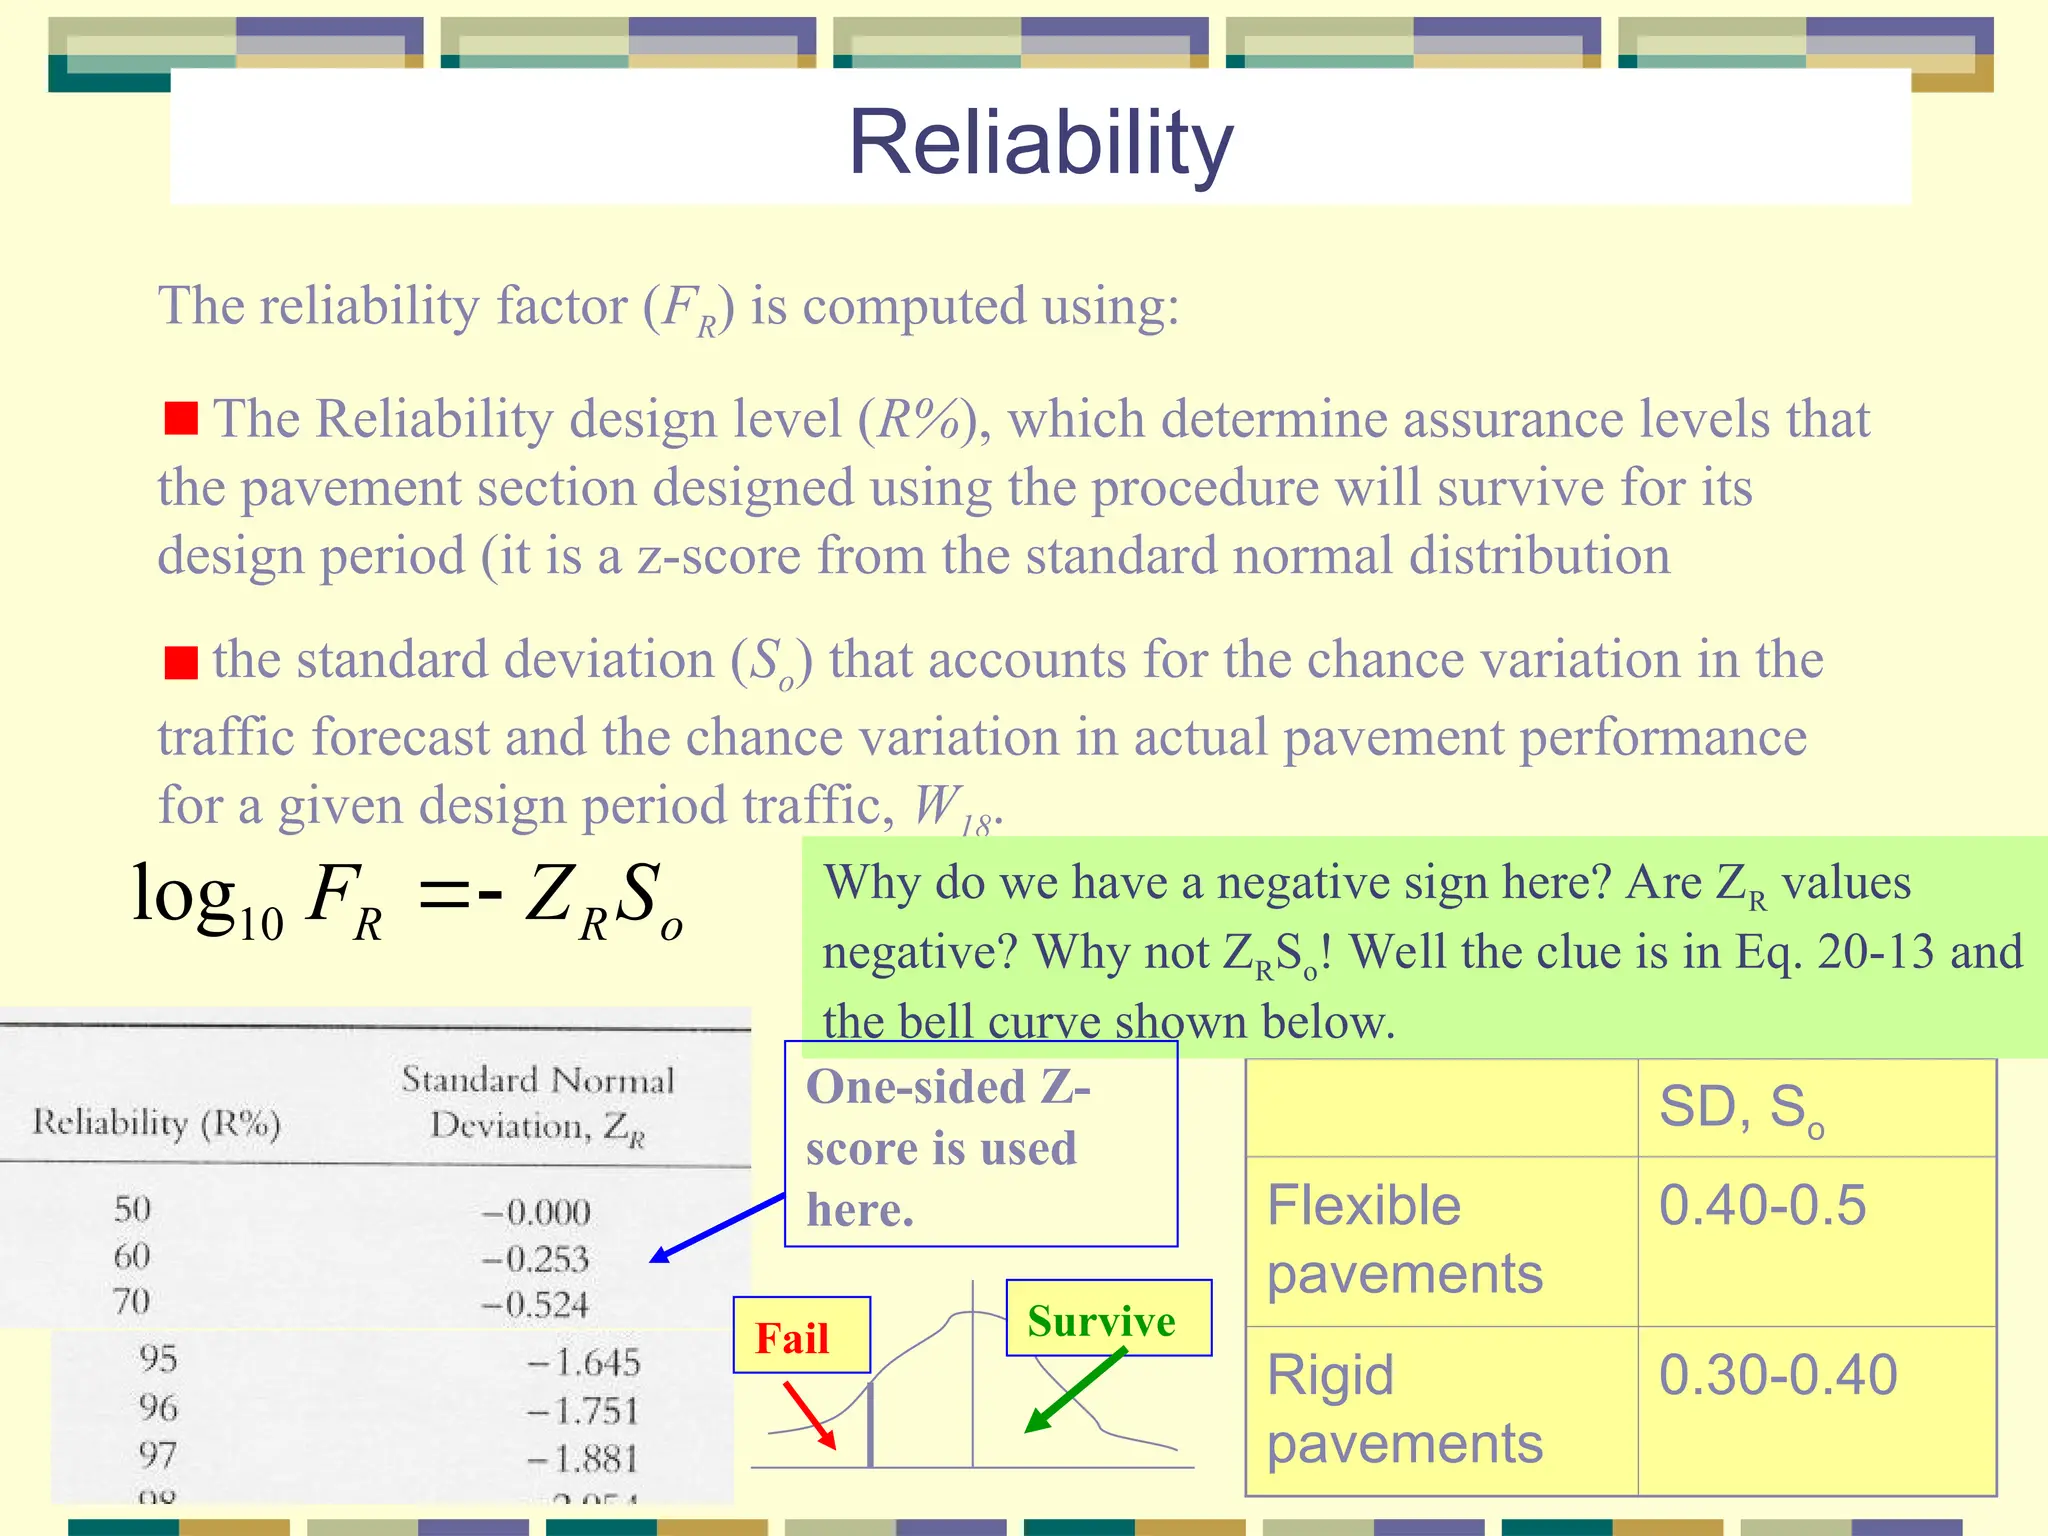
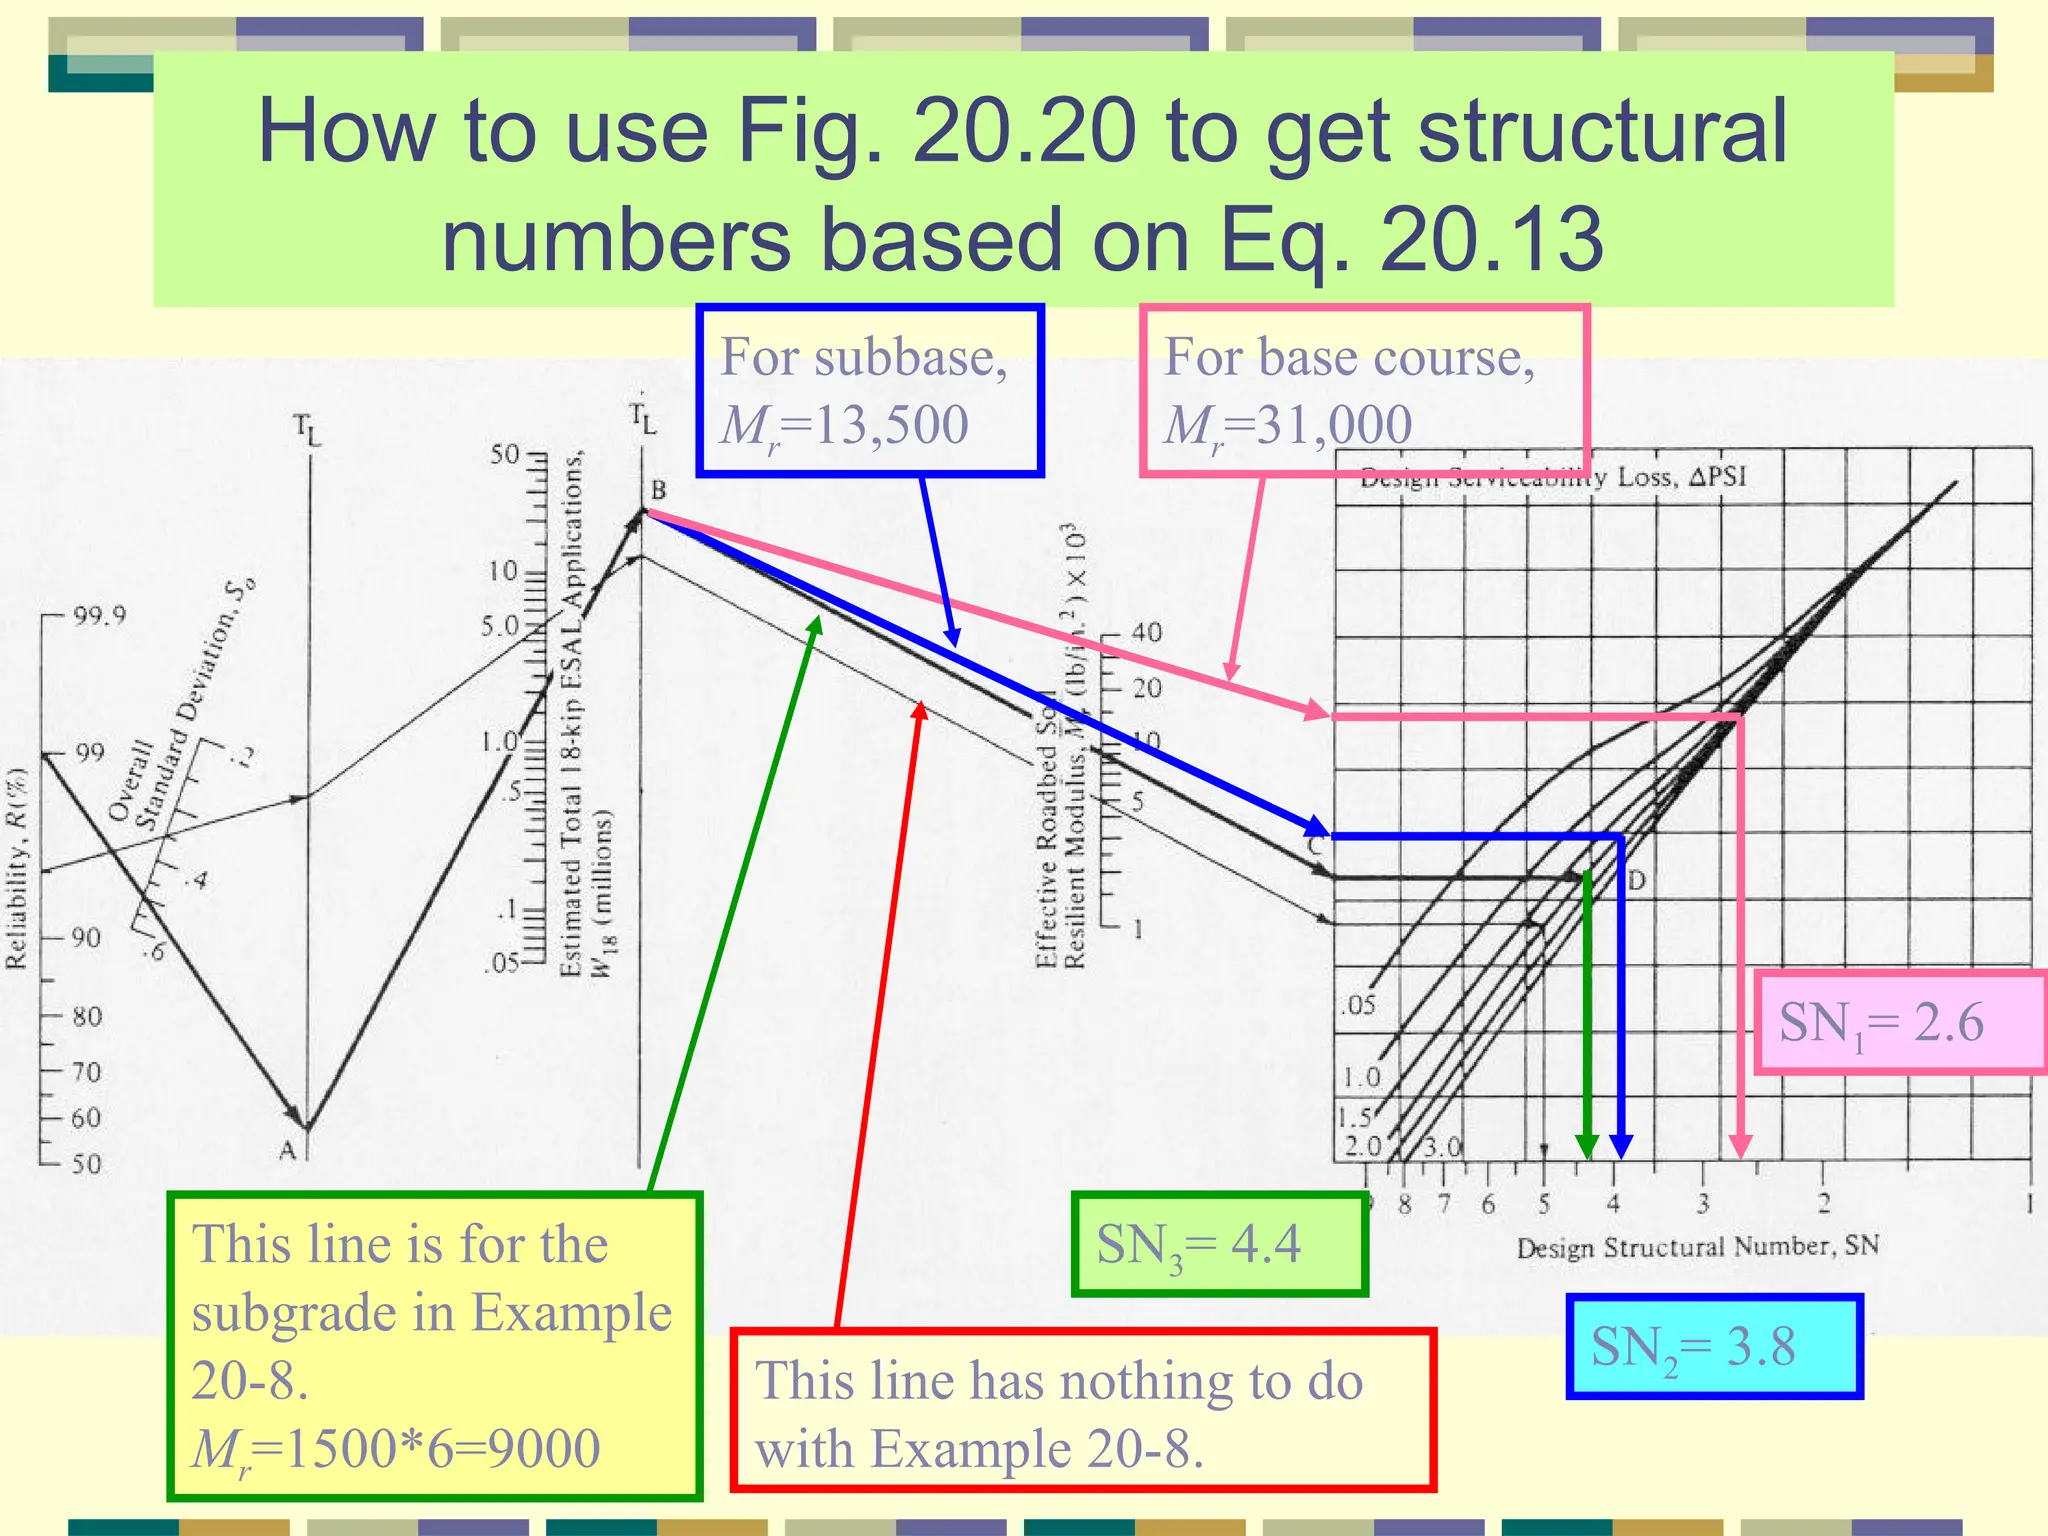
Lec 29, Ch.20, pp.990-1007: AASTHO flexible
pavement design method (objectives)
Know the factors considered in the AASHTO
design method
Become familiar with use of Tables 20.13a and
b through 20.18 and Figures 20.15 through
20.20
Know how the structural numbers are used in
thickness determination
Become thoroughly familiar with the structural
design process of the AASHTO flexible
pavement design method
What we discuss in class today…
Design considerations
Use of tables and figures related to the
factors considered
Structural design procedure
Design considerations for the
AASHTO Flexible Pavement Design
Pavement performance
Traffic
Roadbed soils (subgrade material)
Materials of construction
Environment
Drainage
Reliability
The following factors are considered in the pavement thickness
design.
Pavement performance
Structural  Cracking, faulting, raveling, etc.
Functional  Riding comfort (measured in terms of
roughness of pavement.)
Serviceability Performance: Measured by PSI  Present
Serviceability Index with scale 0 to 5.
0 “Road closed”
5 “Just constructed”
4.2 Initial PSI (pi)
Terminal PSI (pt)
 2.5 to 3.0 for major highways
 2.0 for lower class highways
 1.5 for very special cases
PSI
Traffic
 In the AASHTO flexible pavement design, traffic is considered in terms of
ESAL for the terminal PSI (Table 20.13 for pt = 2.5.)
 You must assume the structural number of the pavement. So, you must
check if the final SN3 is similar to the assumed SN. Higher SN means stronger
pavement, thus the impact of traffic on pavement deteriorations is less.
Roadbed soils (Subgrade material)
CBR (California Bearing Ratio), R-value (Resistance), and
Mr (Resilient modulus) are used to describe the property of the
subgrade material.
During the structural design, only Mr values are used. The
following conversion formulas are used if either CBR or R-
values are given.
Mr (lb/in2
) = 1500 x CBR for fine-grain soils with soaked CBR of 10 or less.
Mr (lb/in2
) = 1000 + 555 x (R-value) for R <= 20
Materials of construction (Subbase), a3
Charts are available to convert the properties of pavement
construction materials to structural numbers: a3, a2, and a1
Structural number of
the subbase, a3
Use CBR, R-value, or Mr
to find a3 values
Materials of construction (Base course), a2
Base!
Structural number of
the base course, a2
Use CBR, R-value, or Mr
to find a2 values
Materials of construction (AC surface), a1
= Resilient modulus, Mr
Structural number of
the AC surface, a1
0.44
Environment
Temperature and rainfall
affect the level of strength of
the subgrade, reflected on the
value of resilient modulus.
AASHTO developed a chart
that helps you to estimate the
effective roadbed soil resilient
modulus using the serviceability
criteria (in terms of “relative
damage, uf.”)
Determine the average uf.
value and obtain Mr from the
chart or the equation of uf. .
 The bar on the right is used
twice: Once to read uf value for
each month’s sample Mr, then to
read annual average Mr using the
average uf value.
Step 1
Step 3
Step 2
Drainage
The effect of drainage on the performance of flexible pavements
is considered with respect to the effect water has on the strength of
the base material and roadbed soil.
This effect is expressed by the drainage coefficient, mi. This
value is dependent on the drainage quality and the percent of time
pavement structure is exposed to moisture levels approaching
saturation.
Definition of drainage quality and finding
recommended mi values
Time required to
drain the
base/subbase layer to
50% saturation.
If “Fair” and 30%
exposure, then mi
is 0.80.
Step 1
Step 2
Reliability
The reliability factor (FR) is computed using:
The Reliability design level (R%), which determine assurance levels that
the pavement section designed using the procedure will survive for its
design period (it is a z-score from the standard normal distribution
the standard deviation (So) that accounts for the chance variation in the
traffic forecast and the chance variation in actual pavement performance
for a given design period traffic, W18.
o
R
R S
Z
F 

10
log
SD, So
Flexible
pavements
0.40-0.5
Rigid
pavements
0.30-0.40
Why do we have a negative sign here? Are ZR values
negative? Why not ZRSo! Well the clue is in Eq. 20-13 and
the bell curve shown below.
One-sided Z-
score is used
here.
Survive
Fail
Structural design
The object of the design using the AASHTO method is to determine a
flexible pavement SN adequate to carry the projected design ESAL.
The method discussed in the text (Example 20-8) applies to ESALs greater
than 50,000 for the performance period. The design for ESALs less than this is
usually considered under low-volume roads.
 
 
 
07
.
8
log
32
.
2
)
1
/(
1094
40
.
0
)
5
.
1
2
.
4
/(
log
20
.
0
1
log
36
.
9
log
10
19
.
5
10
10
18
10











r
o
R
M
SN
PSI
SN
S
Z
W
Simplify this as f(W18) = f(ZRSo) + f(SN)
We will keep the ESAL value constant and try to prove whether ZR must be
negative or not. Note that So and SN are always positive. Standard deviation
is always positive because it is a physical difference from the mean value,
and SN is also positive because it means pavement thickness.
3
3
3
2
2
2
1
1 m
D
a
m
D
a
D
a
SN 


Where,
Solving the riddle of the negative values of ZR
f(W18) = f(ZRSo) + f(SN)
ESAL is an estimated value. It may actually more or less. In the design formula,
however, the ESAL value is set to a constant. Then to make sure the pavement survive,
you have to have a thicker one than the thickness that the estimated ESAL requires. To
make that happen in the design formula, we need to subtract a value from the RHS.
Hence, the reliability factor must be negative. The only way to make ZRSo smaller is to
have a negative value of Z because S is always positive.
How to use Fig. 20.20 to get structural
numbers based on Eq. 20.13
This line has nothing to do
with Example 20-8.
This line is for the
subgrade in Example
20-8.
Mr=1500*6=9000
SN3= 4.4
For subbase,
Mr=13,500
For base course,
Mr=31,000
SN2= 3.8
SN1= 2.6
Once SN value is set, thickness design begins…
3
3
3
2
2
2
1
1 m
D
a
m
D
a
D
a
SN 


1
1
1 D
a
SN 
2
2
2
1
1
2 m
D
a
D
a
SN 

3
3
3
2
2
2
1
1
3 m
D
a
m
D
a
D
a
SN 


Proceed in
this direction
Use Fig.20.15 for a3, Fig.20.16 for a2, Fig.20.17 for a3, and Tab. 20.14 and
20.15 m2 and m3. Find the depth that results in a SN value close to the SN
value obtained from Fig. 20.20.
Example 20-8
Given:
 ESAL = 2 x 10⁶
 One week for water to be drained
 Saturation level moisture exposure
= 30% of the time
 AC’s Mr at 68Fo
= 450,000 lb/in2
 CBR of base course =100, Mr =
31,000 lb/in2
CBR of subbase =22, Mr = 13,500
lb/in2
CBR of subgrade = 6, Mr =
1500CBR= 6*1500 = 9000 lb/in2
Rural interstate
Parameter values:
 Reliability level (R ) = 99%
from Tab. 20.16
 Standard Deviation (So) = 0.49,
Table 20.16, p.973
 Initial serviceability, pi = 4.5
 Terminal serviceability, pt = 2.5
 Drainage mi values = 0.8 for
“Fair” category in Tab. 20.14 and
“Greater than 25%” category in
Tab. 20.15

Lec_29_Ch20_pp962 19934AASHTO method.ppt

  • 1.
    Lec 29, Ch.20,pp.990-1007: AASTHO flexible pavement design method (objectives) Know the factors considered in the AASHTO design method Become familiar with use of Tables 20.13a and b through 20.18 and Figures 20.15 through 20.20 Know how the structural numbers are used in thickness determination Become thoroughly familiar with the structural design process of the AASHTO flexible pavement design method
  • 2.
    What we discussin class today… Design considerations Use of tables and figures related to the factors considered Structural design procedure
  • 3.
    Design considerations forthe AASHTO Flexible Pavement Design Pavement performance Traffic Roadbed soils (subgrade material) Materials of construction Environment Drainage Reliability The following factors are considered in the pavement thickness design.
  • 4.
    Pavement performance Structural Cracking, faulting, raveling, etc. Functional  Riding comfort (measured in terms of roughness of pavement.) Serviceability Performance: Measured by PSI  Present Serviceability Index with scale 0 to 5. 0 “Road closed” 5 “Just constructed” 4.2 Initial PSI (pi) Terminal PSI (pt)  2.5 to 3.0 for major highways  2.0 for lower class highways  1.5 for very special cases PSI
  • 5.
    Traffic  In theAASHTO flexible pavement design, traffic is considered in terms of ESAL for the terminal PSI (Table 20.13 for pt = 2.5.)  You must assume the structural number of the pavement. So, you must check if the final SN3 is similar to the assumed SN. Higher SN means stronger pavement, thus the impact of traffic on pavement deteriorations is less.
  • 6.
    Roadbed soils (Subgradematerial) CBR (California Bearing Ratio), R-value (Resistance), and Mr (Resilient modulus) are used to describe the property of the subgrade material. During the structural design, only Mr values are used. The following conversion formulas are used if either CBR or R- values are given. Mr (lb/in2 ) = 1500 x CBR for fine-grain soils with soaked CBR of 10 or less. Mr (lb/in2 ) = 1000 + 555 x (R-value) for R <= 20
  • 7.
    Materials of construction(Subbase), a3 Charts are available to convert the properties of pavement construction materials to structural numbers: a3, a2, and a1 Structural number of the subbase, a3 Use CBR, R-value, or Mr to find a3 values
  • 8.
    Materials of construction(Base course), a2 Base! Structural number of the base course, a2 Use CBR, R-value, or Mr to find a2 values
  • 9.
    Materials of construction(AC surface), a1 = Resilient modulus, Mr Structural number of the AC surface, a1 0.44
  • 10.
    Environment Temperature and rainfall affectthe level of strength of the subgrade, reflected on the value of resilient modulus. AASHTO developed a chart that helps you to estimate the effective roadbed soil resilient modulus using the serviceability criteria (in terms of “relative damage, uf.”) Determine the average uf. value and obtain Mr from the chart or the equation of uf. .  The bar on the right is used twice: Once to read uf value for each month’s sample Mr, then to read annual average Mr using the average uf value. Step 1 Step 3 Step 2
  • 11.
    Drainage The effect ofdrainage on the performance of flexible pavements is considered with respect to the effect water has on the strength of the base material and roadbed soil. This effect is expressed by the drainage coefficient, mi. This value is dependent on the drainage quality and the percent of time pavement structure is exposed to moisture levels approaching saturation.
  • 12.
    Definition of drainagequality and finding recommended mi values Time required to drain the base/subbase layer to 50% saturation. If “Fair” and 30% exposure, then mi is 0.80. Step 1 Step 2
  • 13.
    Reliability The reliability factor(FR) is computed using: The Reliability design level (R%), which determine assurance levels that the pavement section designed using the procedure will survive for its design period (it is a z-score from the standard normal distribution the standard deviation (So) that accounts for the chance variation in the traffic forecast and the chance variation in actual pavement performance for a given design period traffic, W18. o R R S Z F   10 log SD, So Flexible pavements 0.40-0.5 Rigid pavements 0.30-0.40 Why do we have a negative sign here? Are ZR values negative? Why not ZRSo! Well the clue is in Eq. 20-13 and the bell curve shown below. One-sided Z- score is used here. Survive Fail
  • 14.
    Structural design The objectof the design using the AASHTO method is to determine a flexible pavement SN adequate to carry the projected design ESAL. The method discussed in the text (Example 20-8) applies to ESALs greater than 50,000 for the performance period. The design for ESALs less than this is usually considered under low-volume roads.       07 . 8 log 32 . 2 ) 1 /( 1094 40 . 0 ) 5 . 1 2 . 4 /( log 20 . 0 1 log 36 . 9 log 10 19 . 5 10 10 18 10            r o R M SN PSI SN S Z W Simplify this as f(W18) = f(ZRSo) + f(SN) We will keep the ESAL value constant and try to prove whether ZR must be negative or not. Note that So and SN are always positive. Standard deviation is always positive because it is a physical difference from the mean value, and SN is also positive because it means pavement thickness. 3 3 3 2 2 2 1 1 m D a m D a D a SN    Where,
  • 15.
    Solving the riddleof the negative values of ZR f(W18) = f(ZRSo) + f(SN) ESAL is an estimated value. It may actually more or less. In the design formula, however, the ESAL value is set to a constant. Then to make sure the pavement survive, you have to have a thicker one than the thickness that the estimated ESAL requires. To make that happen in the design formula, we need to subtract a value from the RHS. Hence, the reliability factor must be negative. The only way to make ZRSo smaller is to have a negative value of Z because S is always positive.
  • 16.
    How to useFig. 20.20 to get structural numbers based on Eq. 20.13 This line has nothing to do with Example 20-8. This line is for the subgrade in Example 20-8. Mr=1500*6=9000 SN3= 4.4 For subbase, Mr=13,500 For base course, Mr=31,000 SN2= 3.8 SN1= 2.6
  • 17.
    Once SN valueis set, thickness design begins… 3 3 3 2 2 2 1 1 m D a m D a D a SN    1 1 1 D a SN  2 2 2 1 1 2 m D a D a SN   3 3 3 2 2 2 1 1 3 m D a m D a D a SN    Proceed in this direction Use Fig.20.15 for a3, Fig.20.16 for a2, Fig.20.17 for a3, and Tab. 20.14 and 20.15 m2 and m3. Find the depth that results in a SN value close to the SN value obtained from Fig. 20.20.
  • 18.
    Example 20-8 Given:  ESAL= 2 x 10⁶  One week for water to be drained  Saturation level moisture exposure = 30% of the time  AC’s Mr at 68Fo = 450,000 lb/in2  CBR of base course =100, Mr = 31,000 lb/in2 CBR of subbase =22, Mr = 13,500 lb/in2 CBR of subgrade = 6, Mr = 1500CBR= 6*1500 = 9000 lb/in2 Rural interstate Parameter values:  Reliability level (R ) = 99% from Tab. 20.16  Standard Deviation (So) = 0.49, Table 20.16, p.973  Initial serviceability, pi = 4.5  Terminal serviceability, pt = 2.5  Drainage mi values = 0.8 for “Fair” category in Tab. 20.14 and “Greater than 25%” category in Tab. 20.15