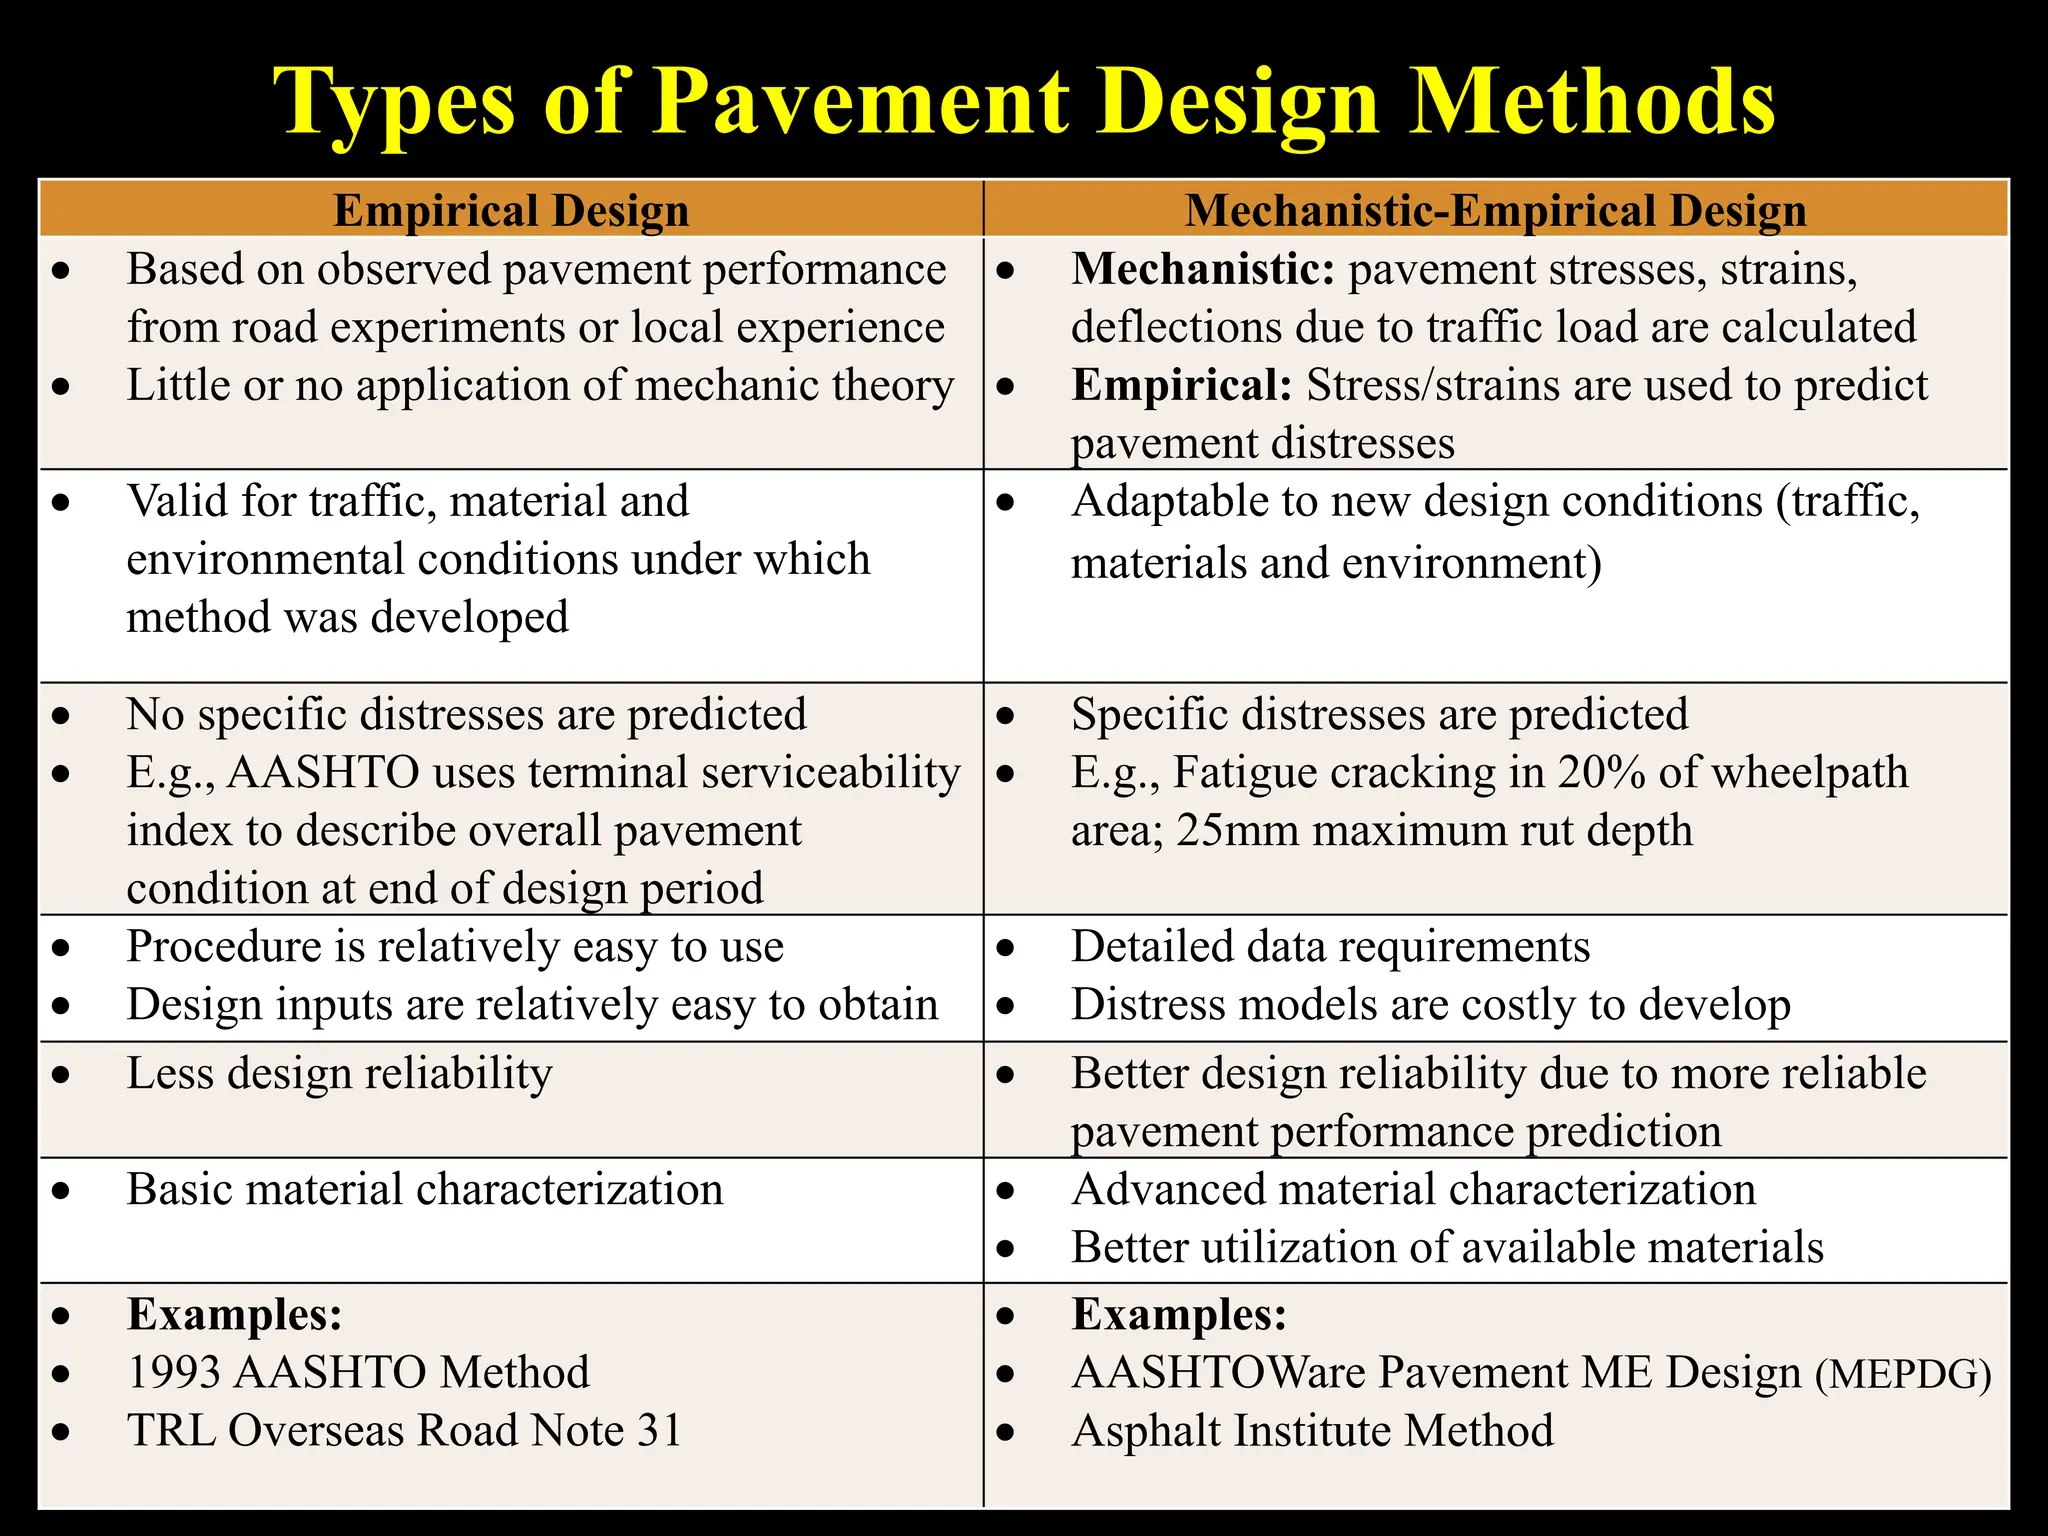
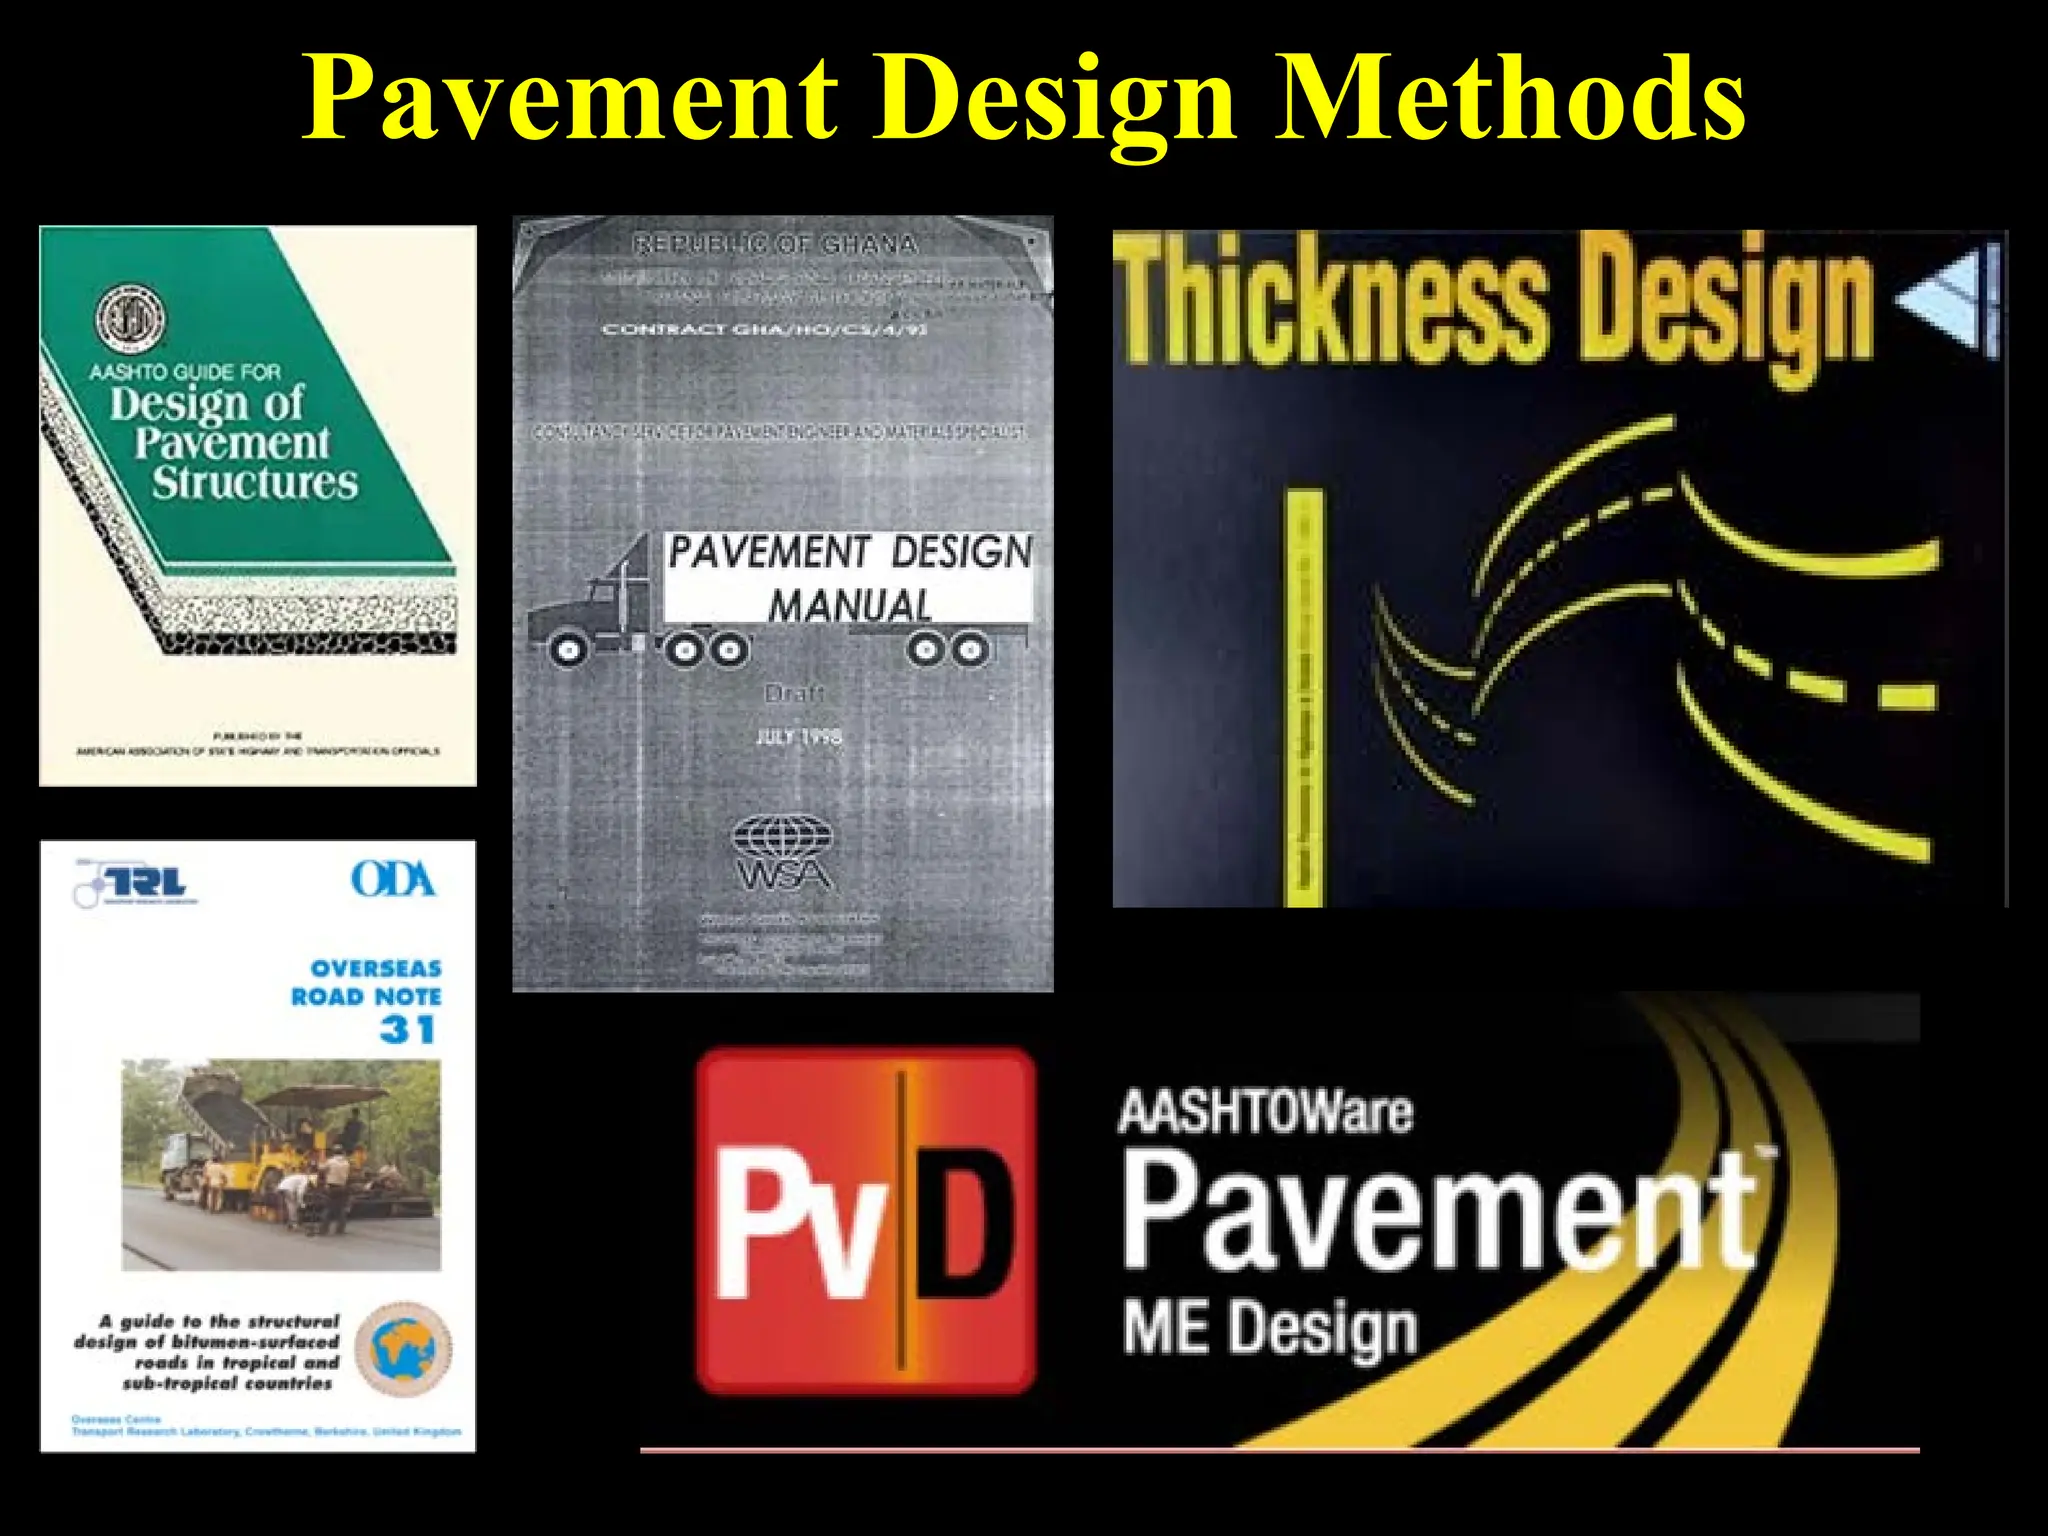
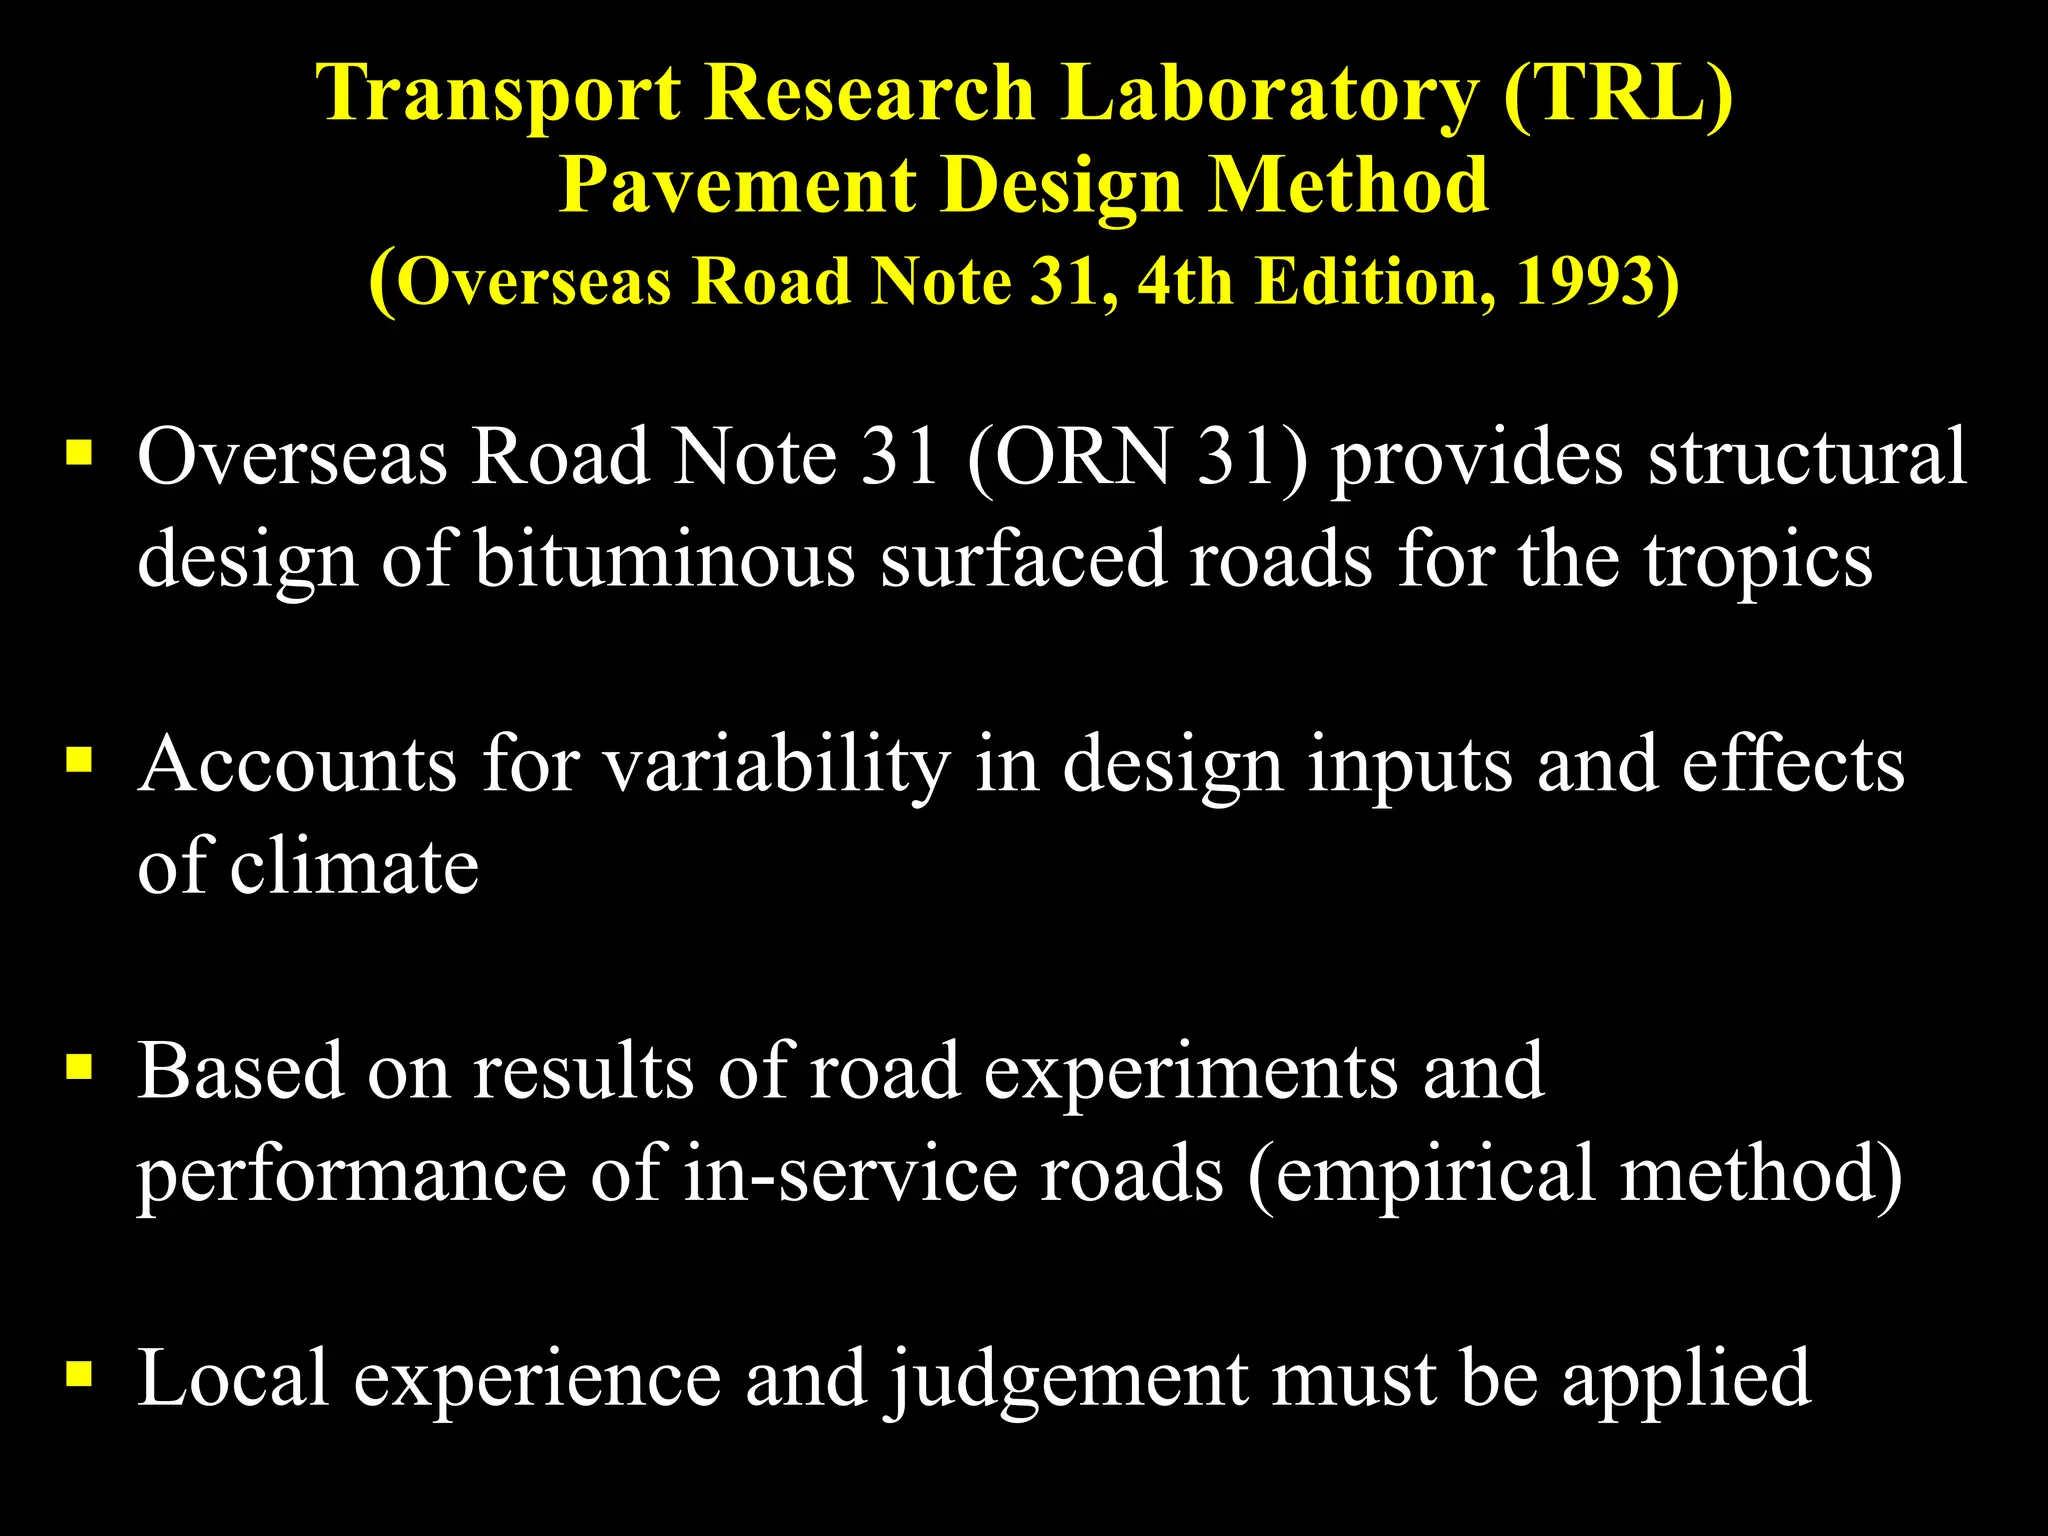
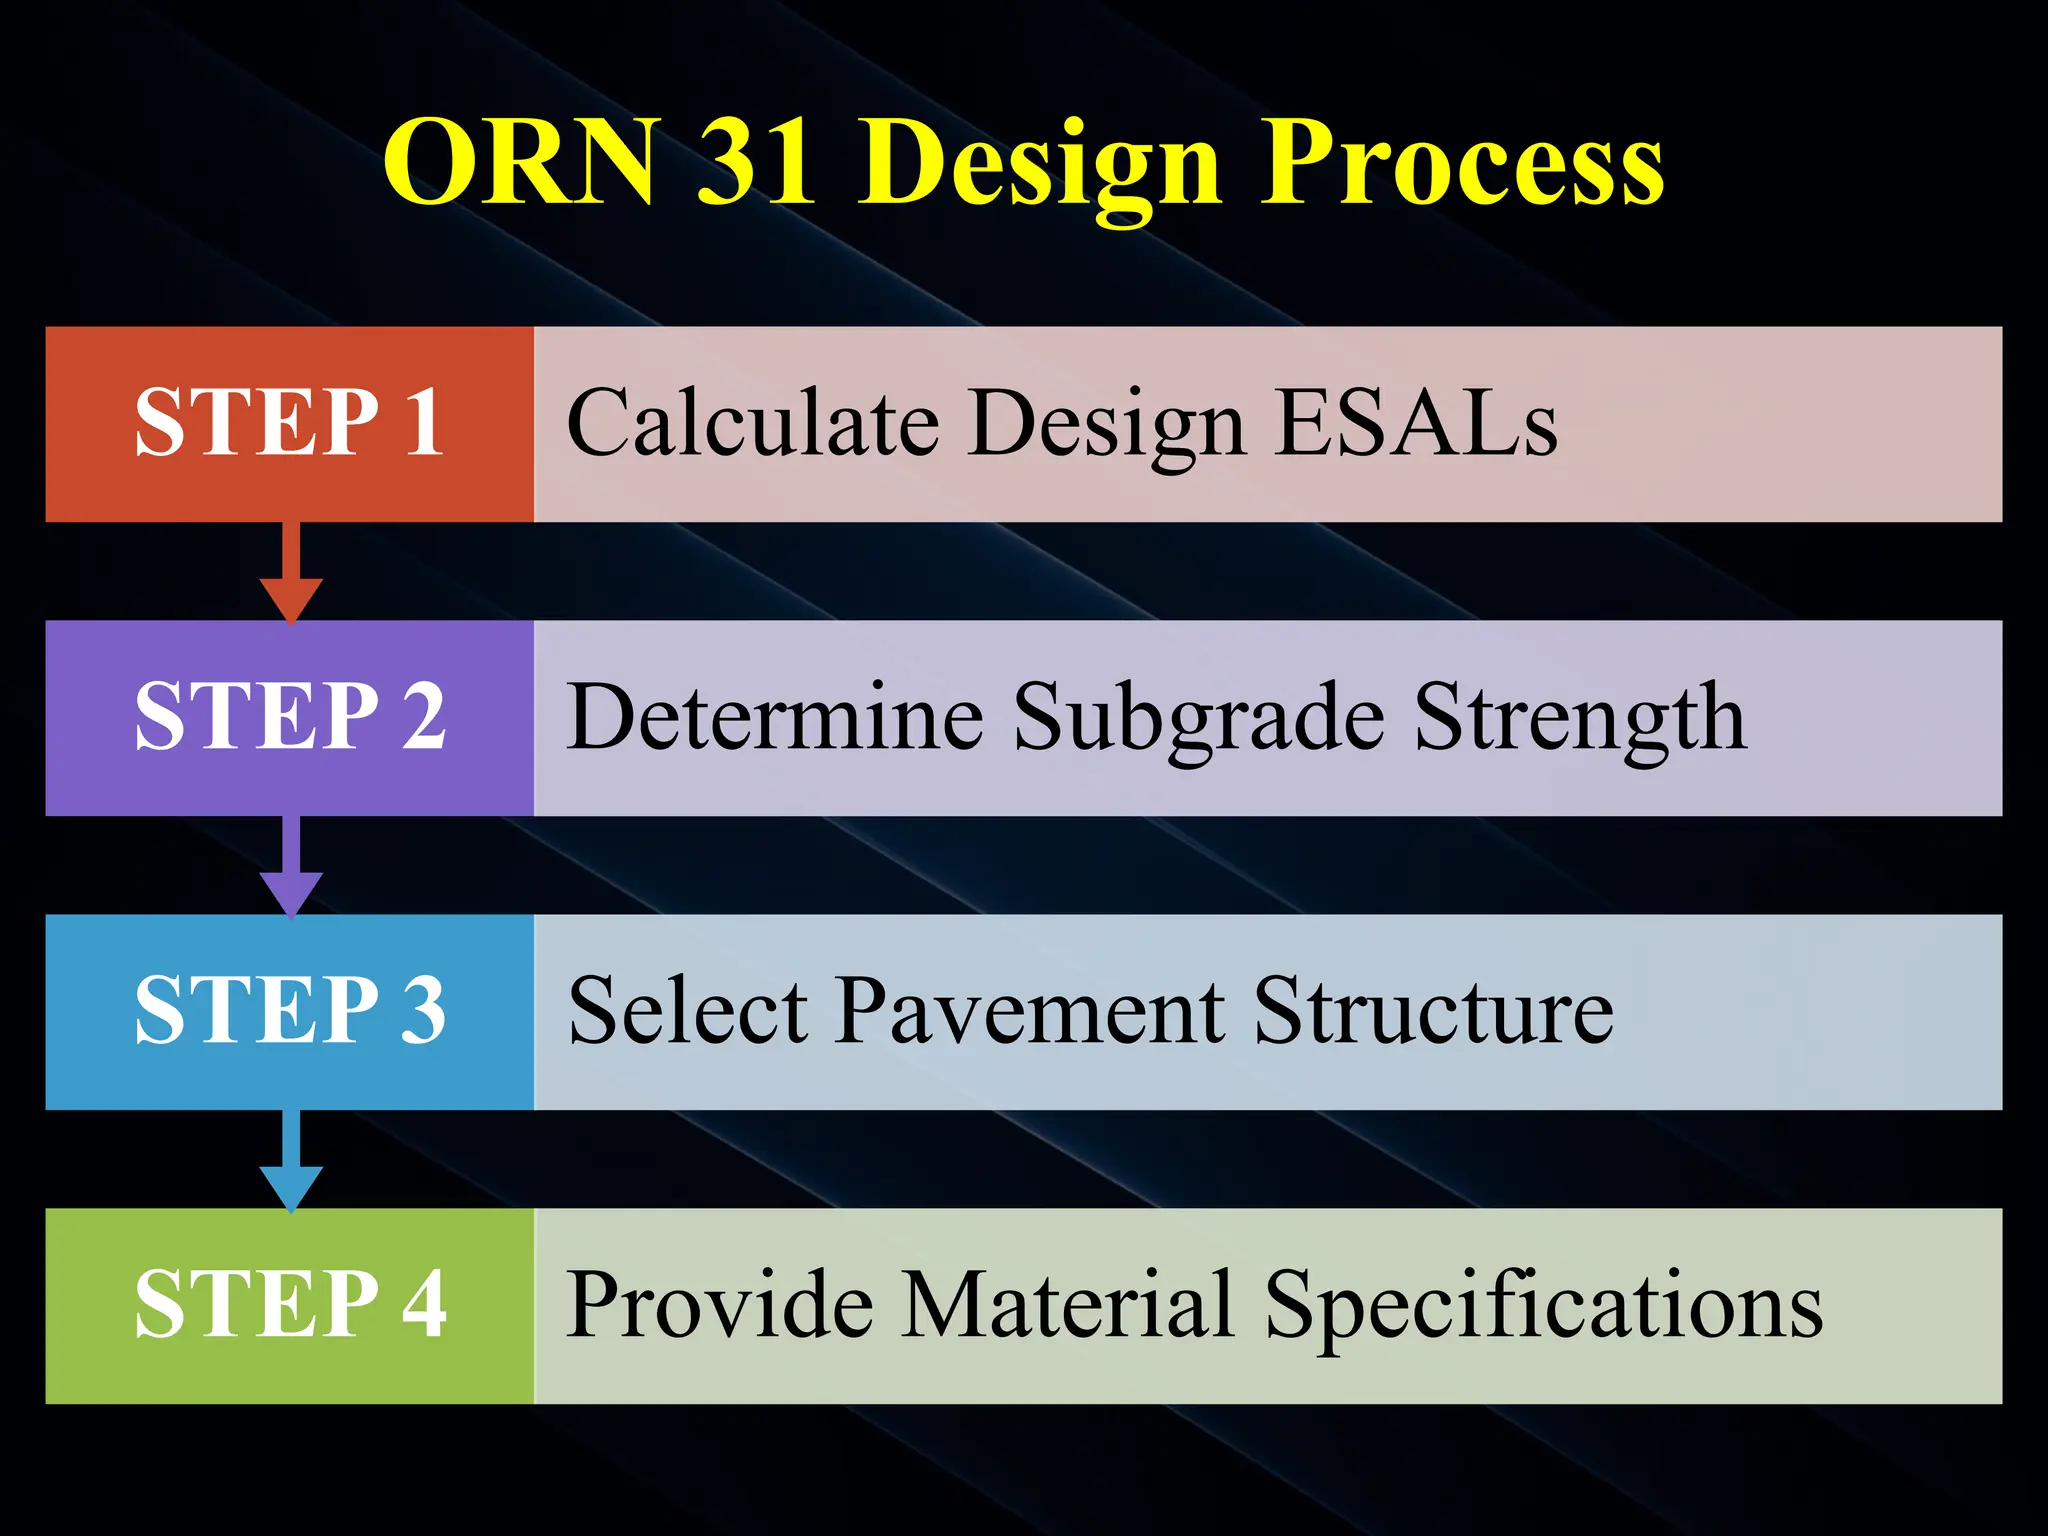
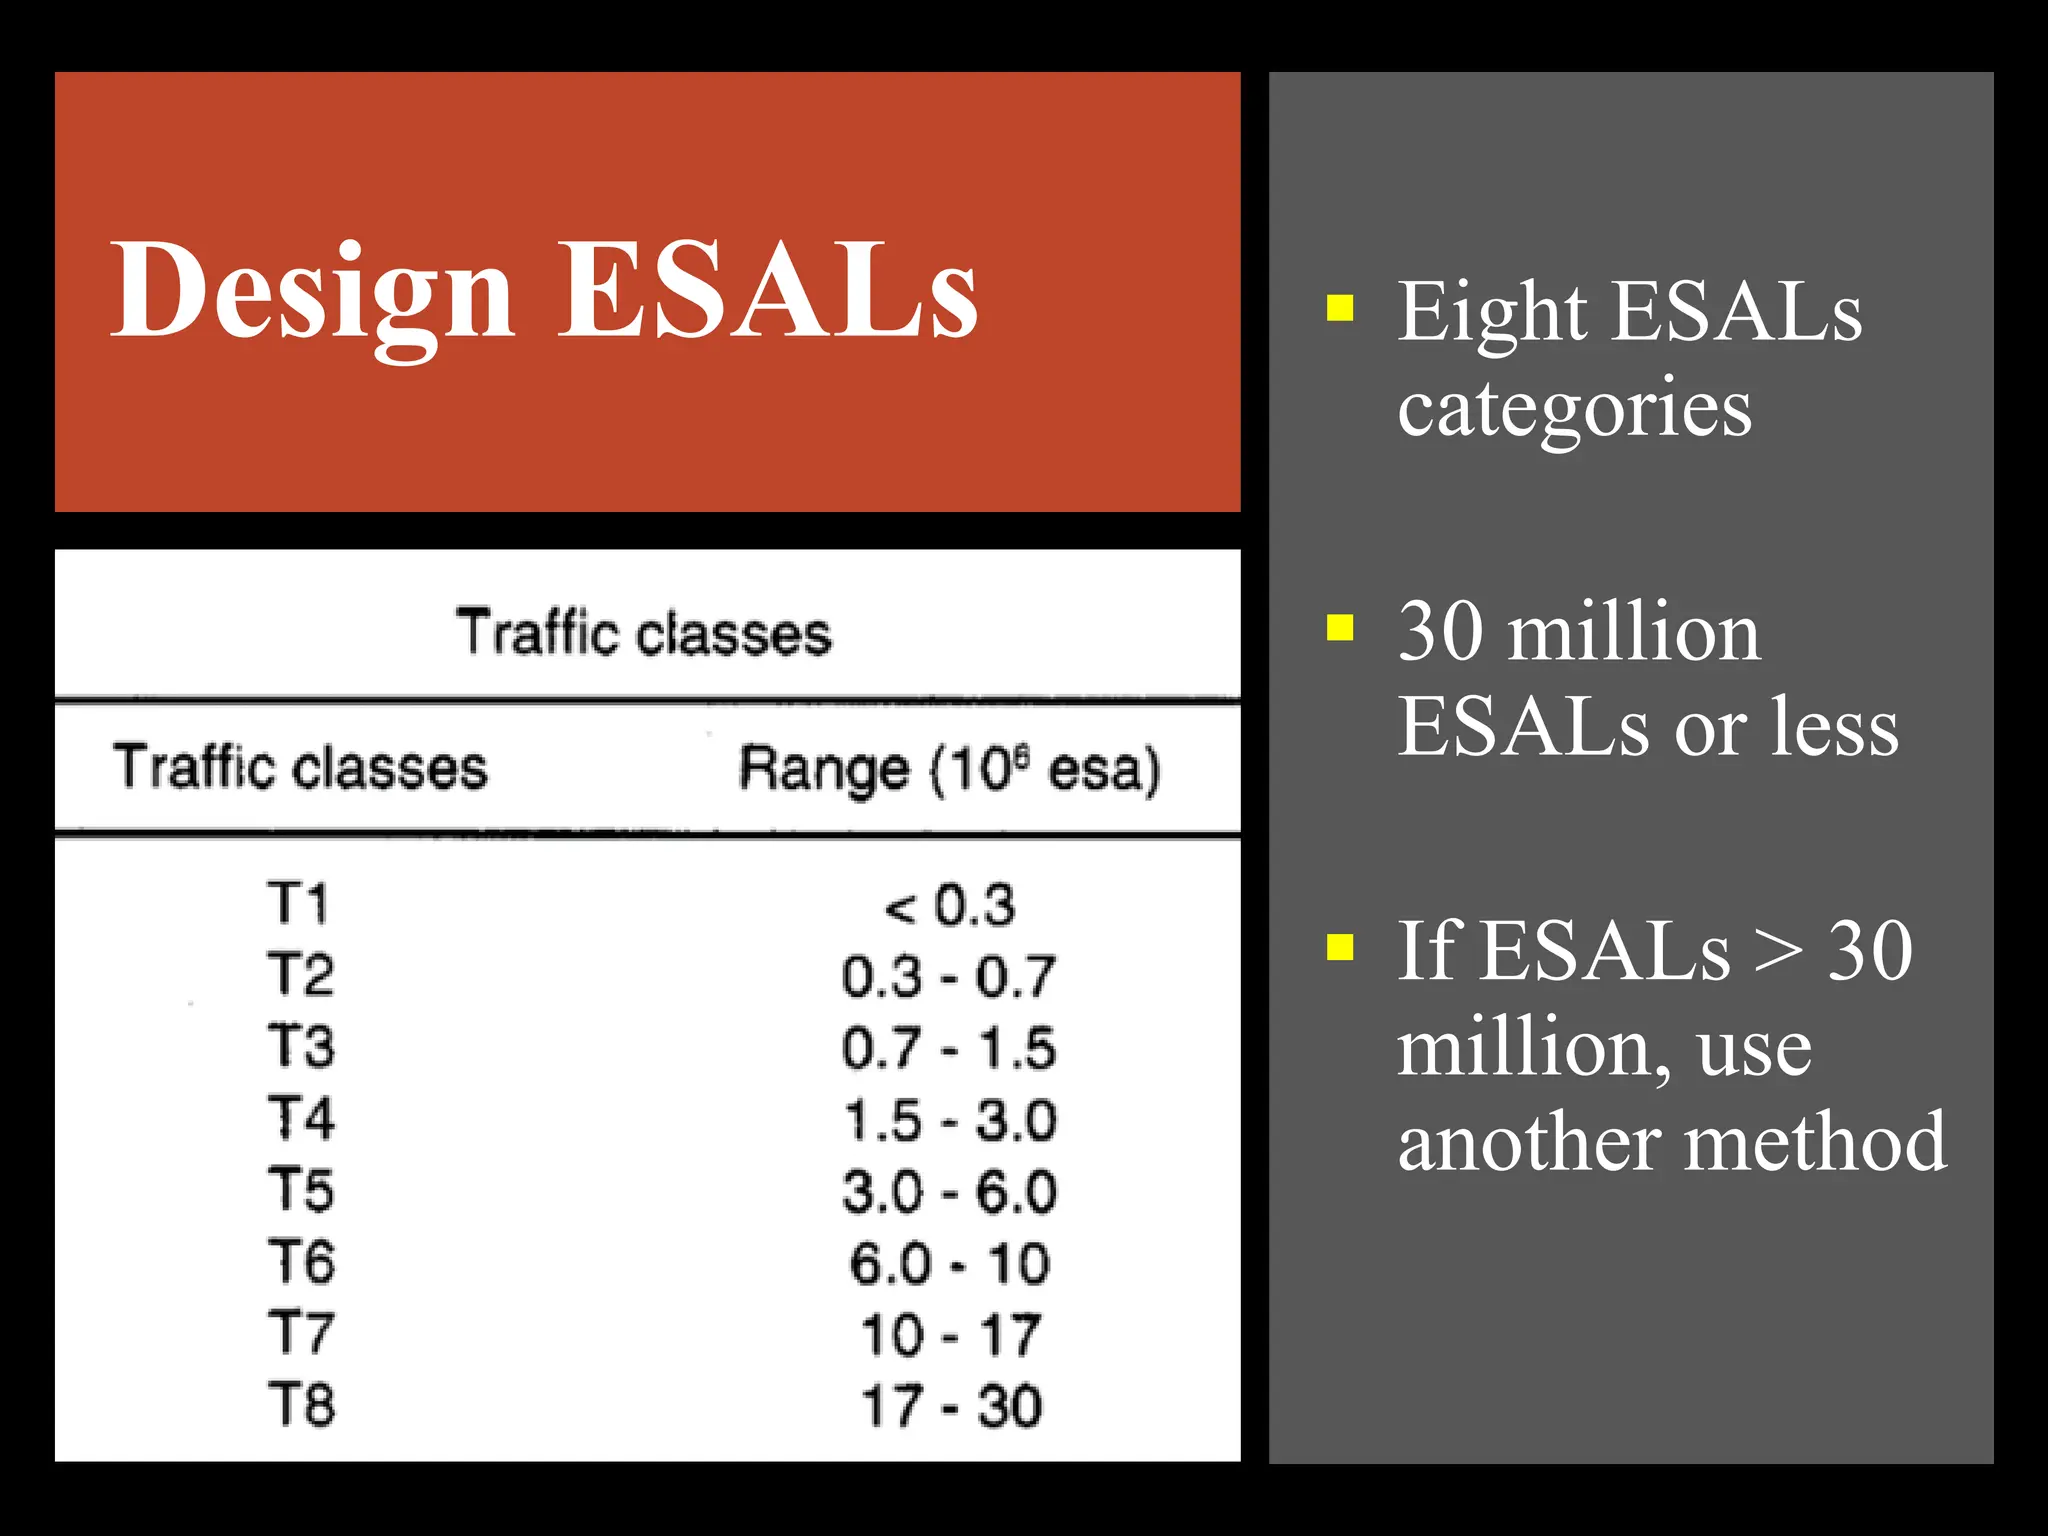
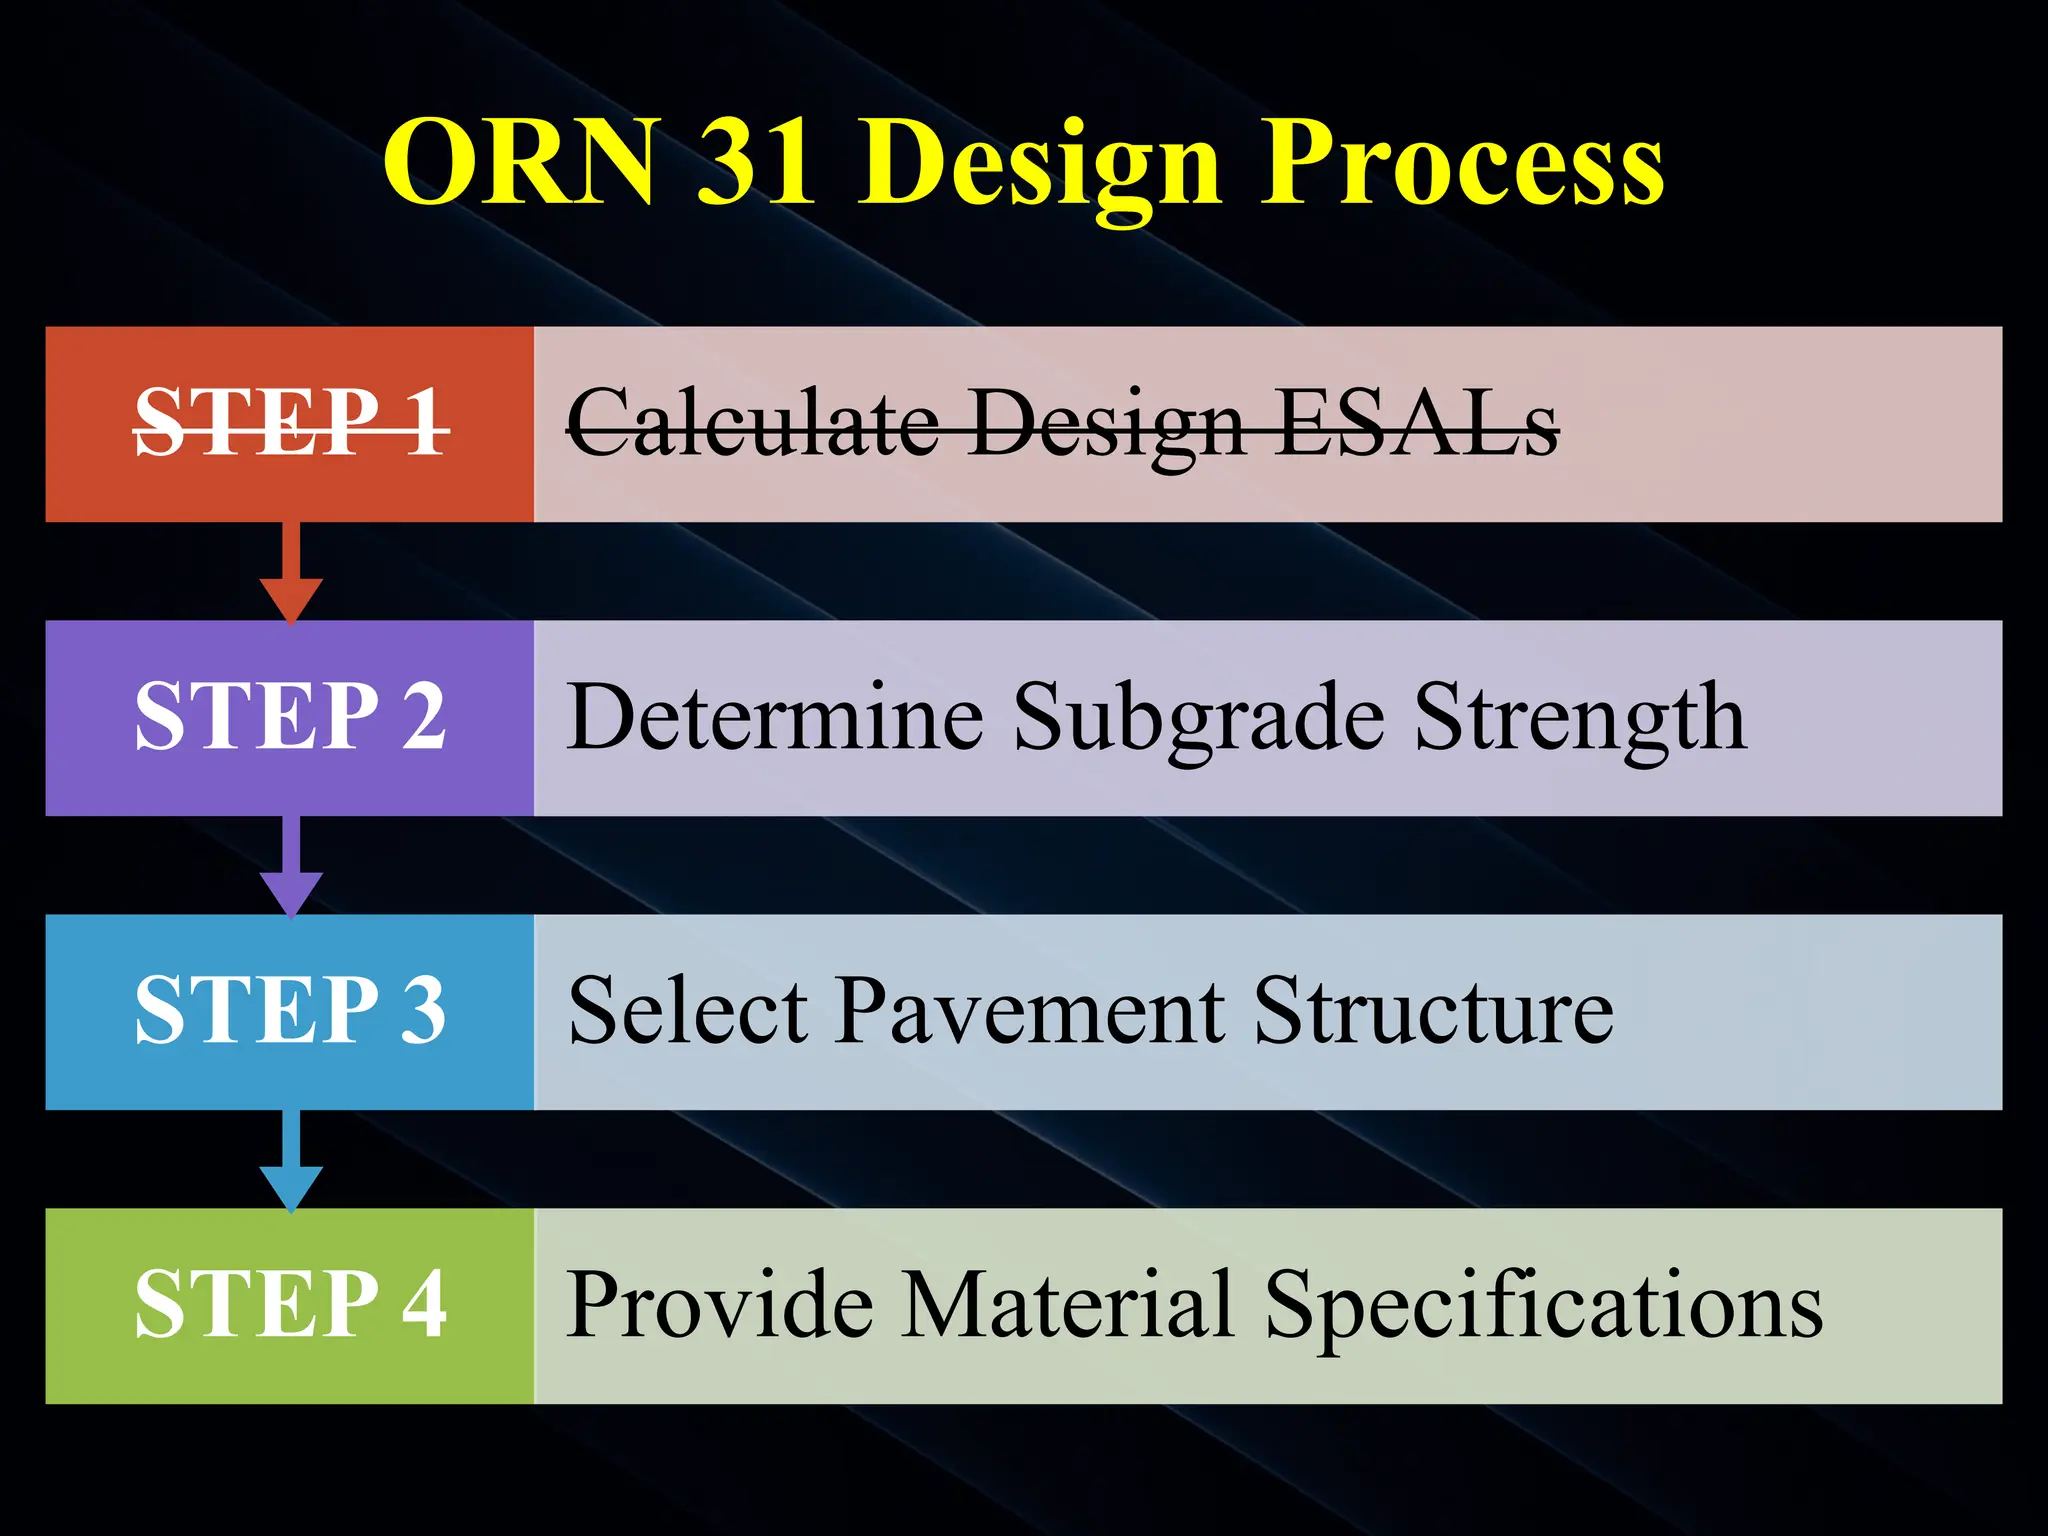
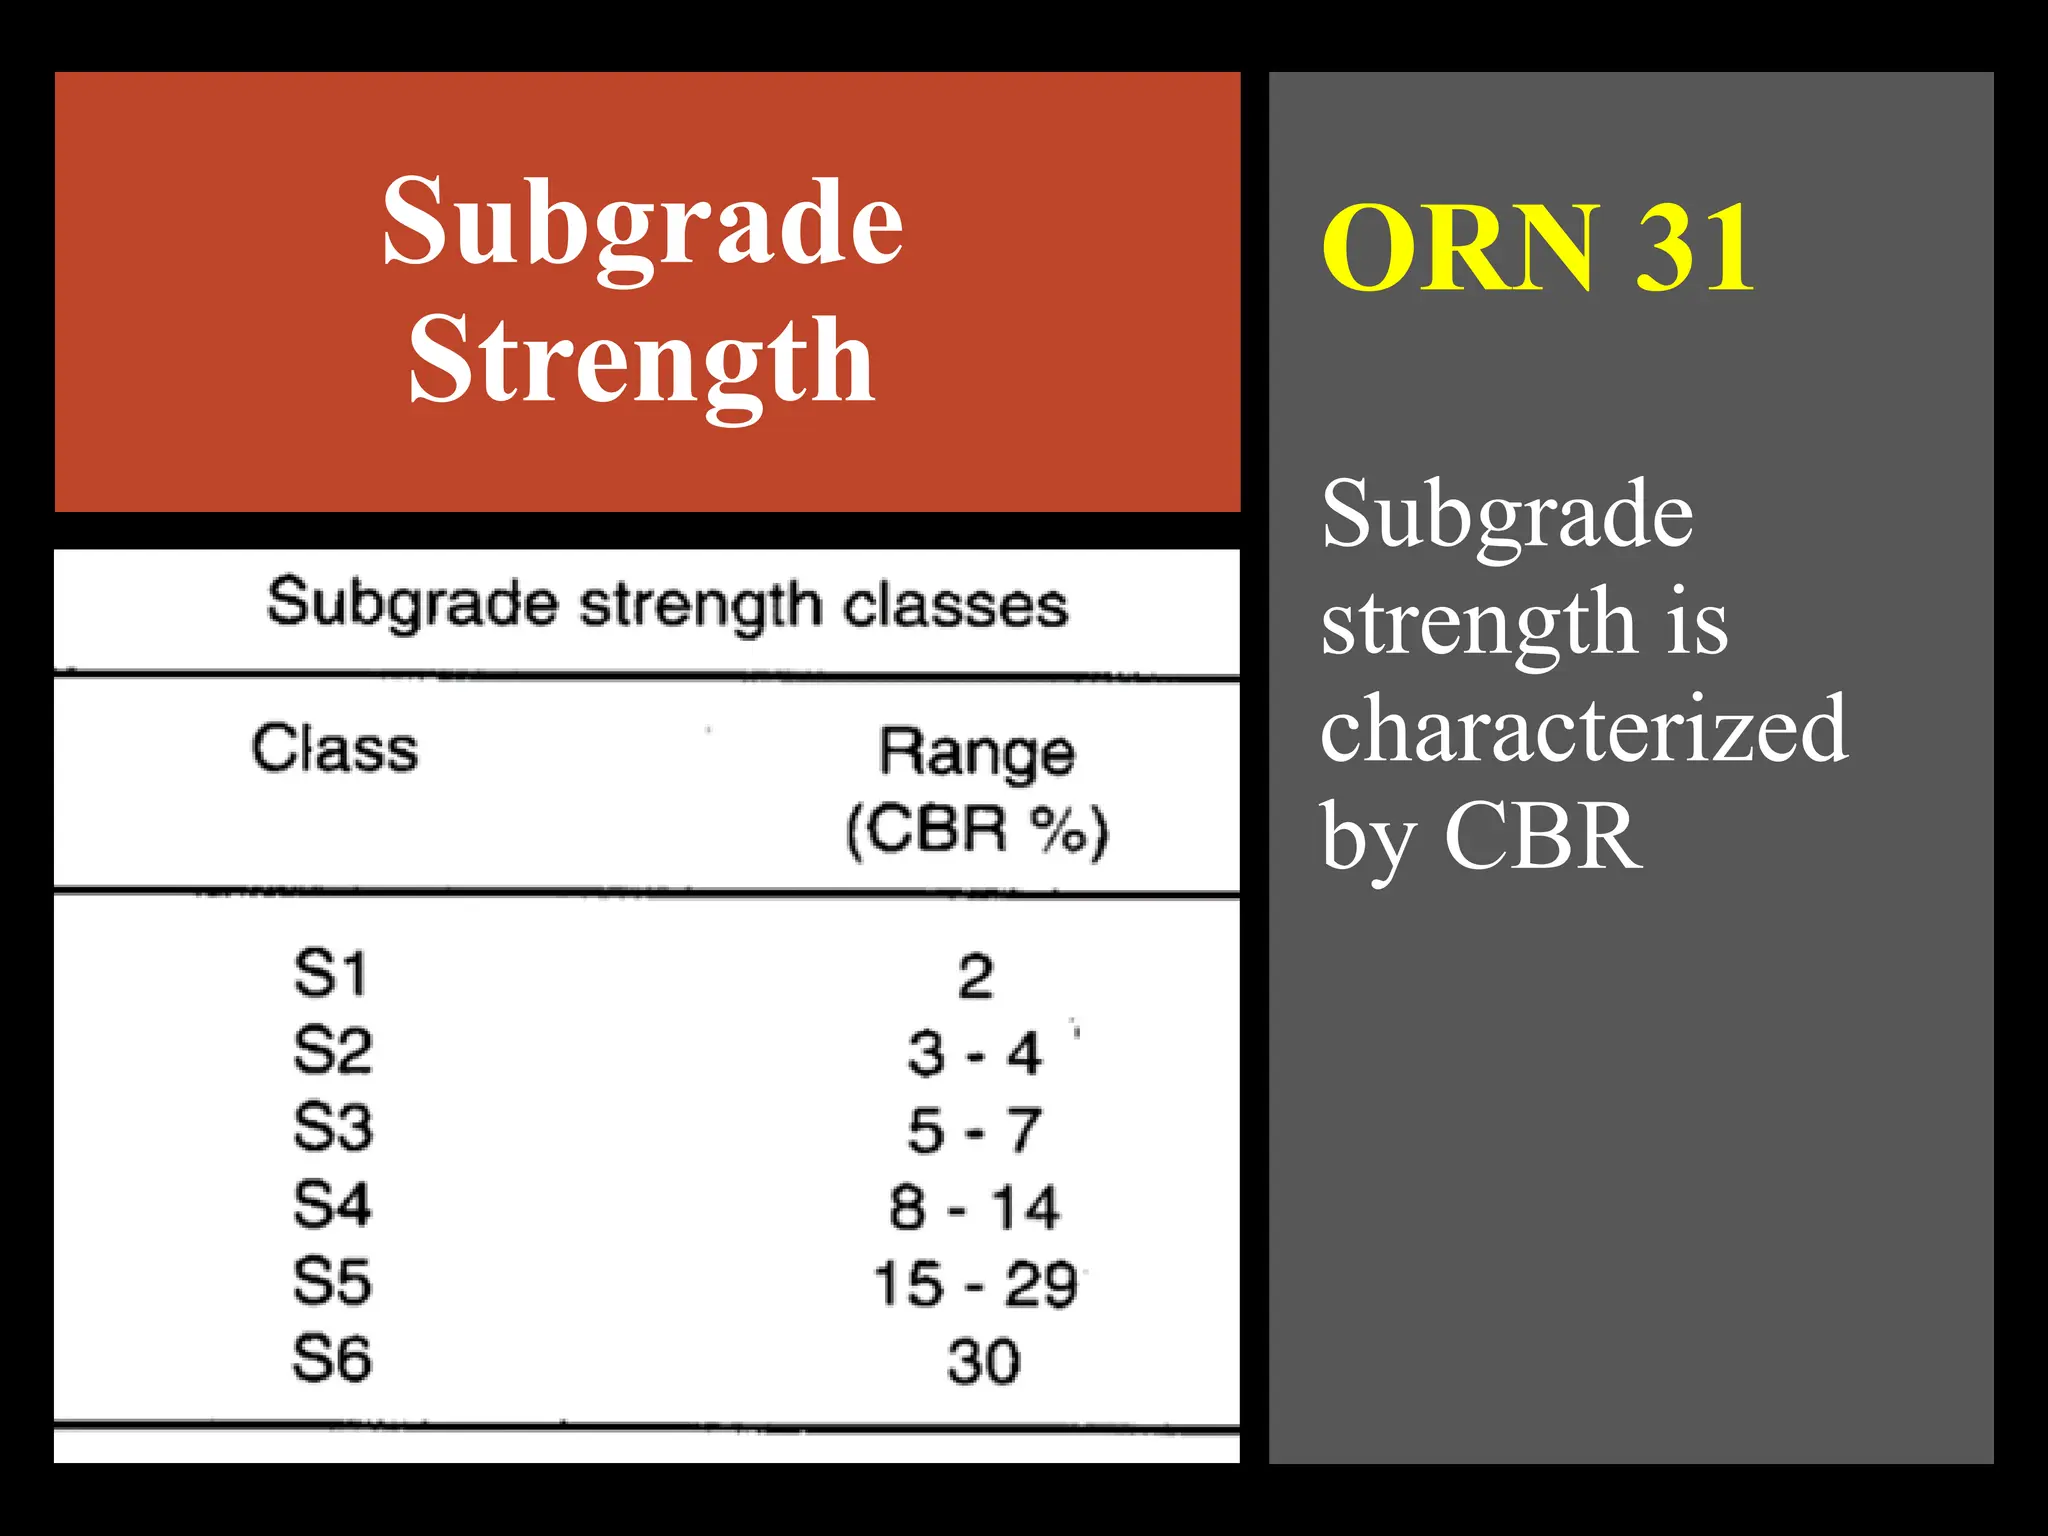
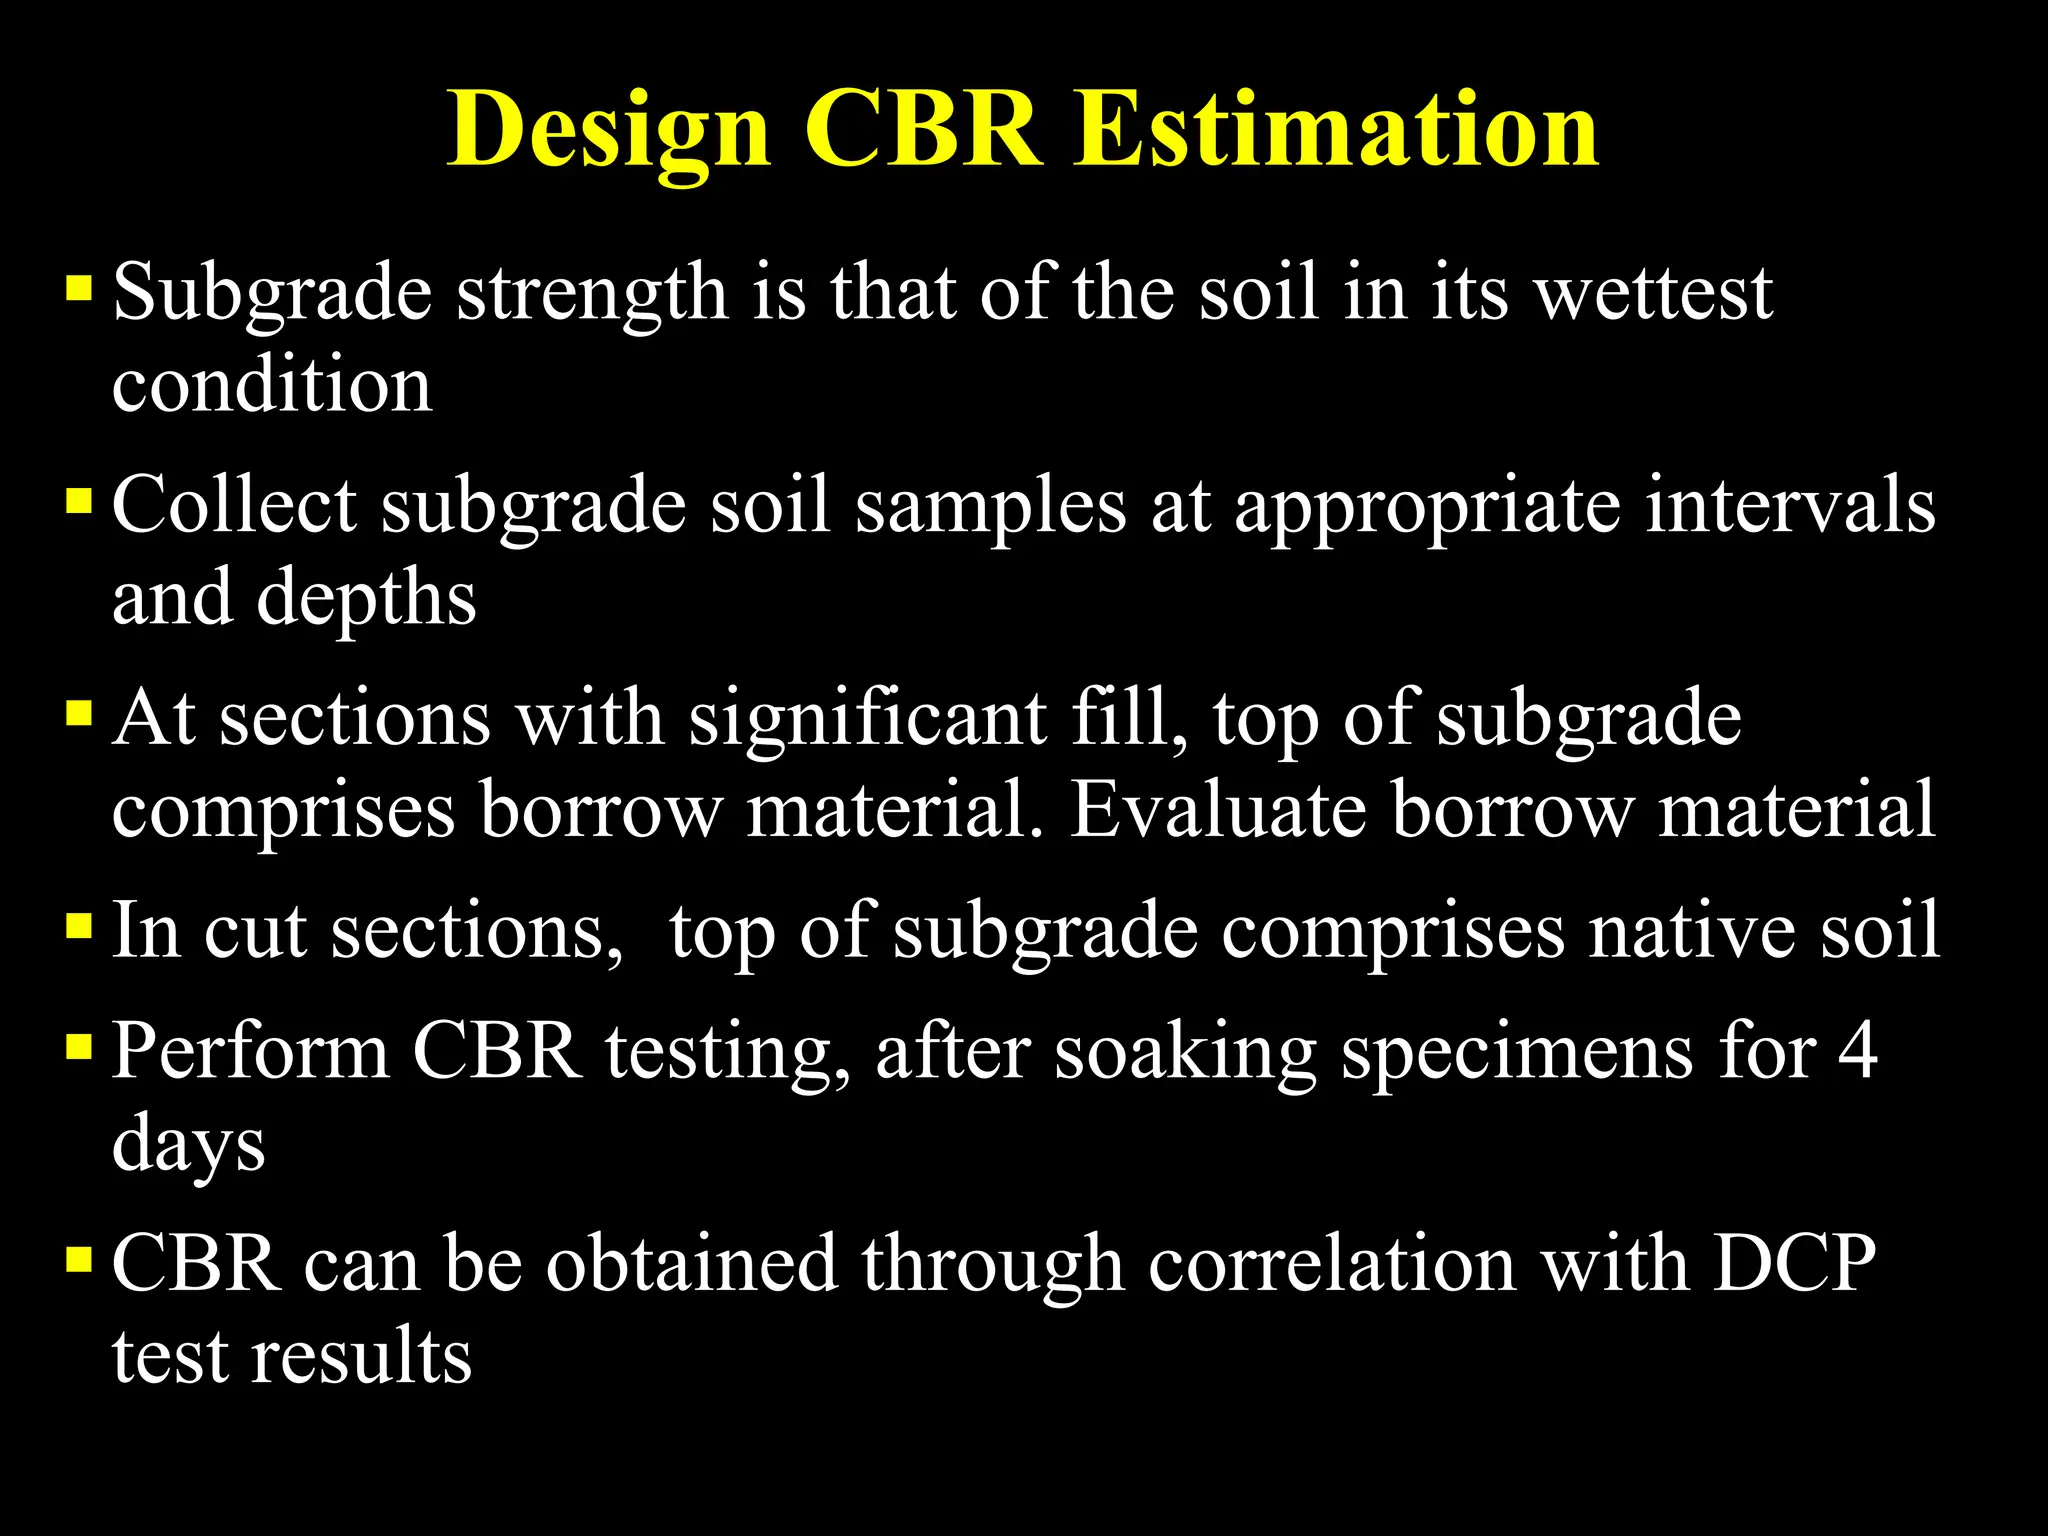
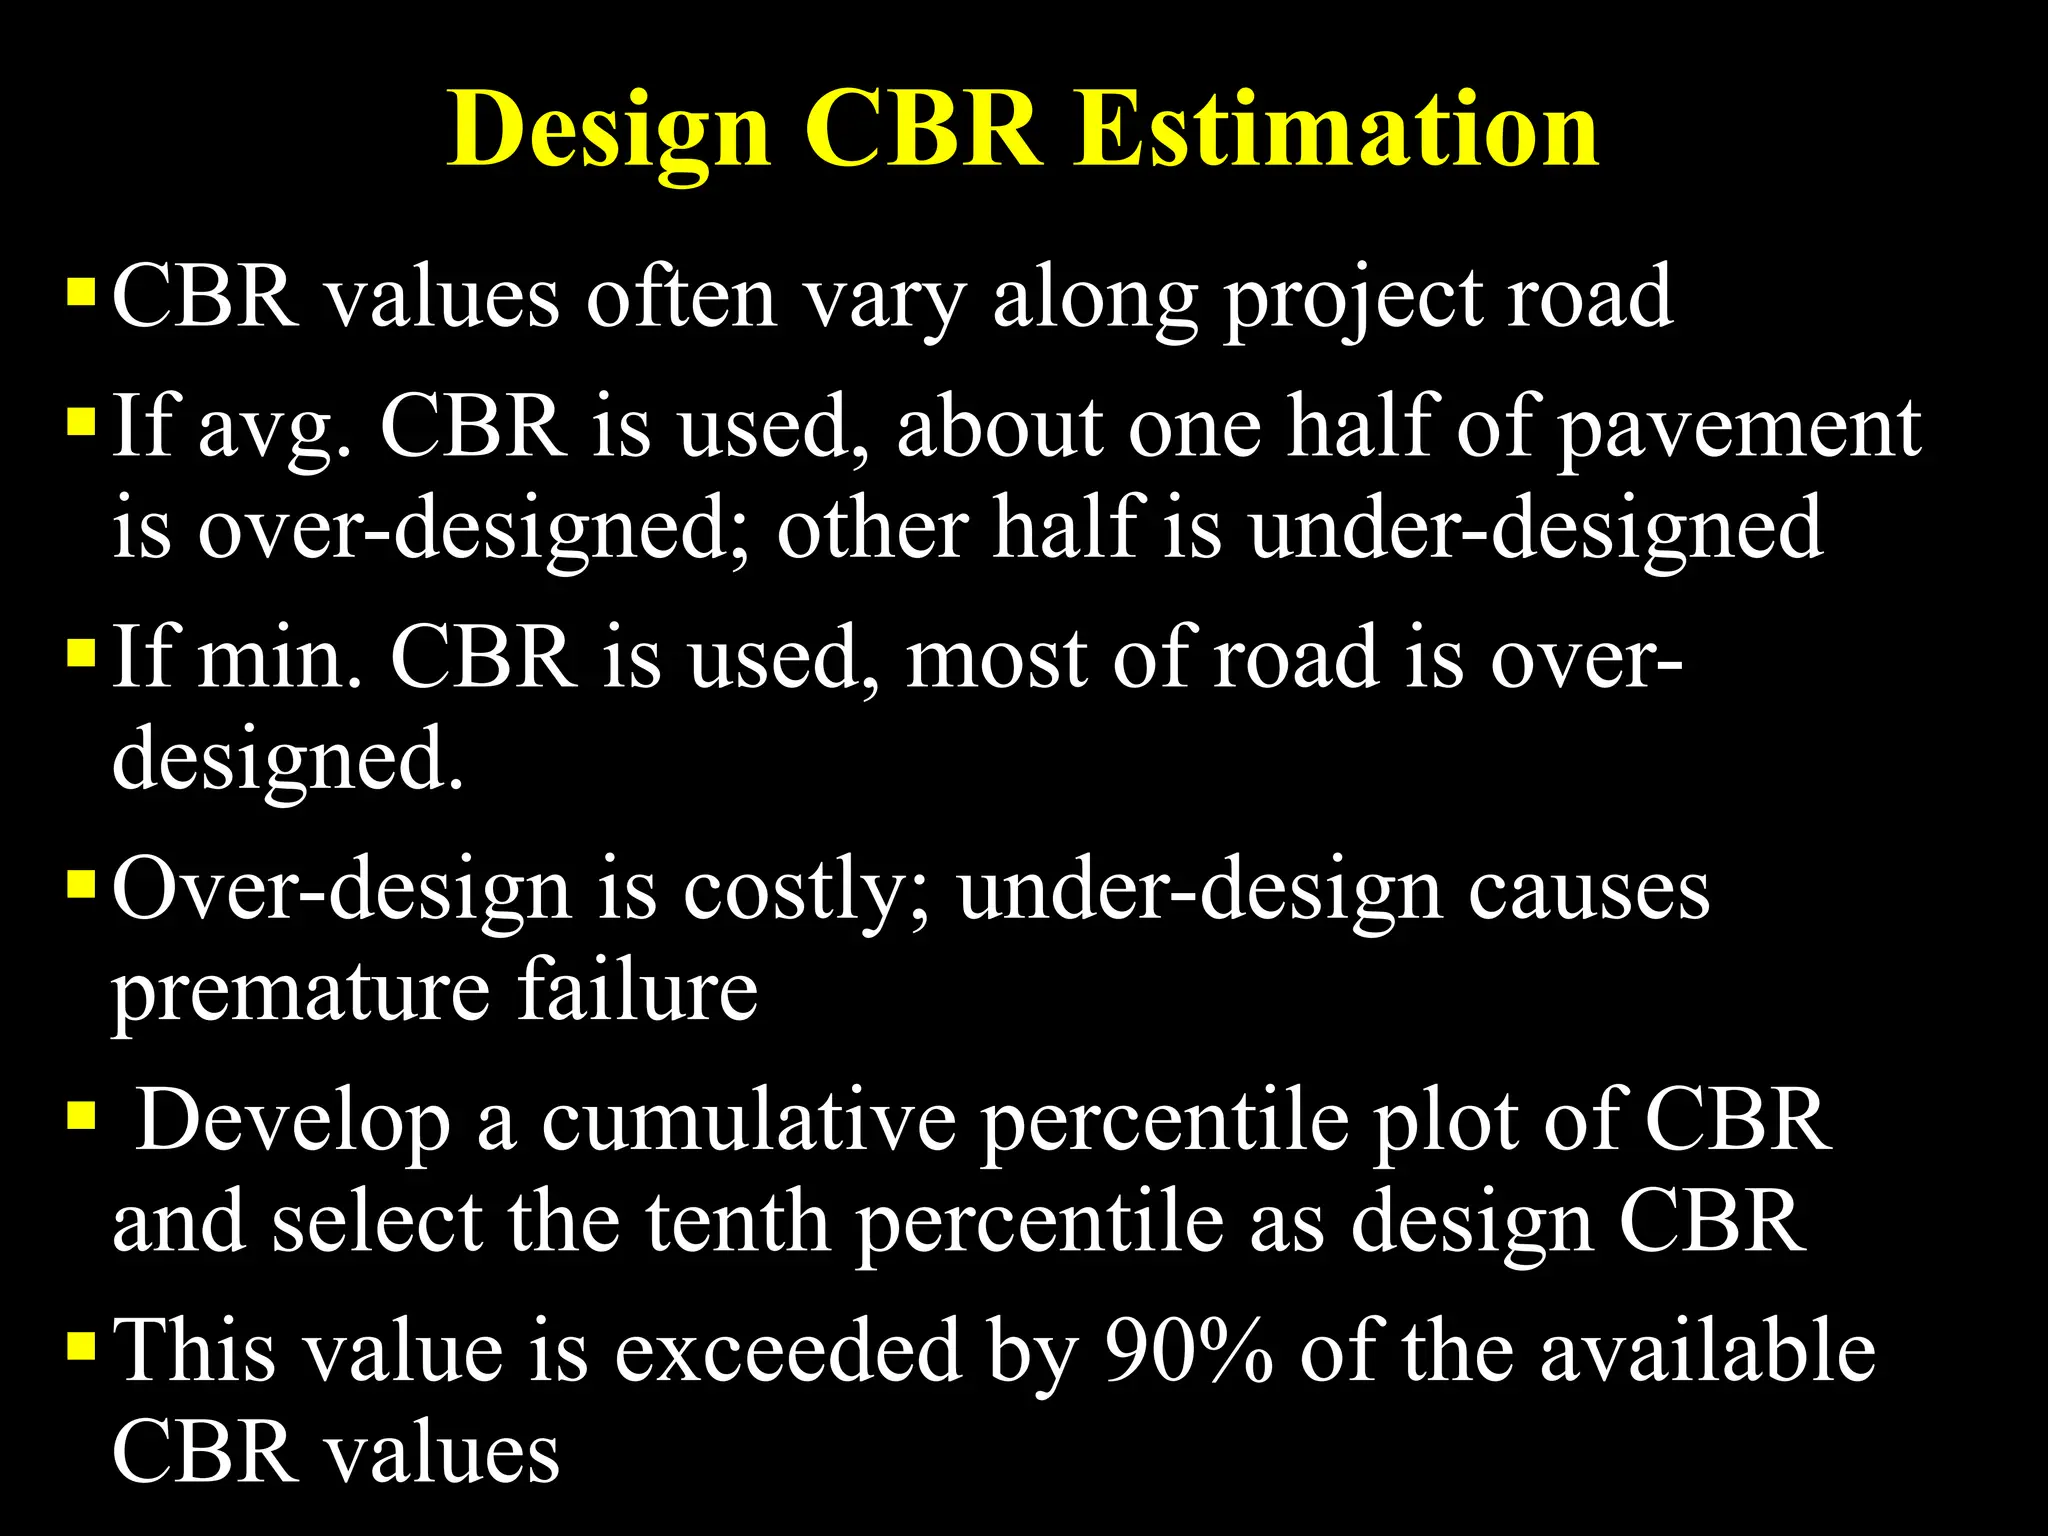
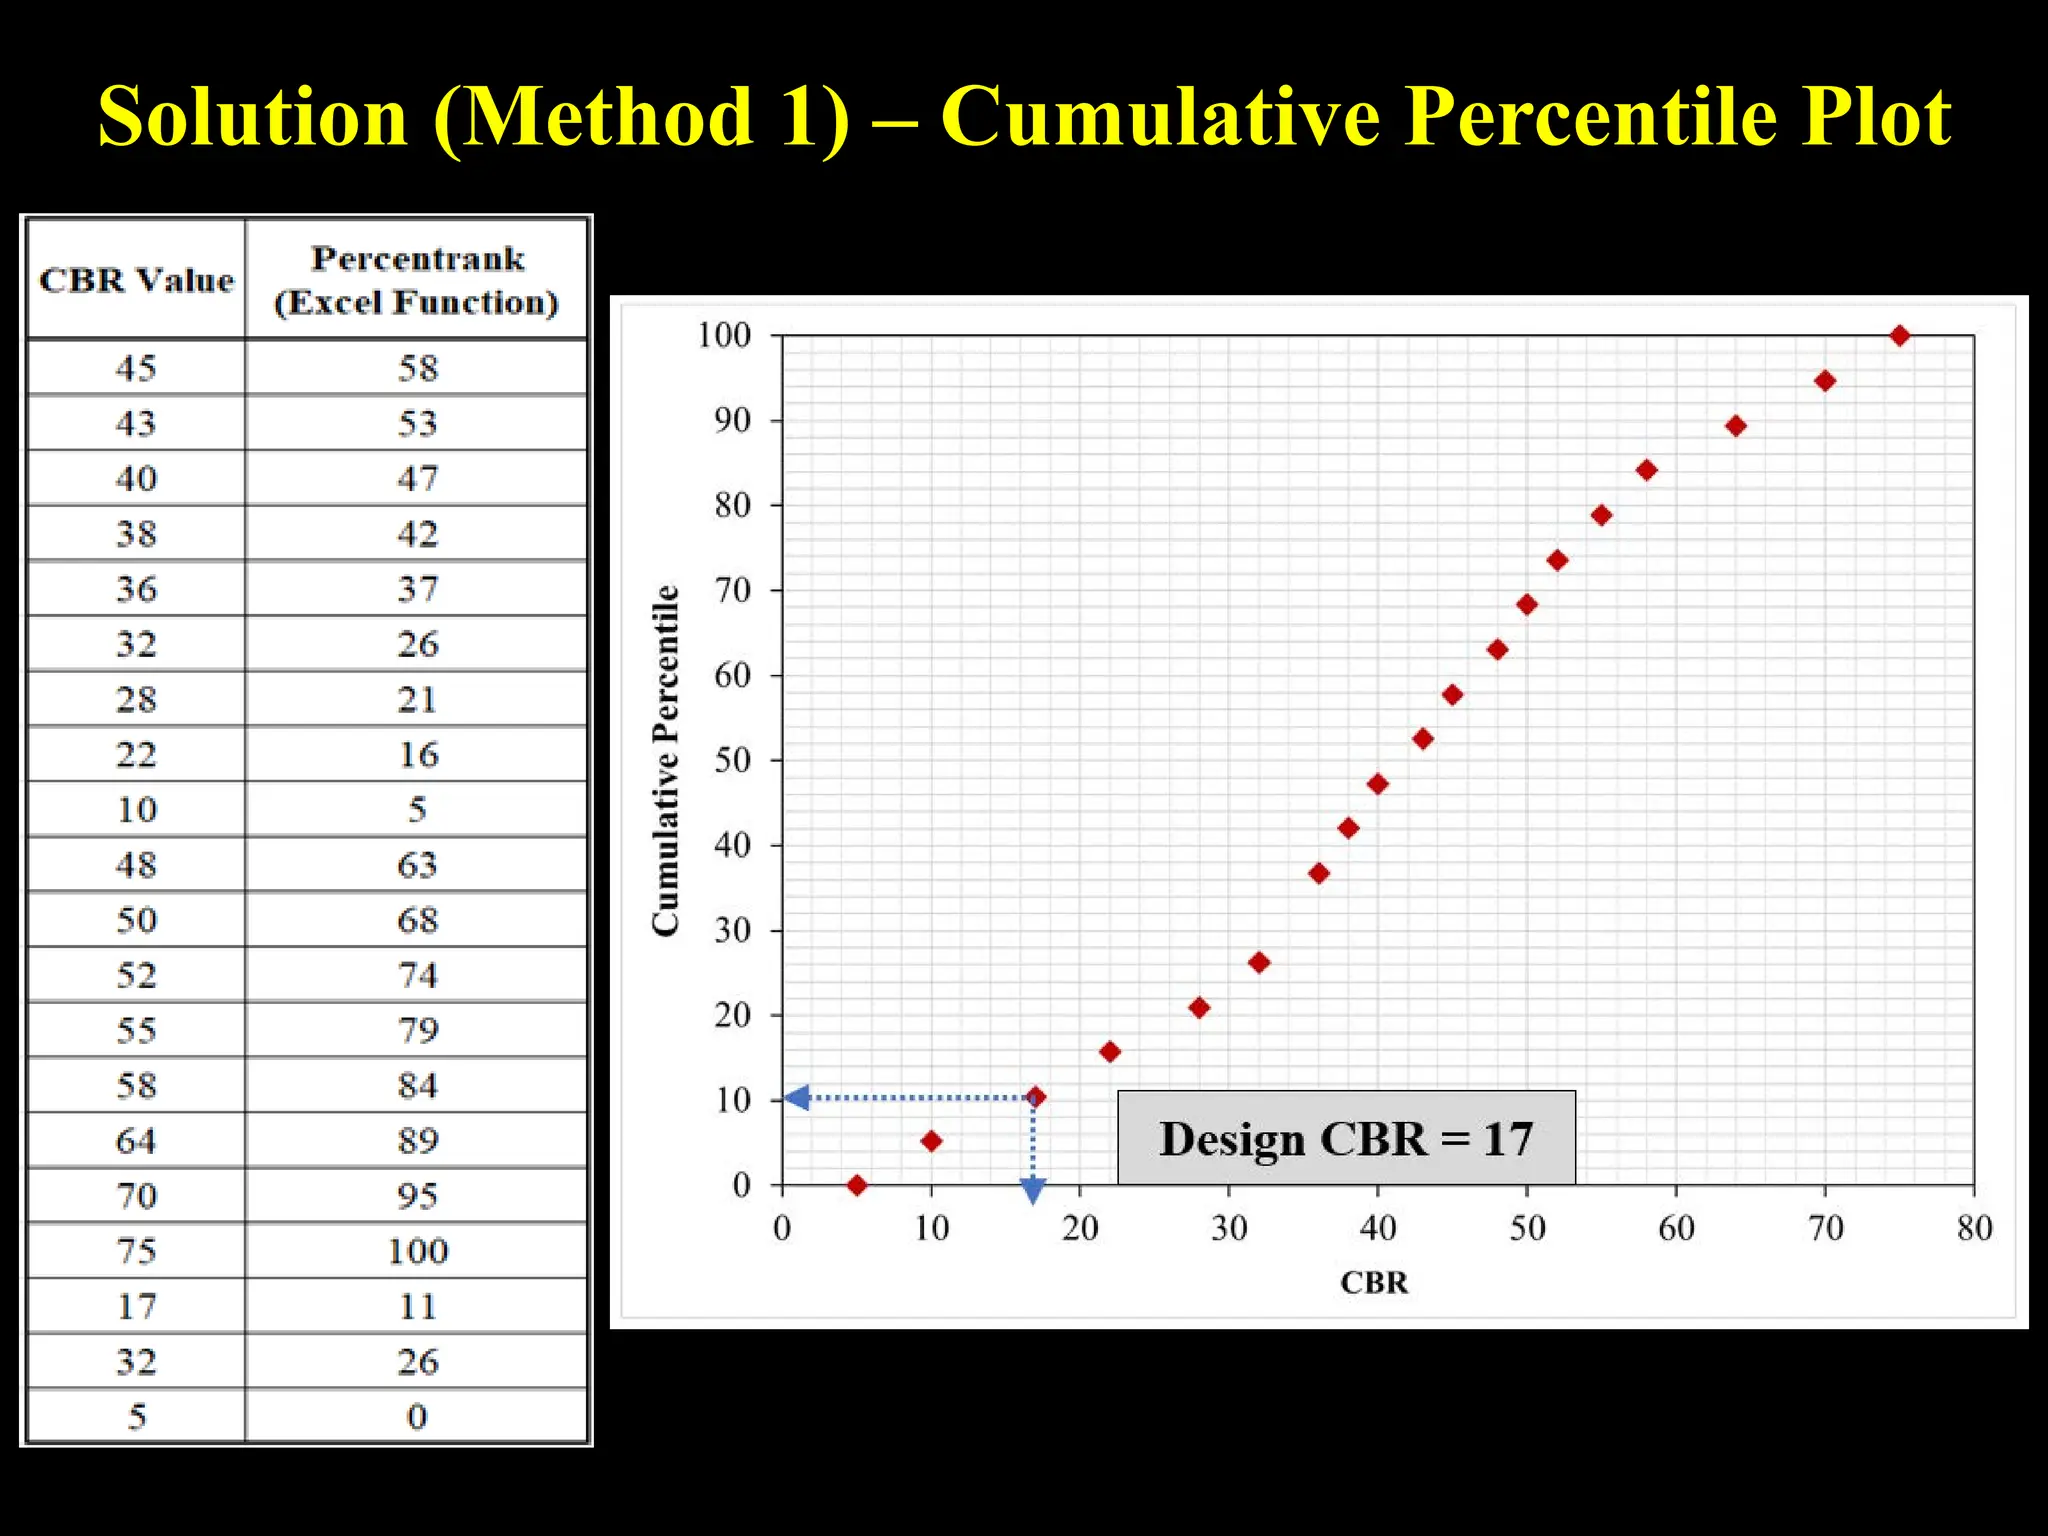
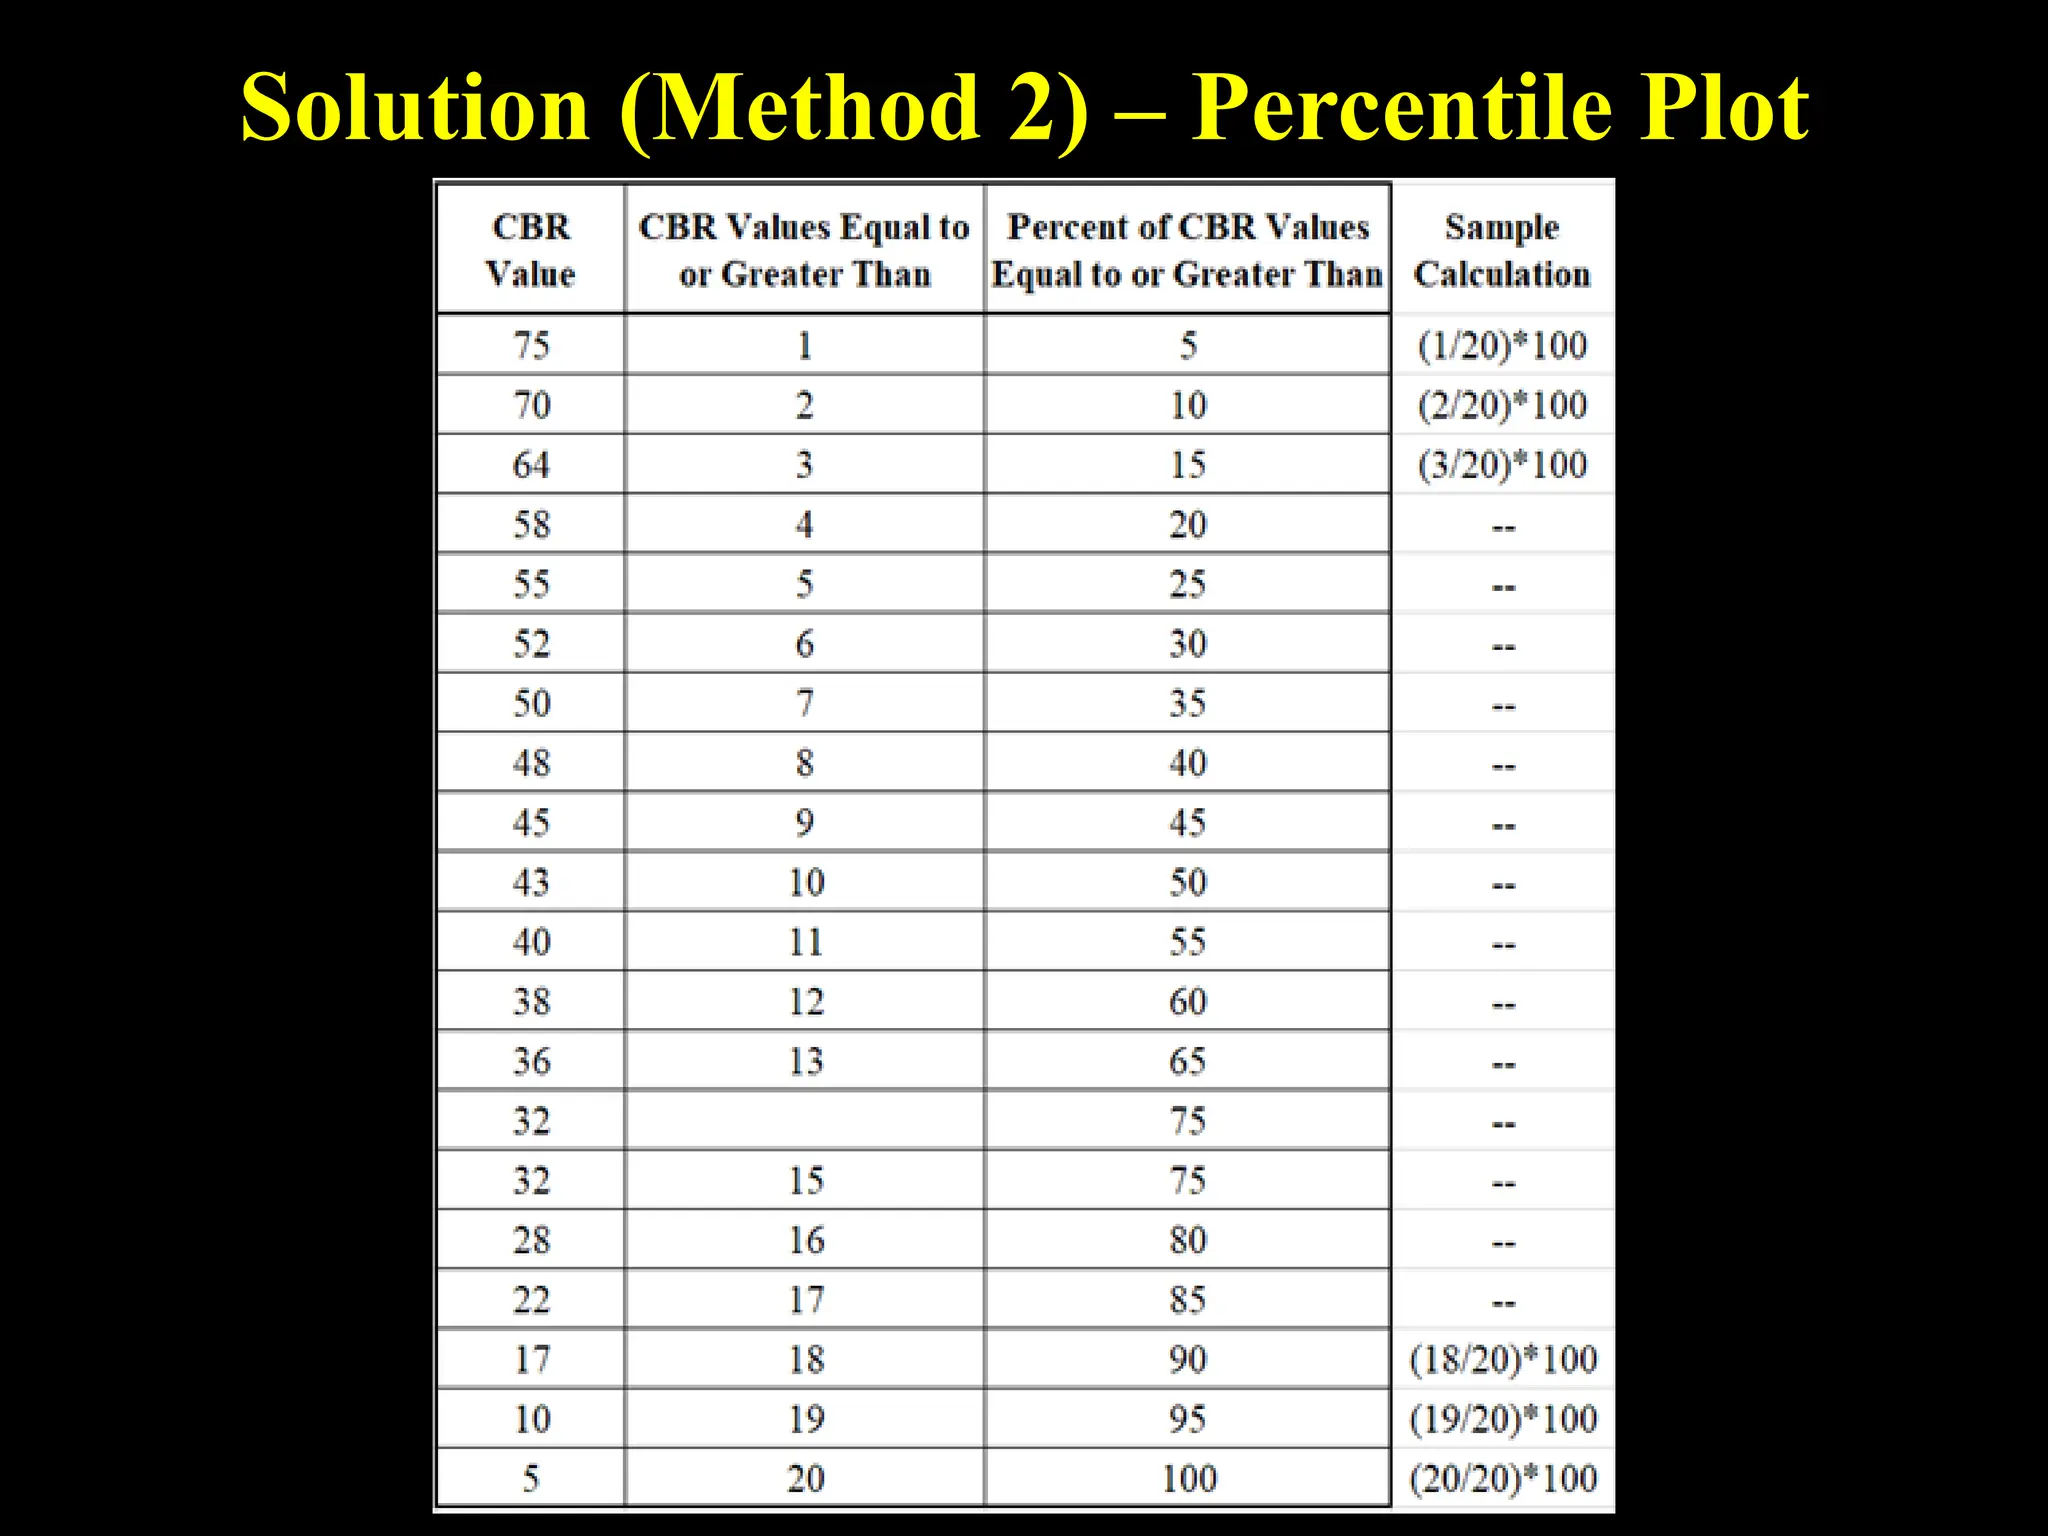
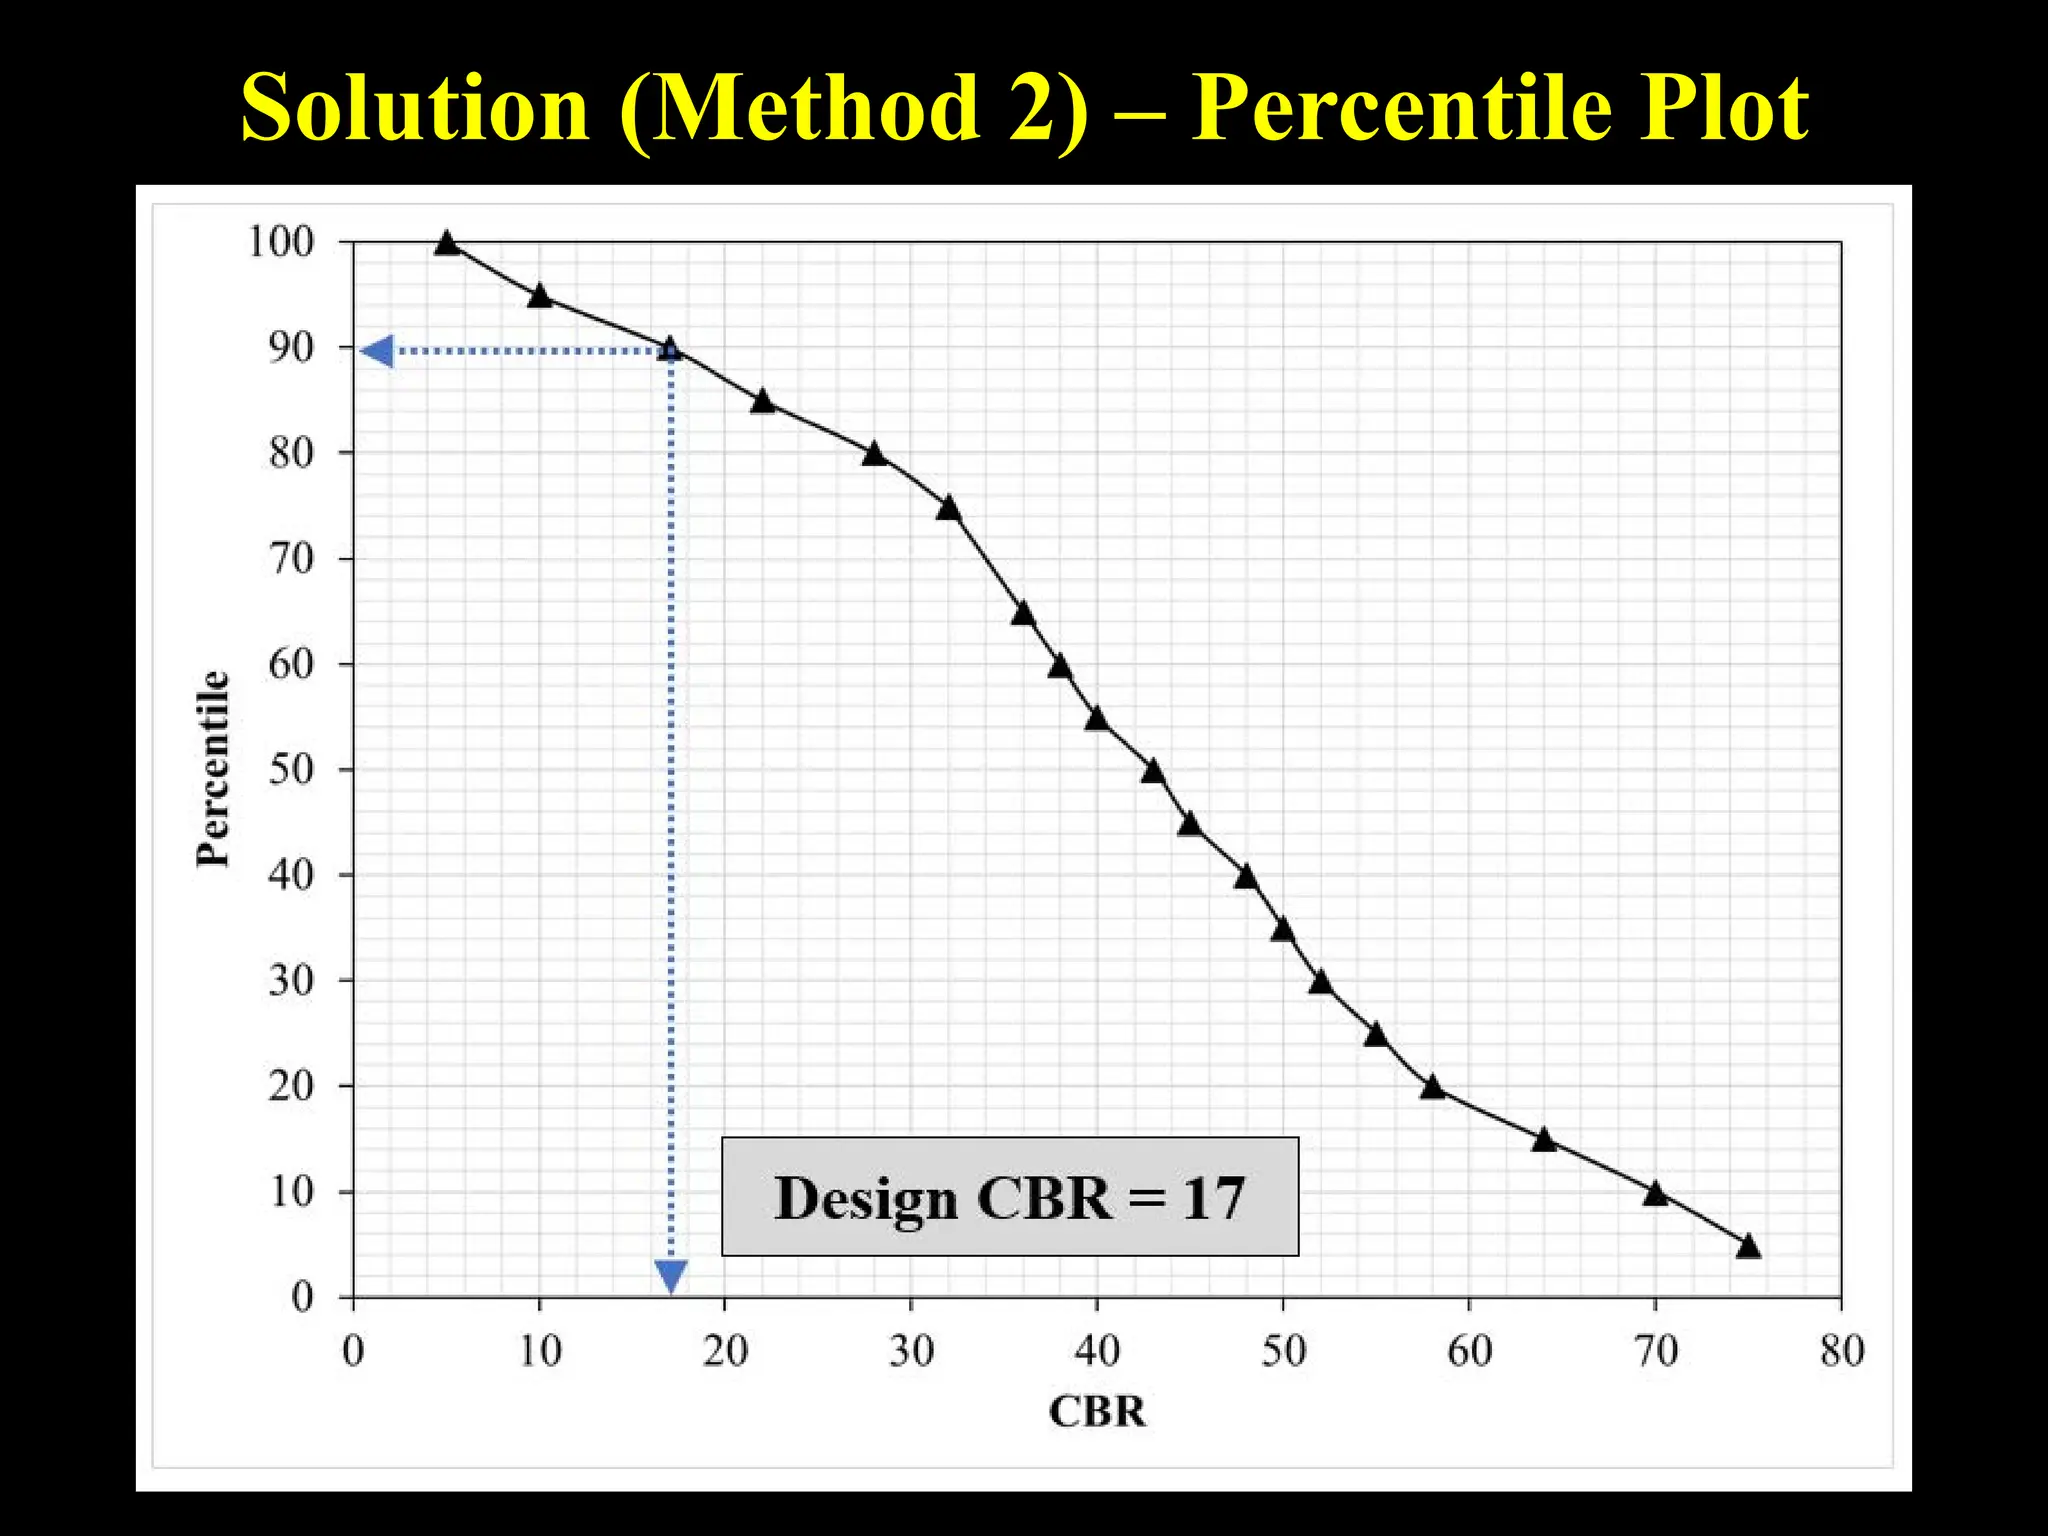
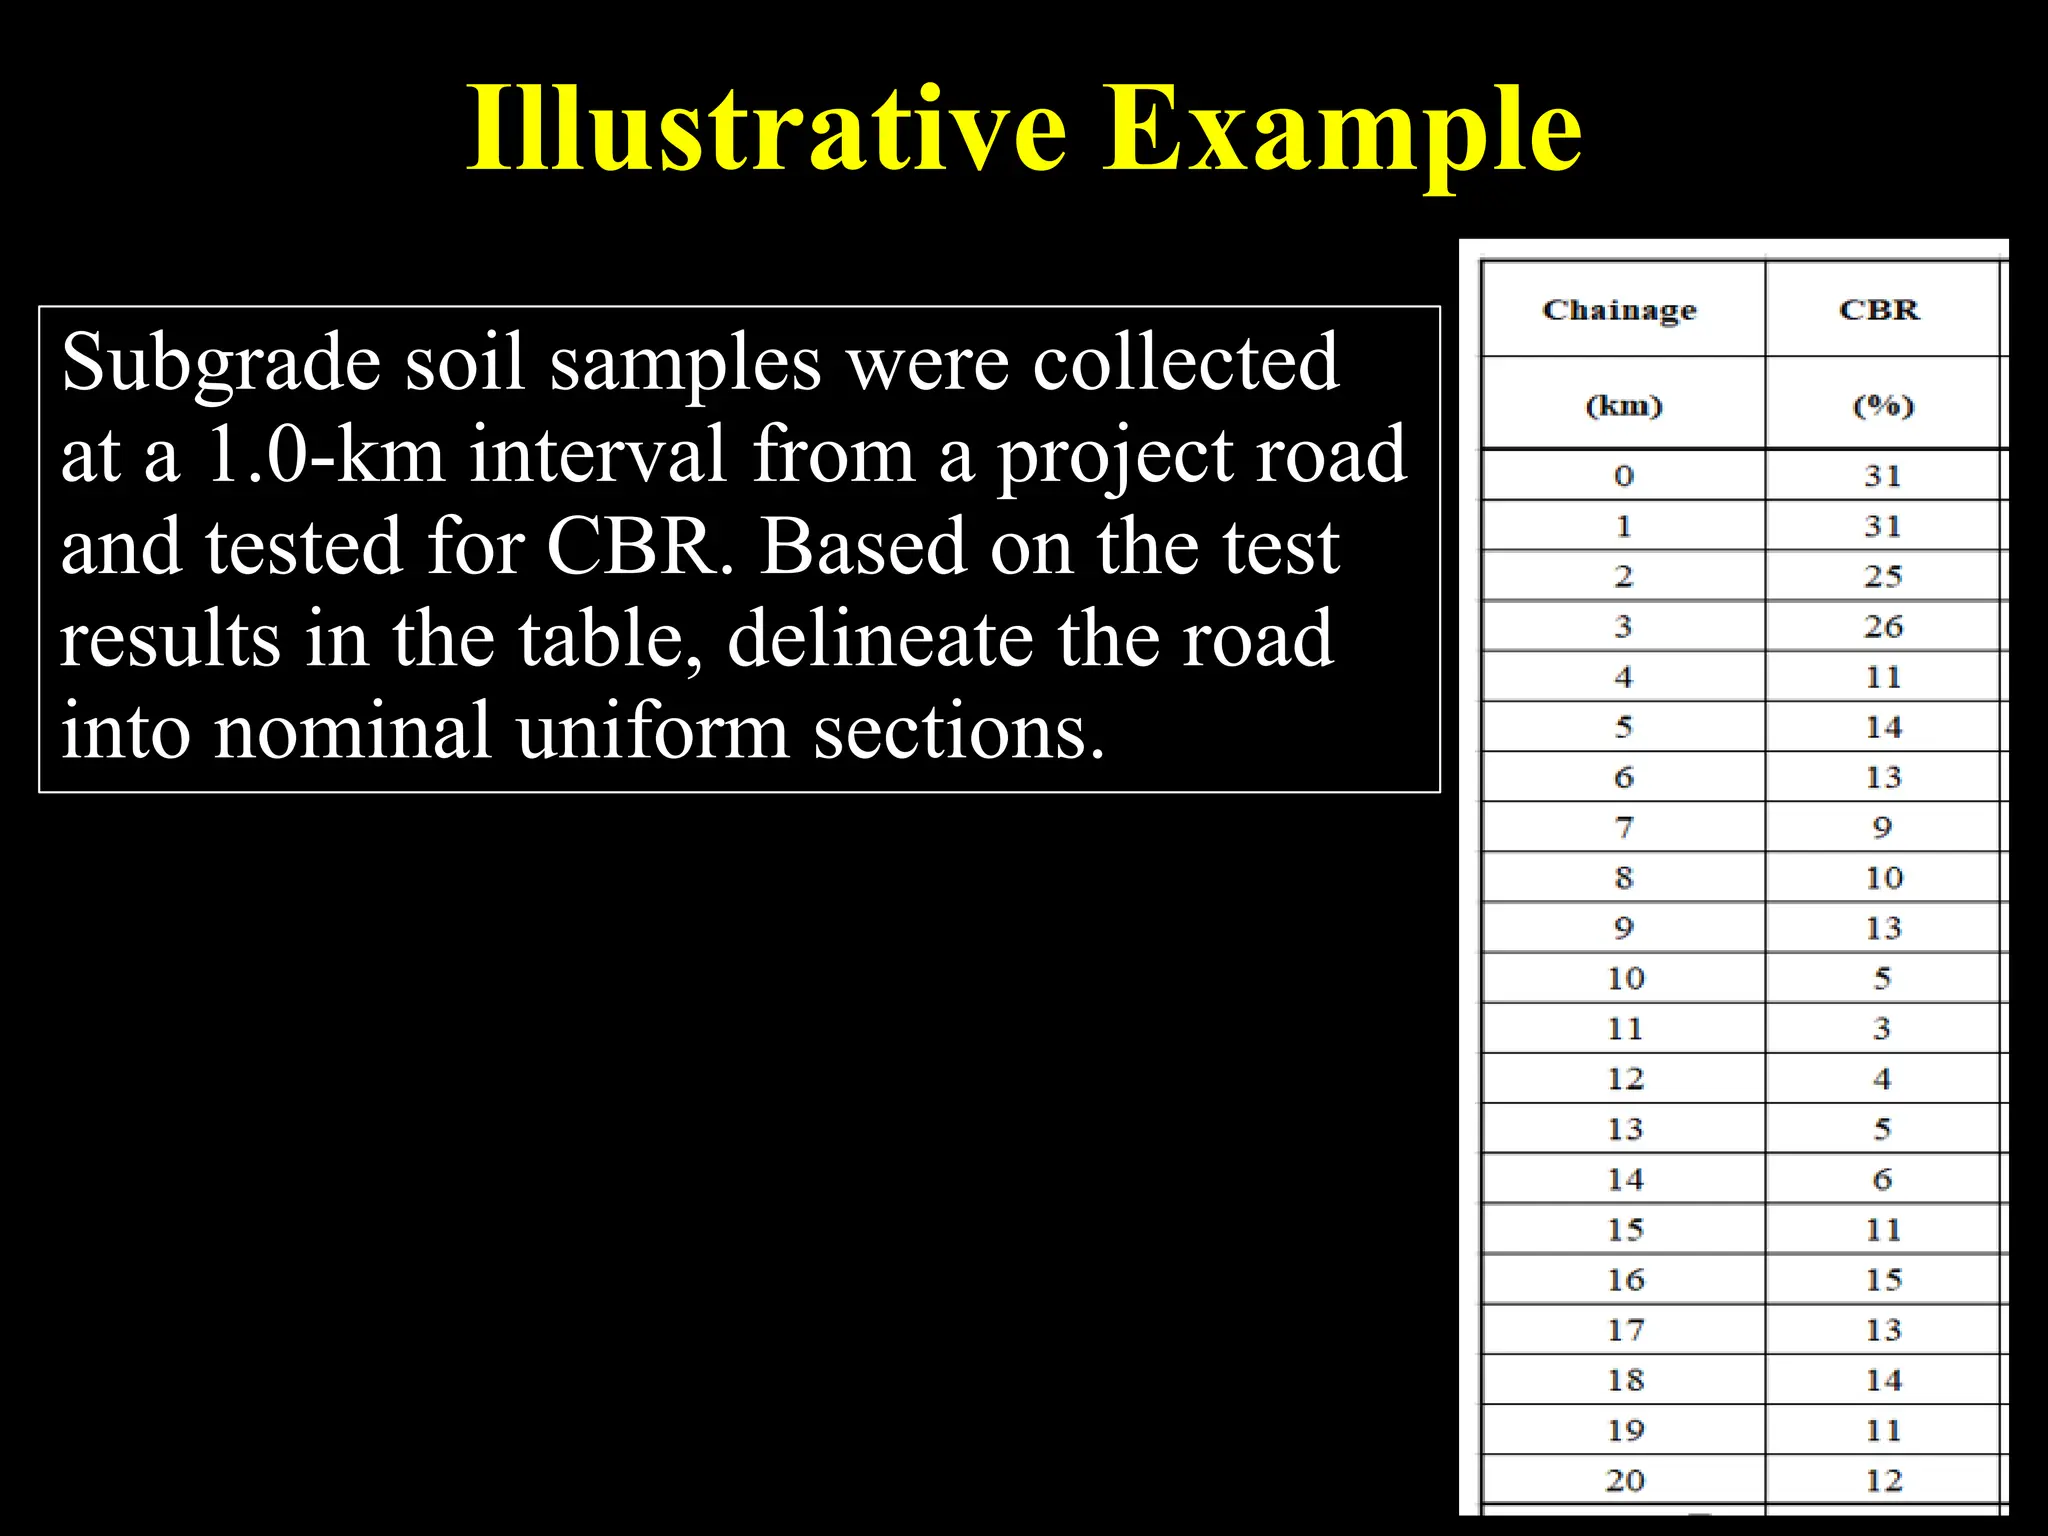
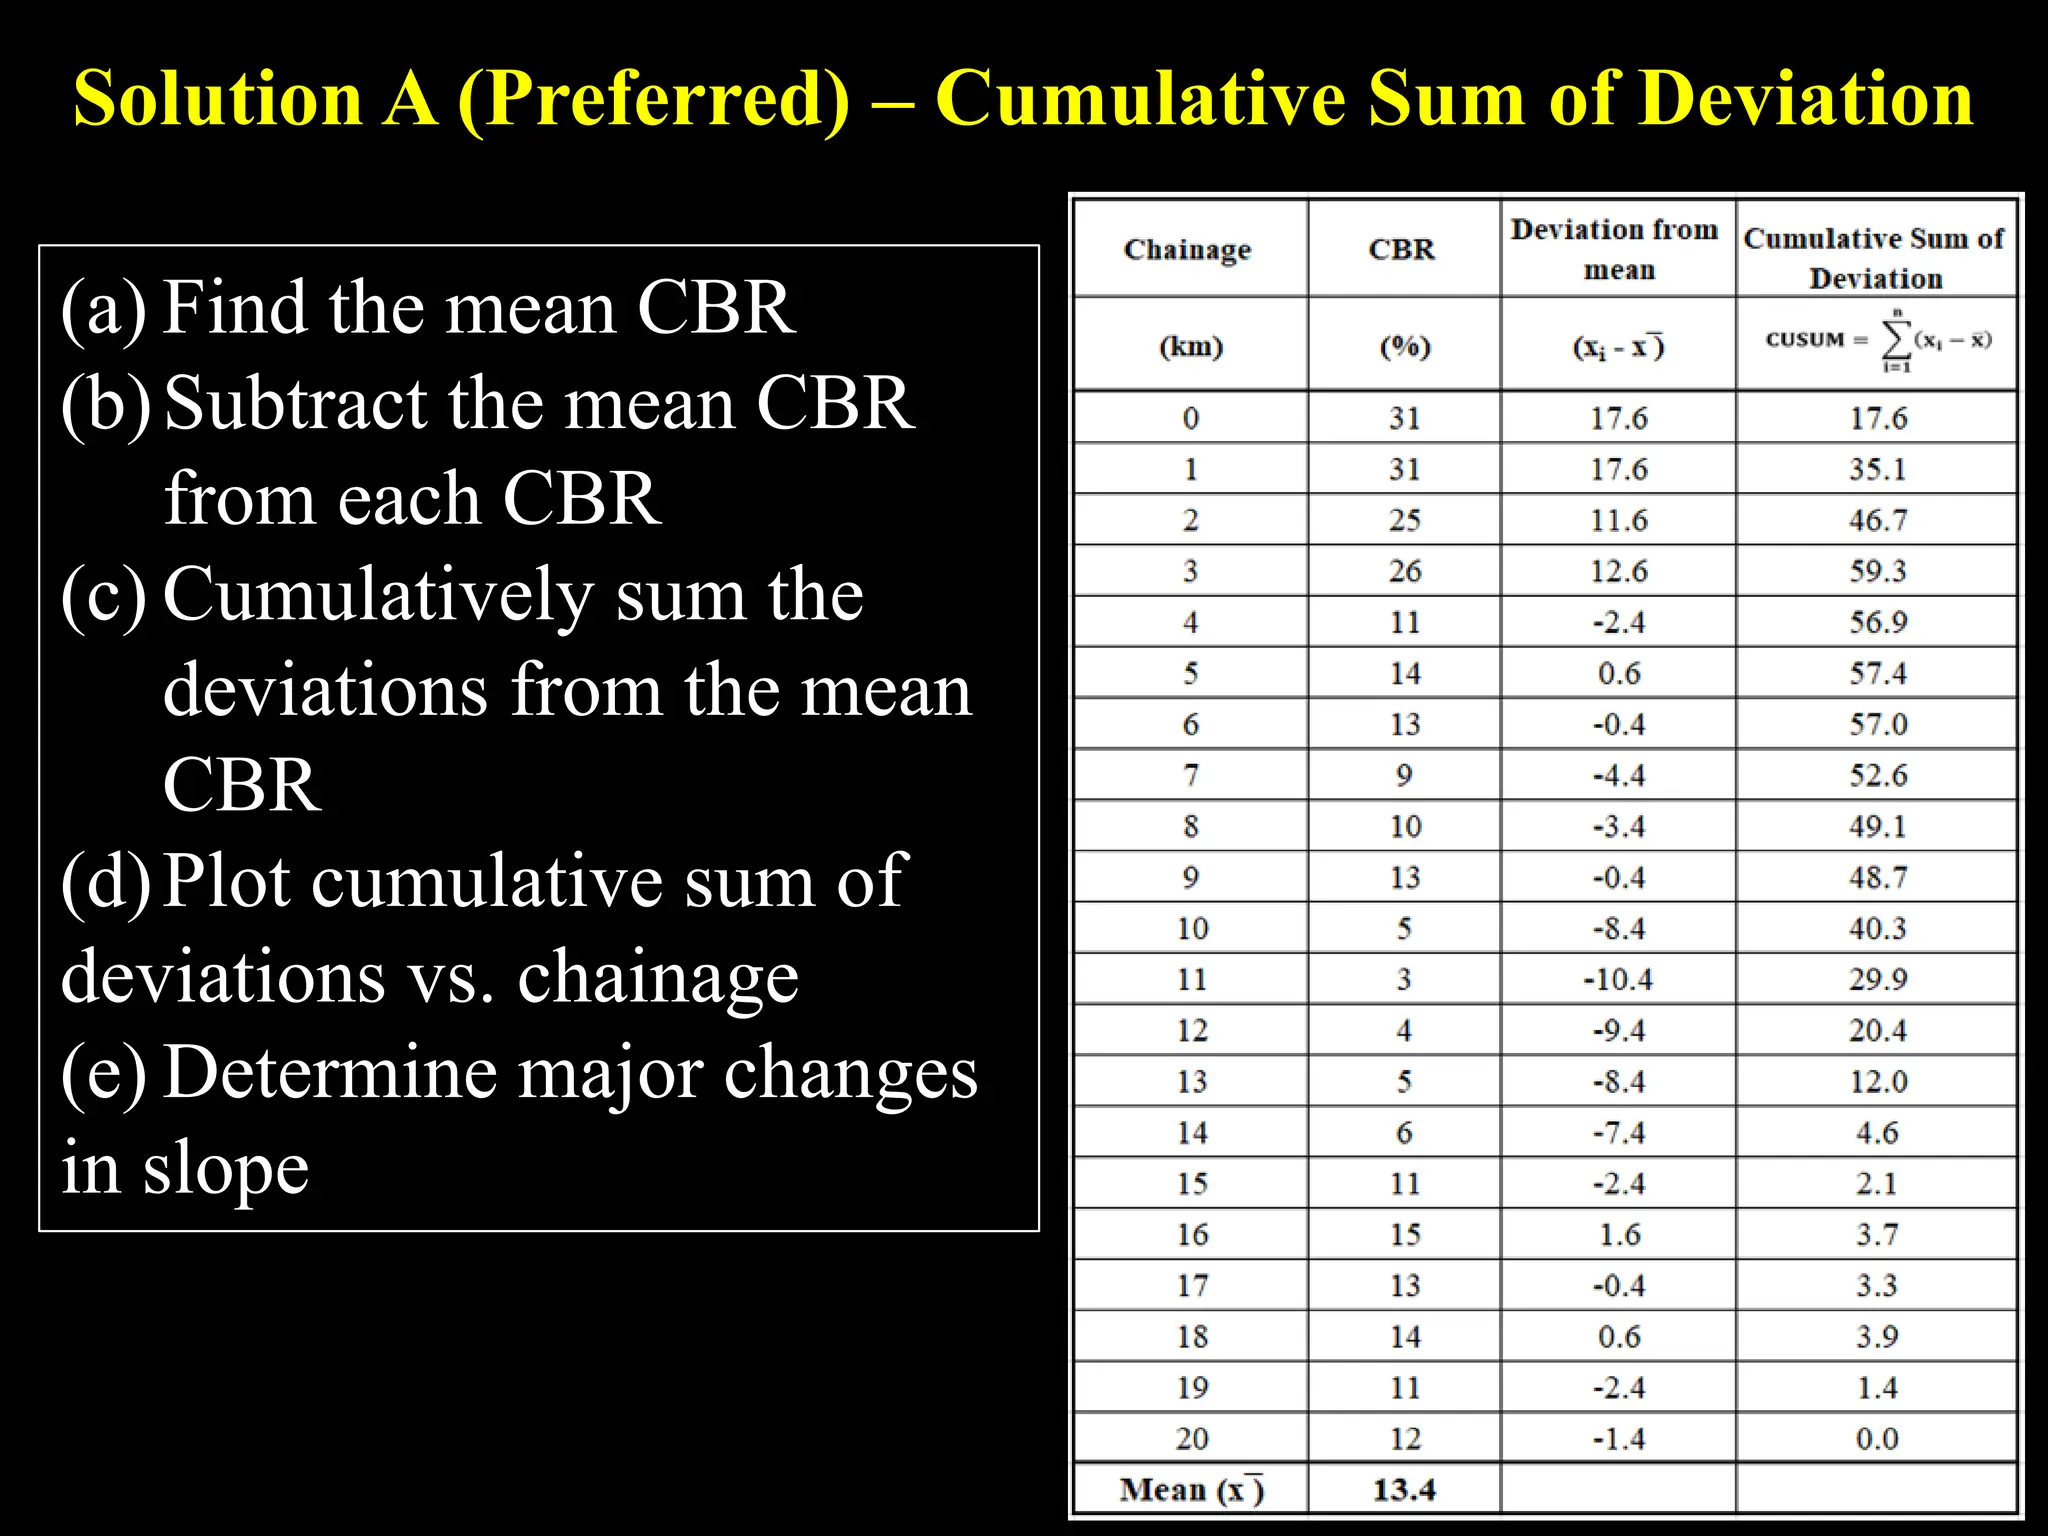
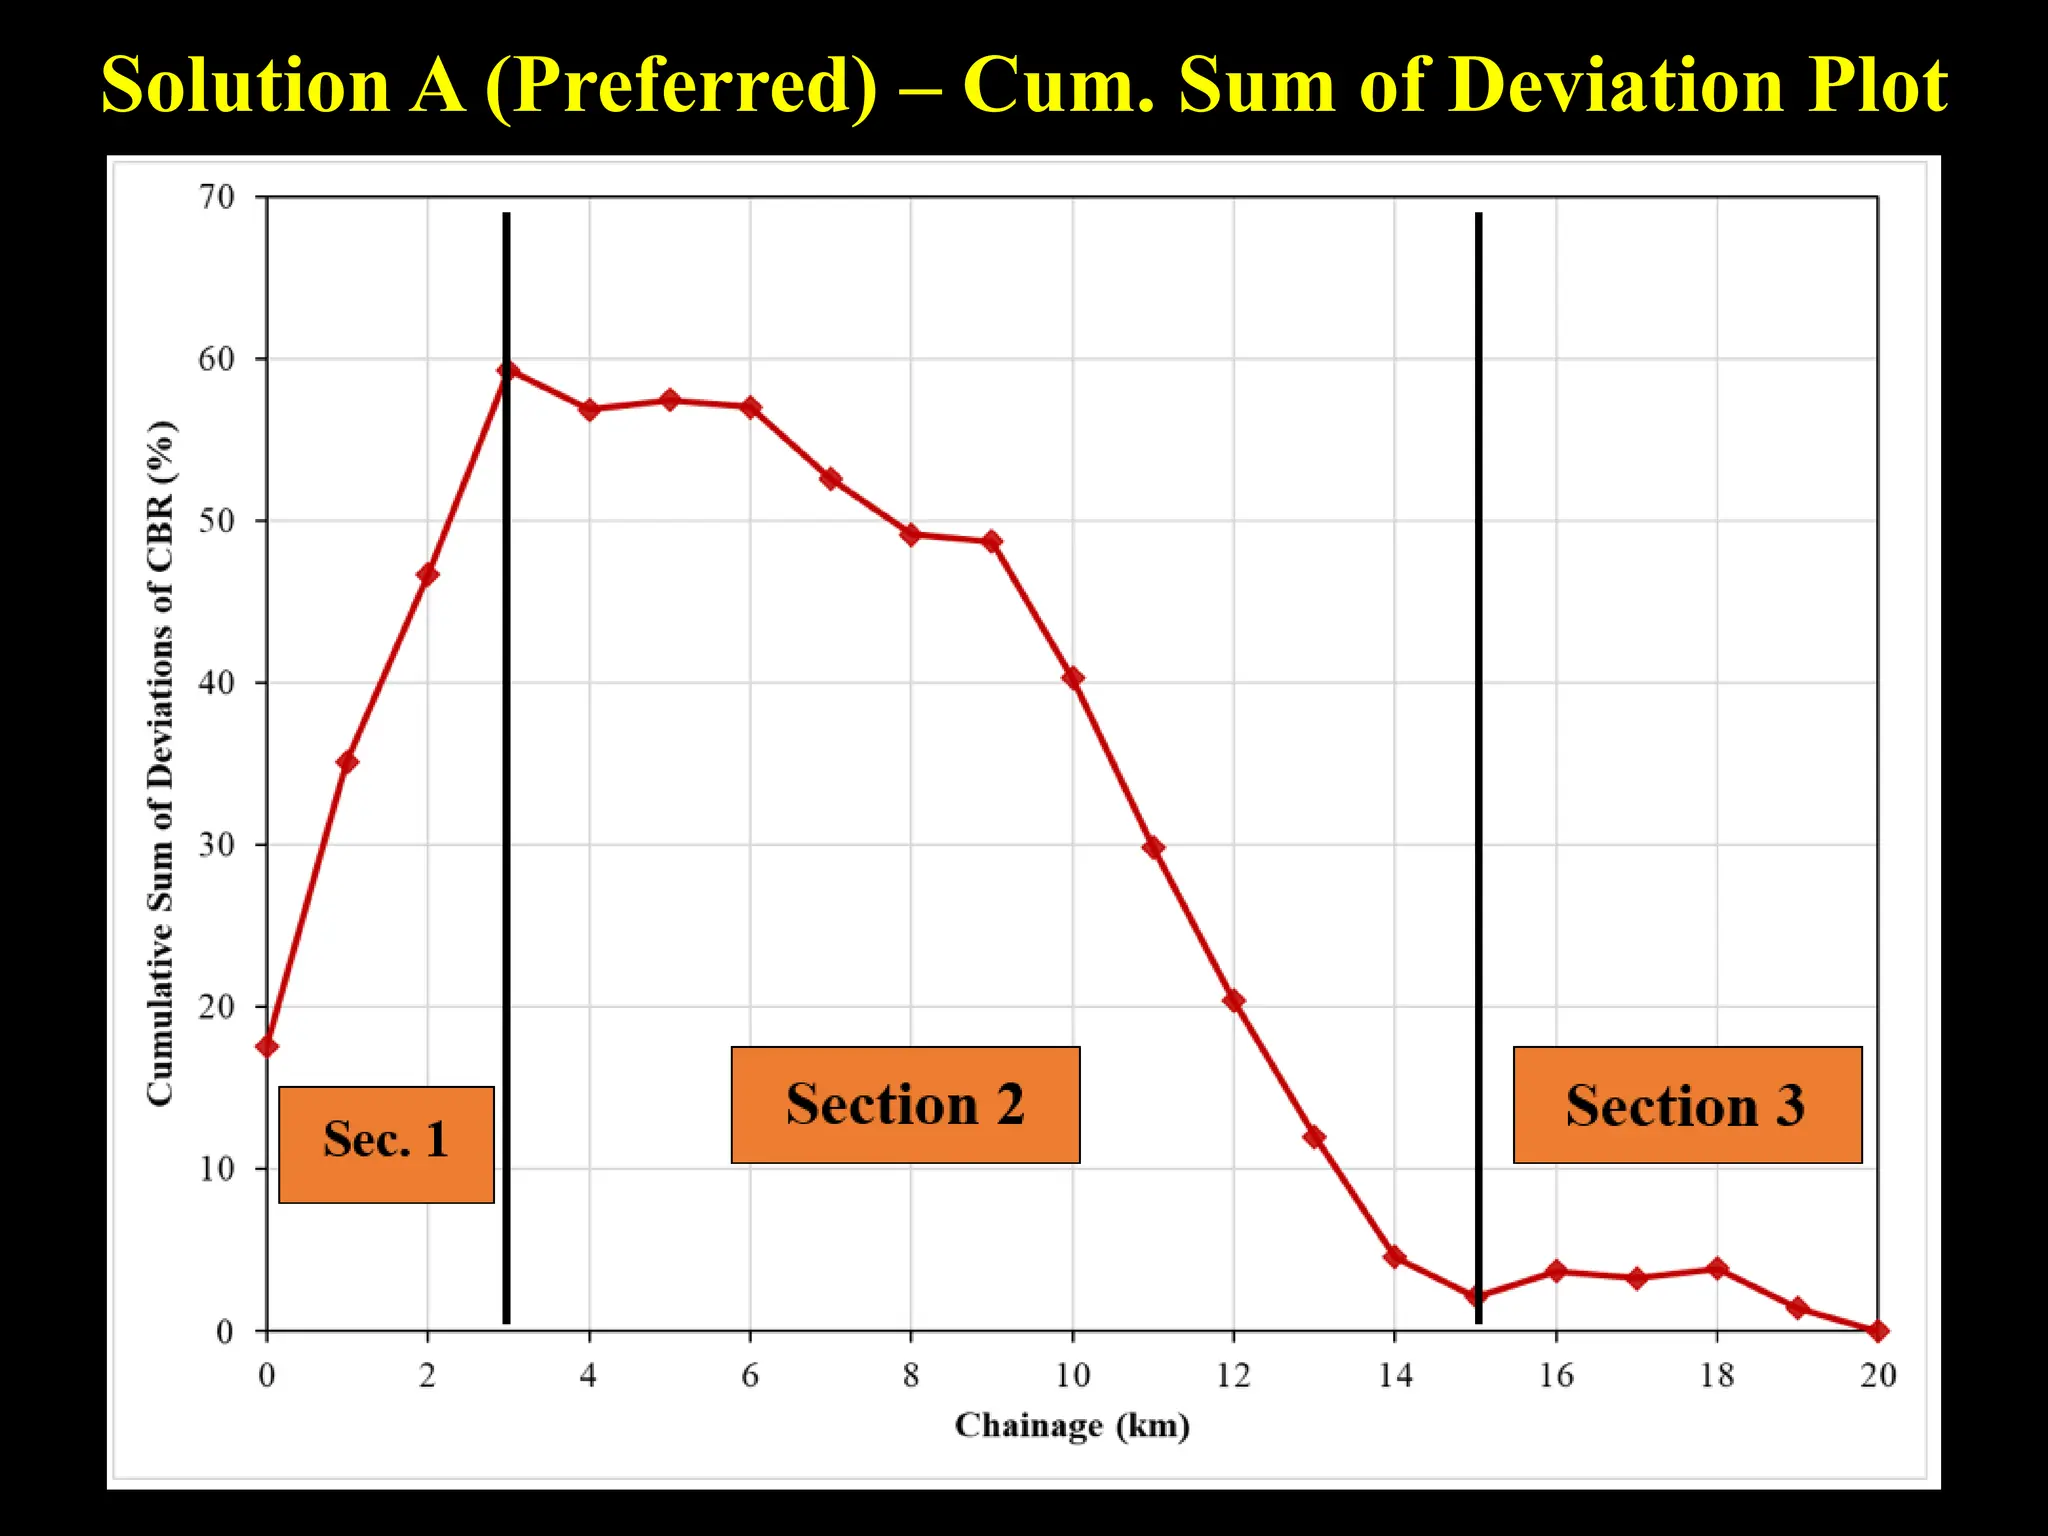
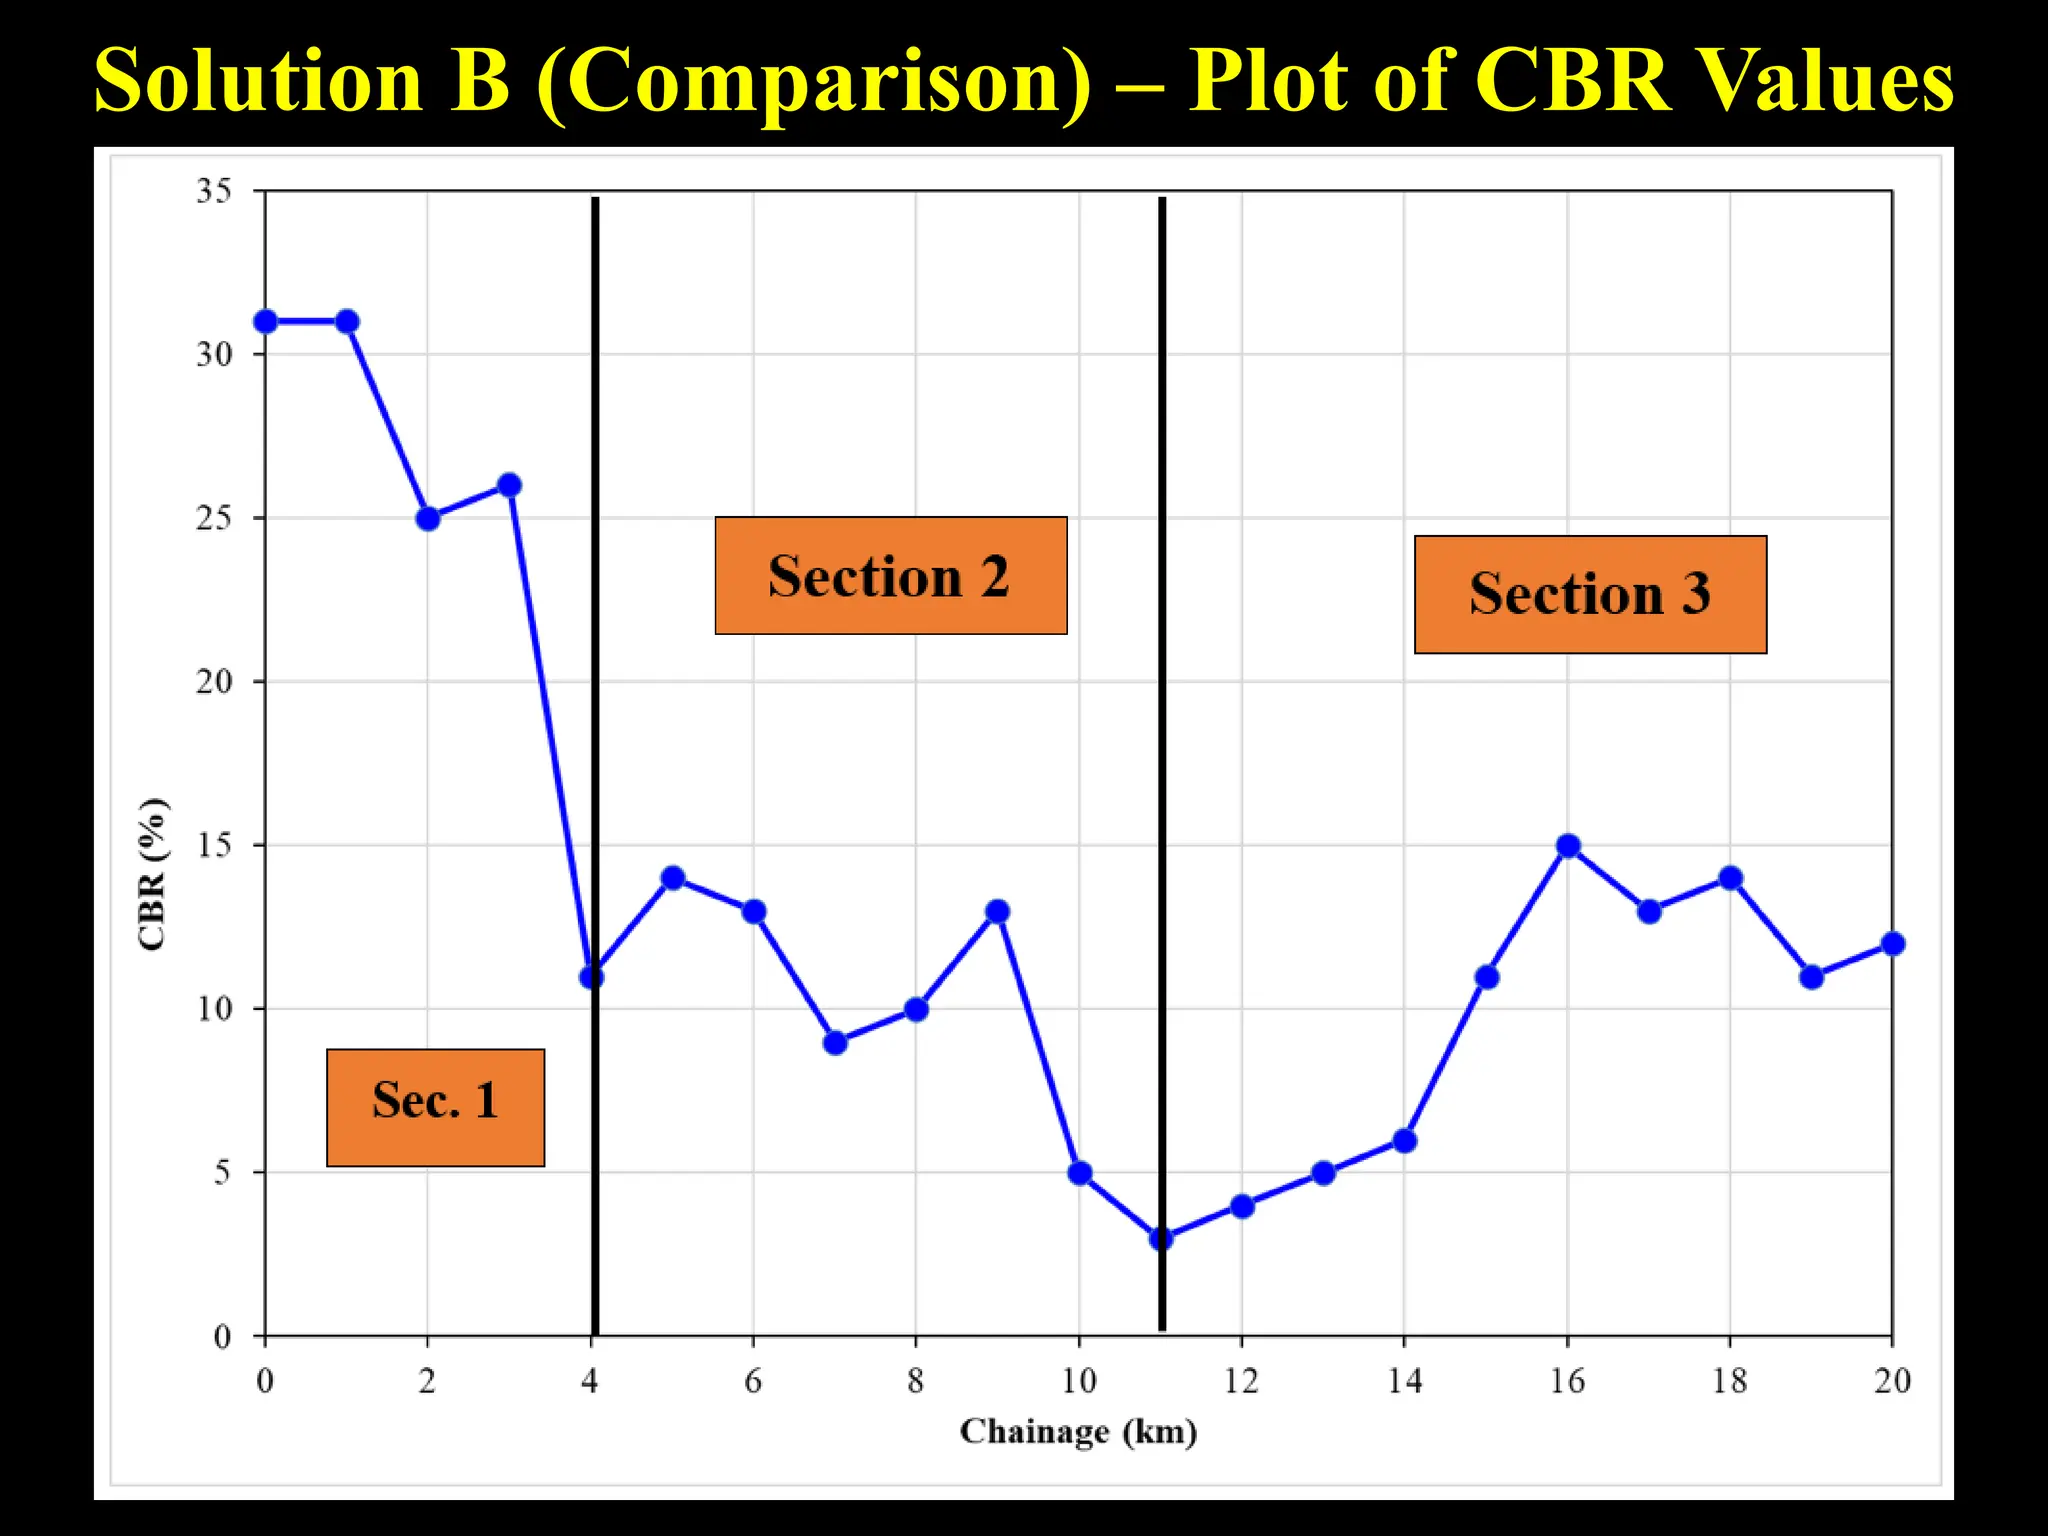
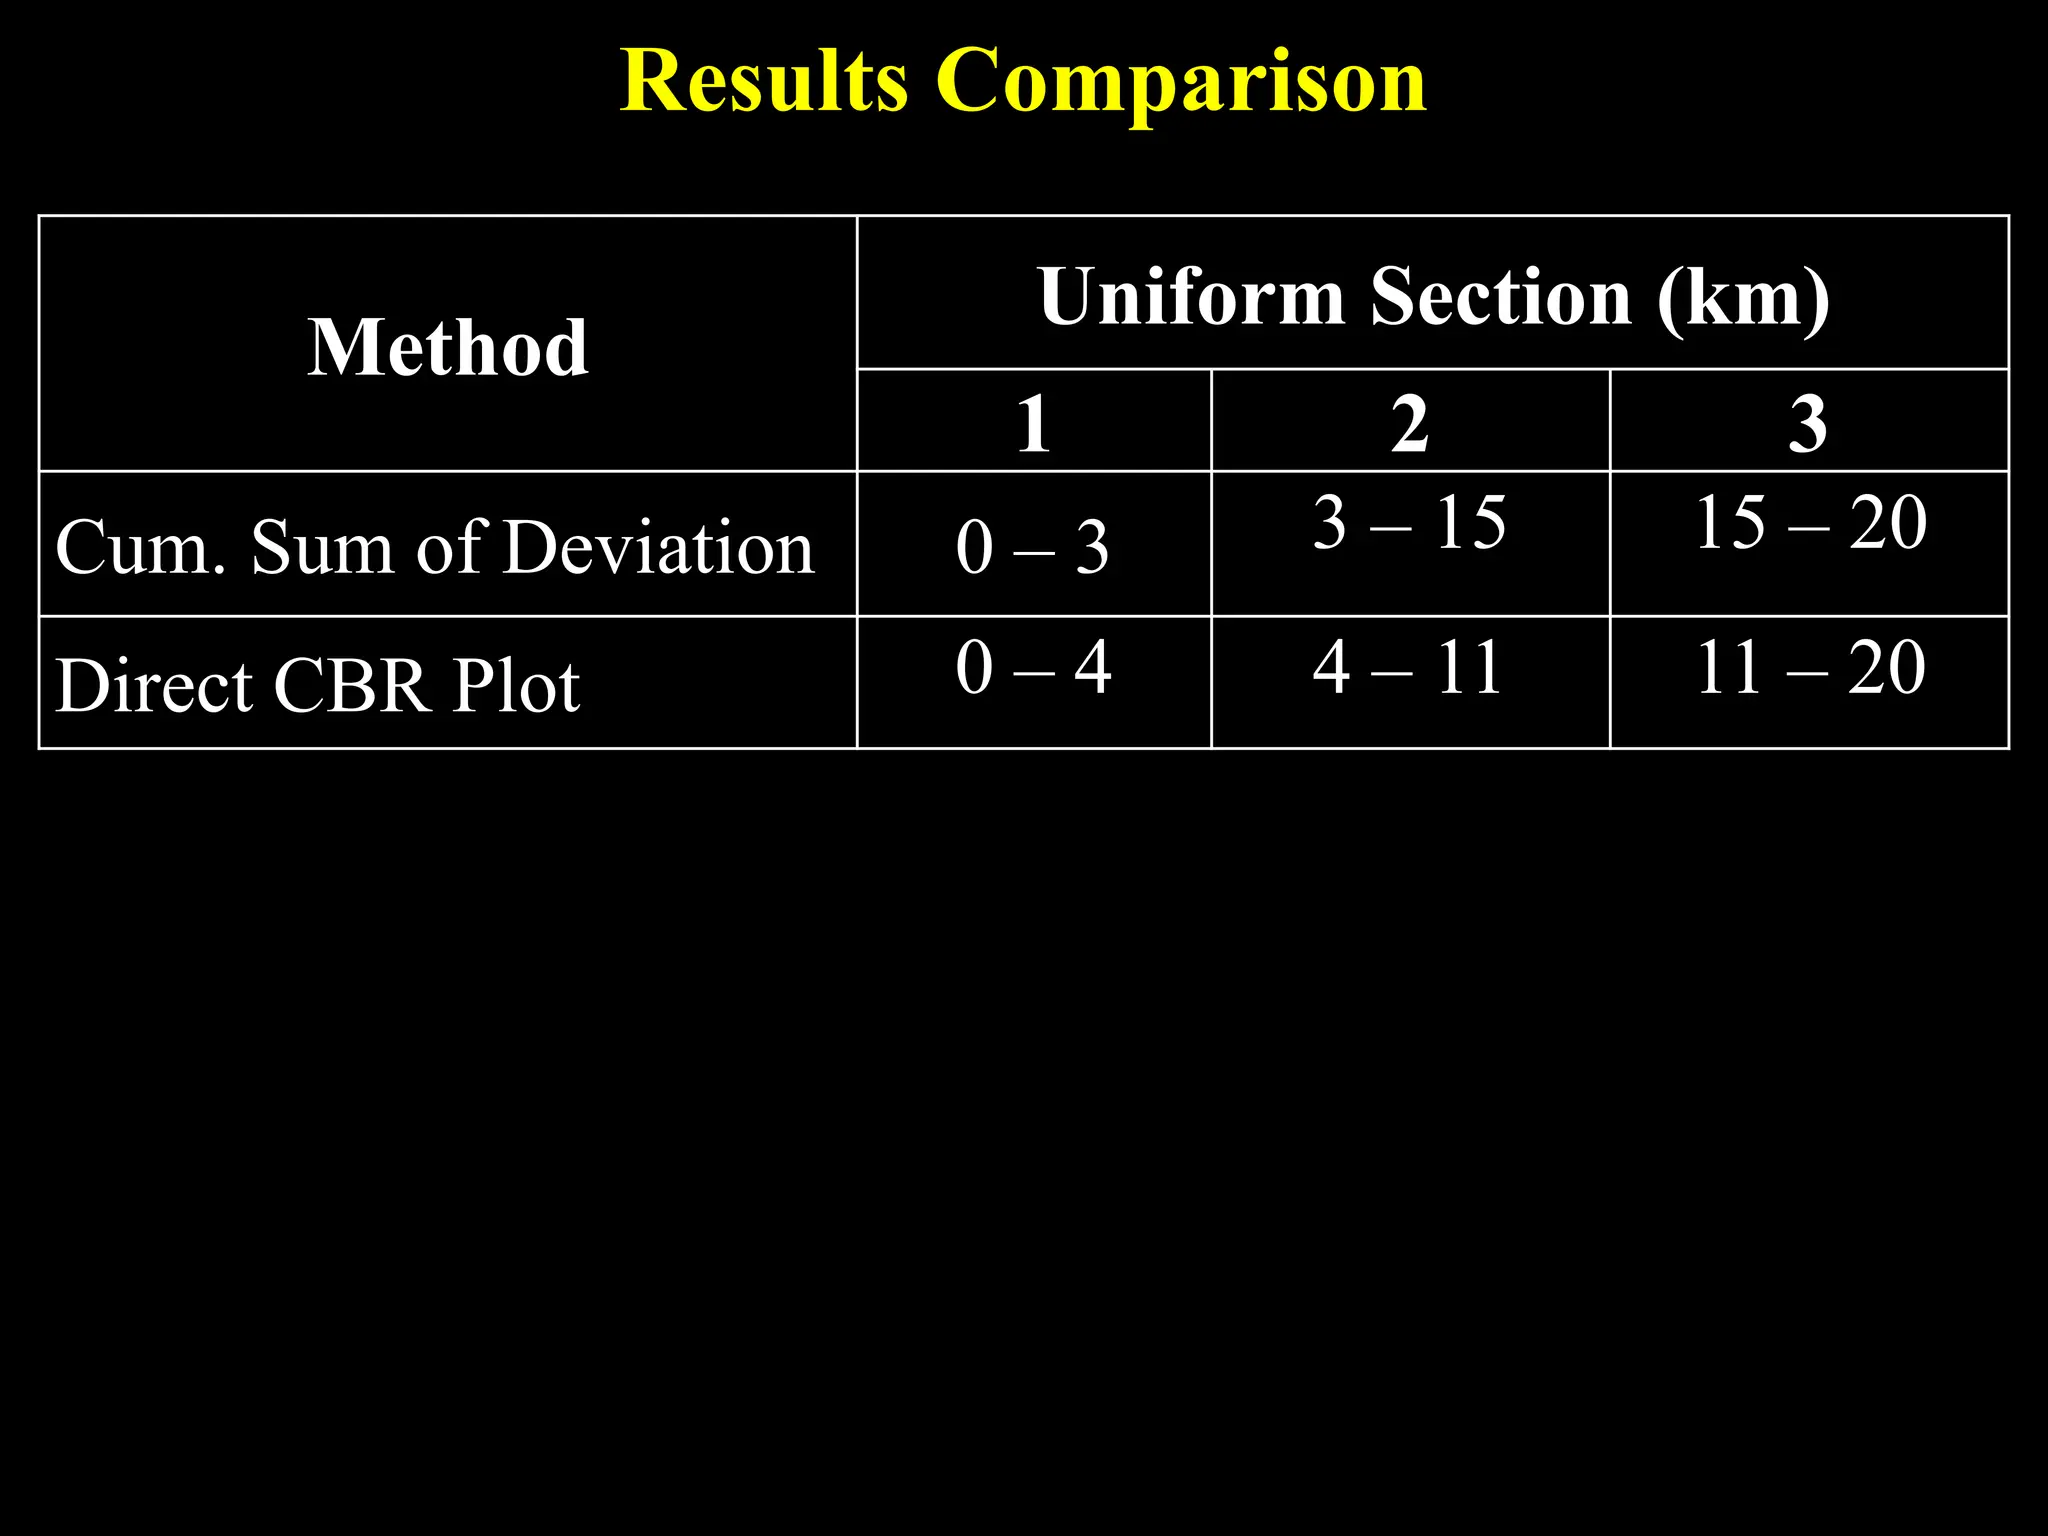
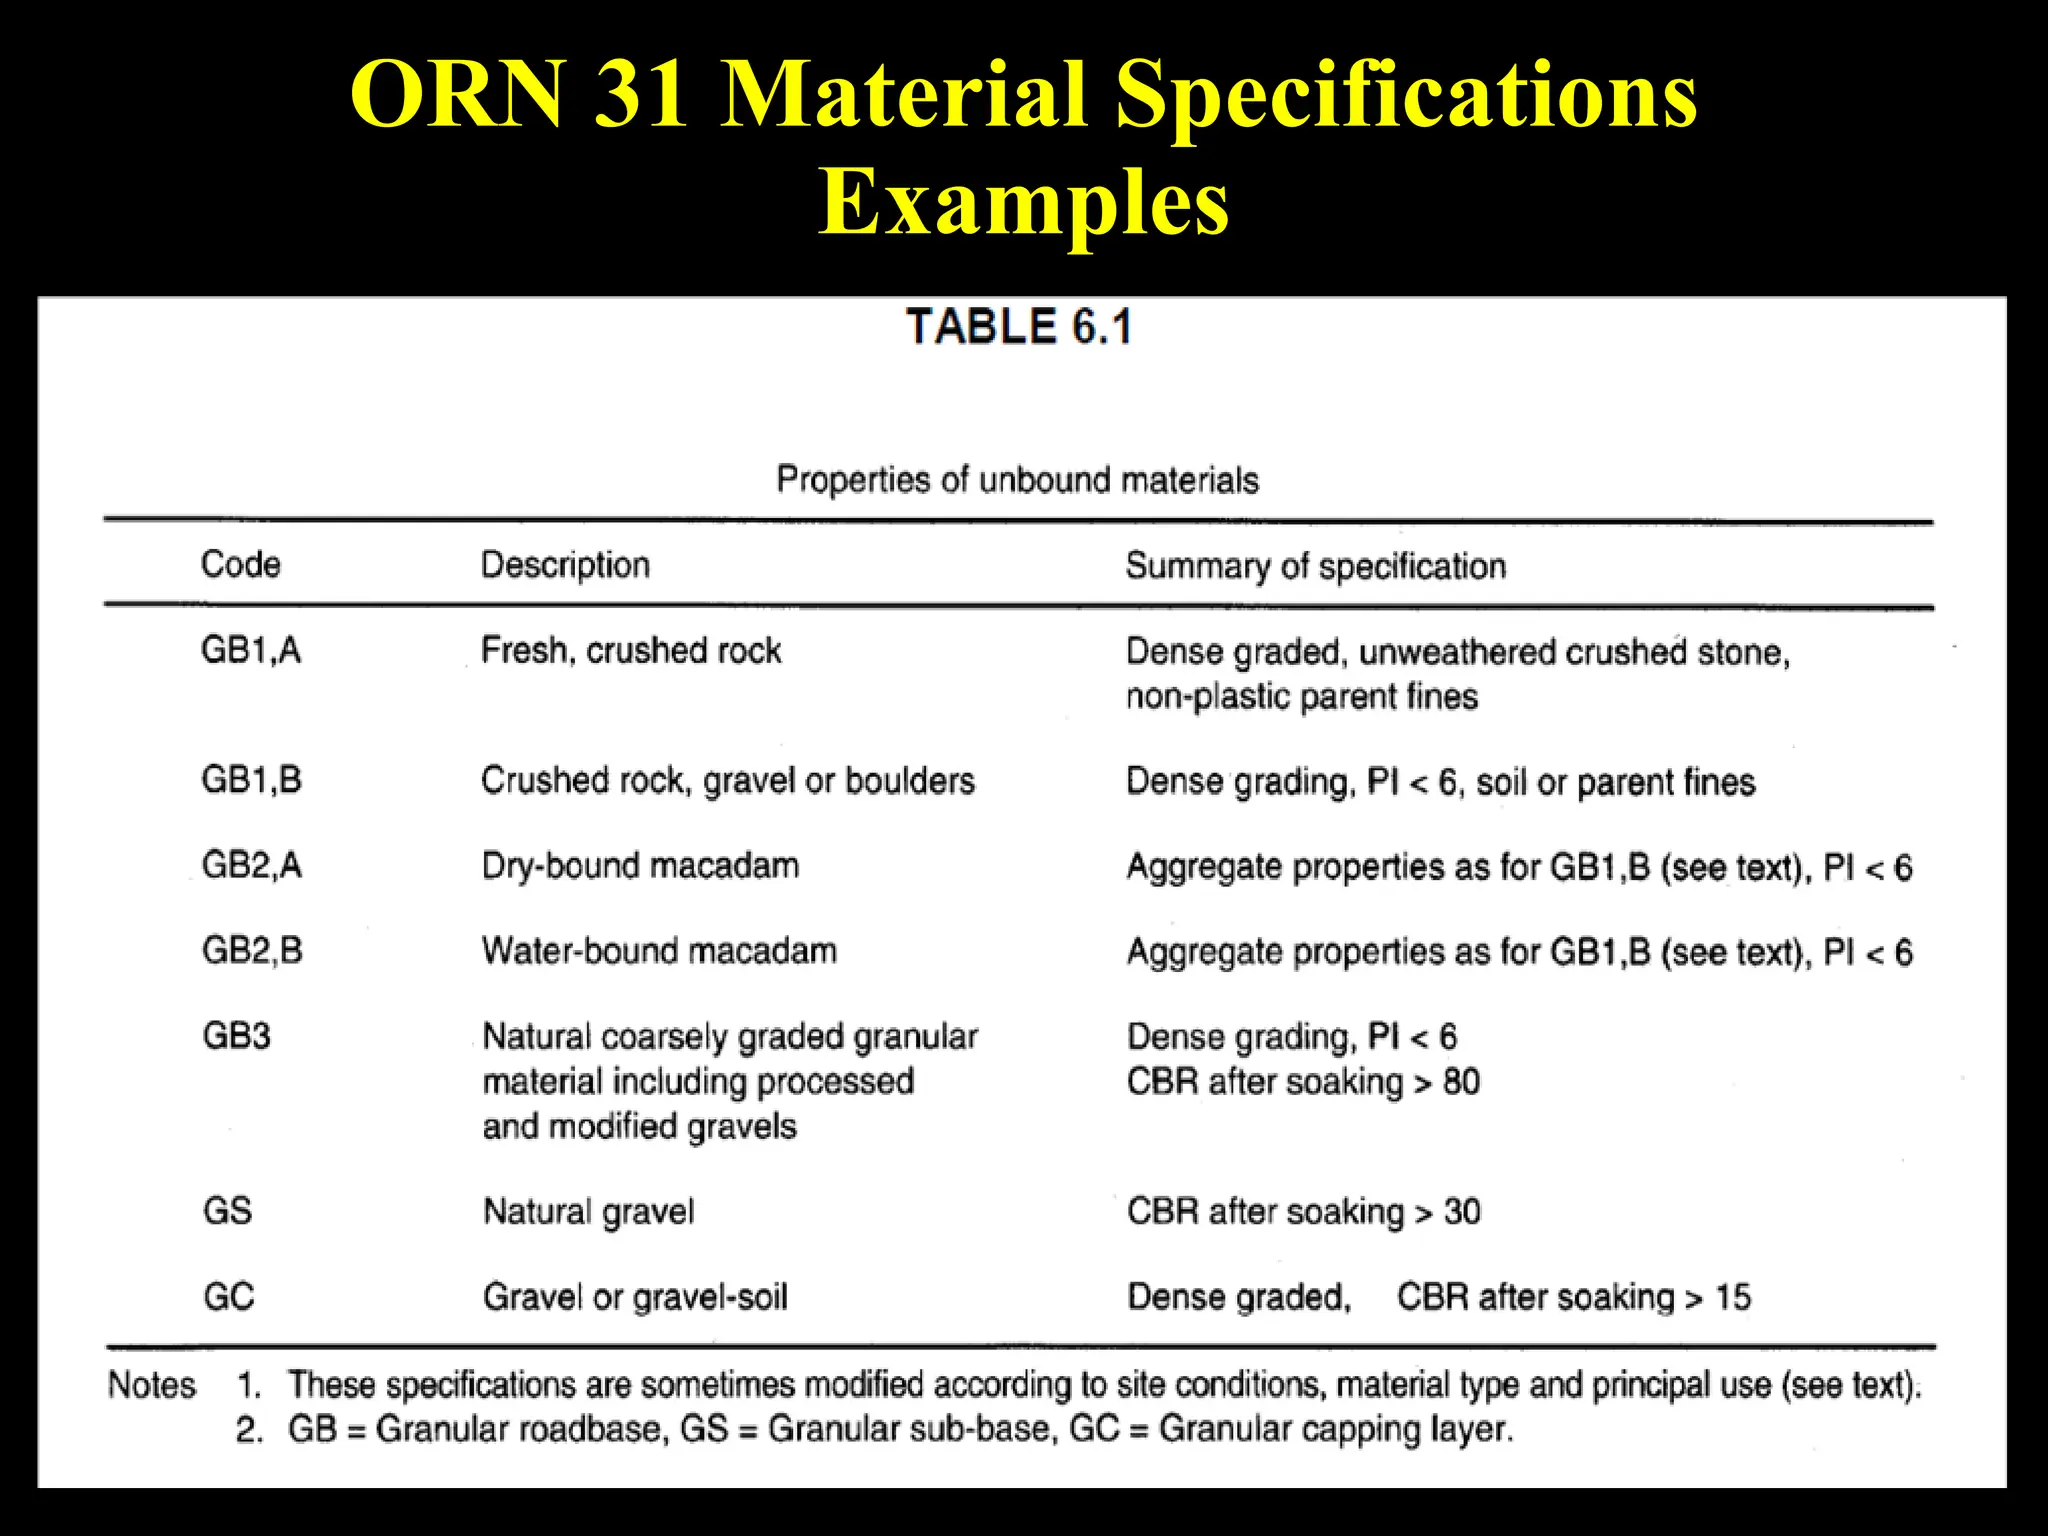
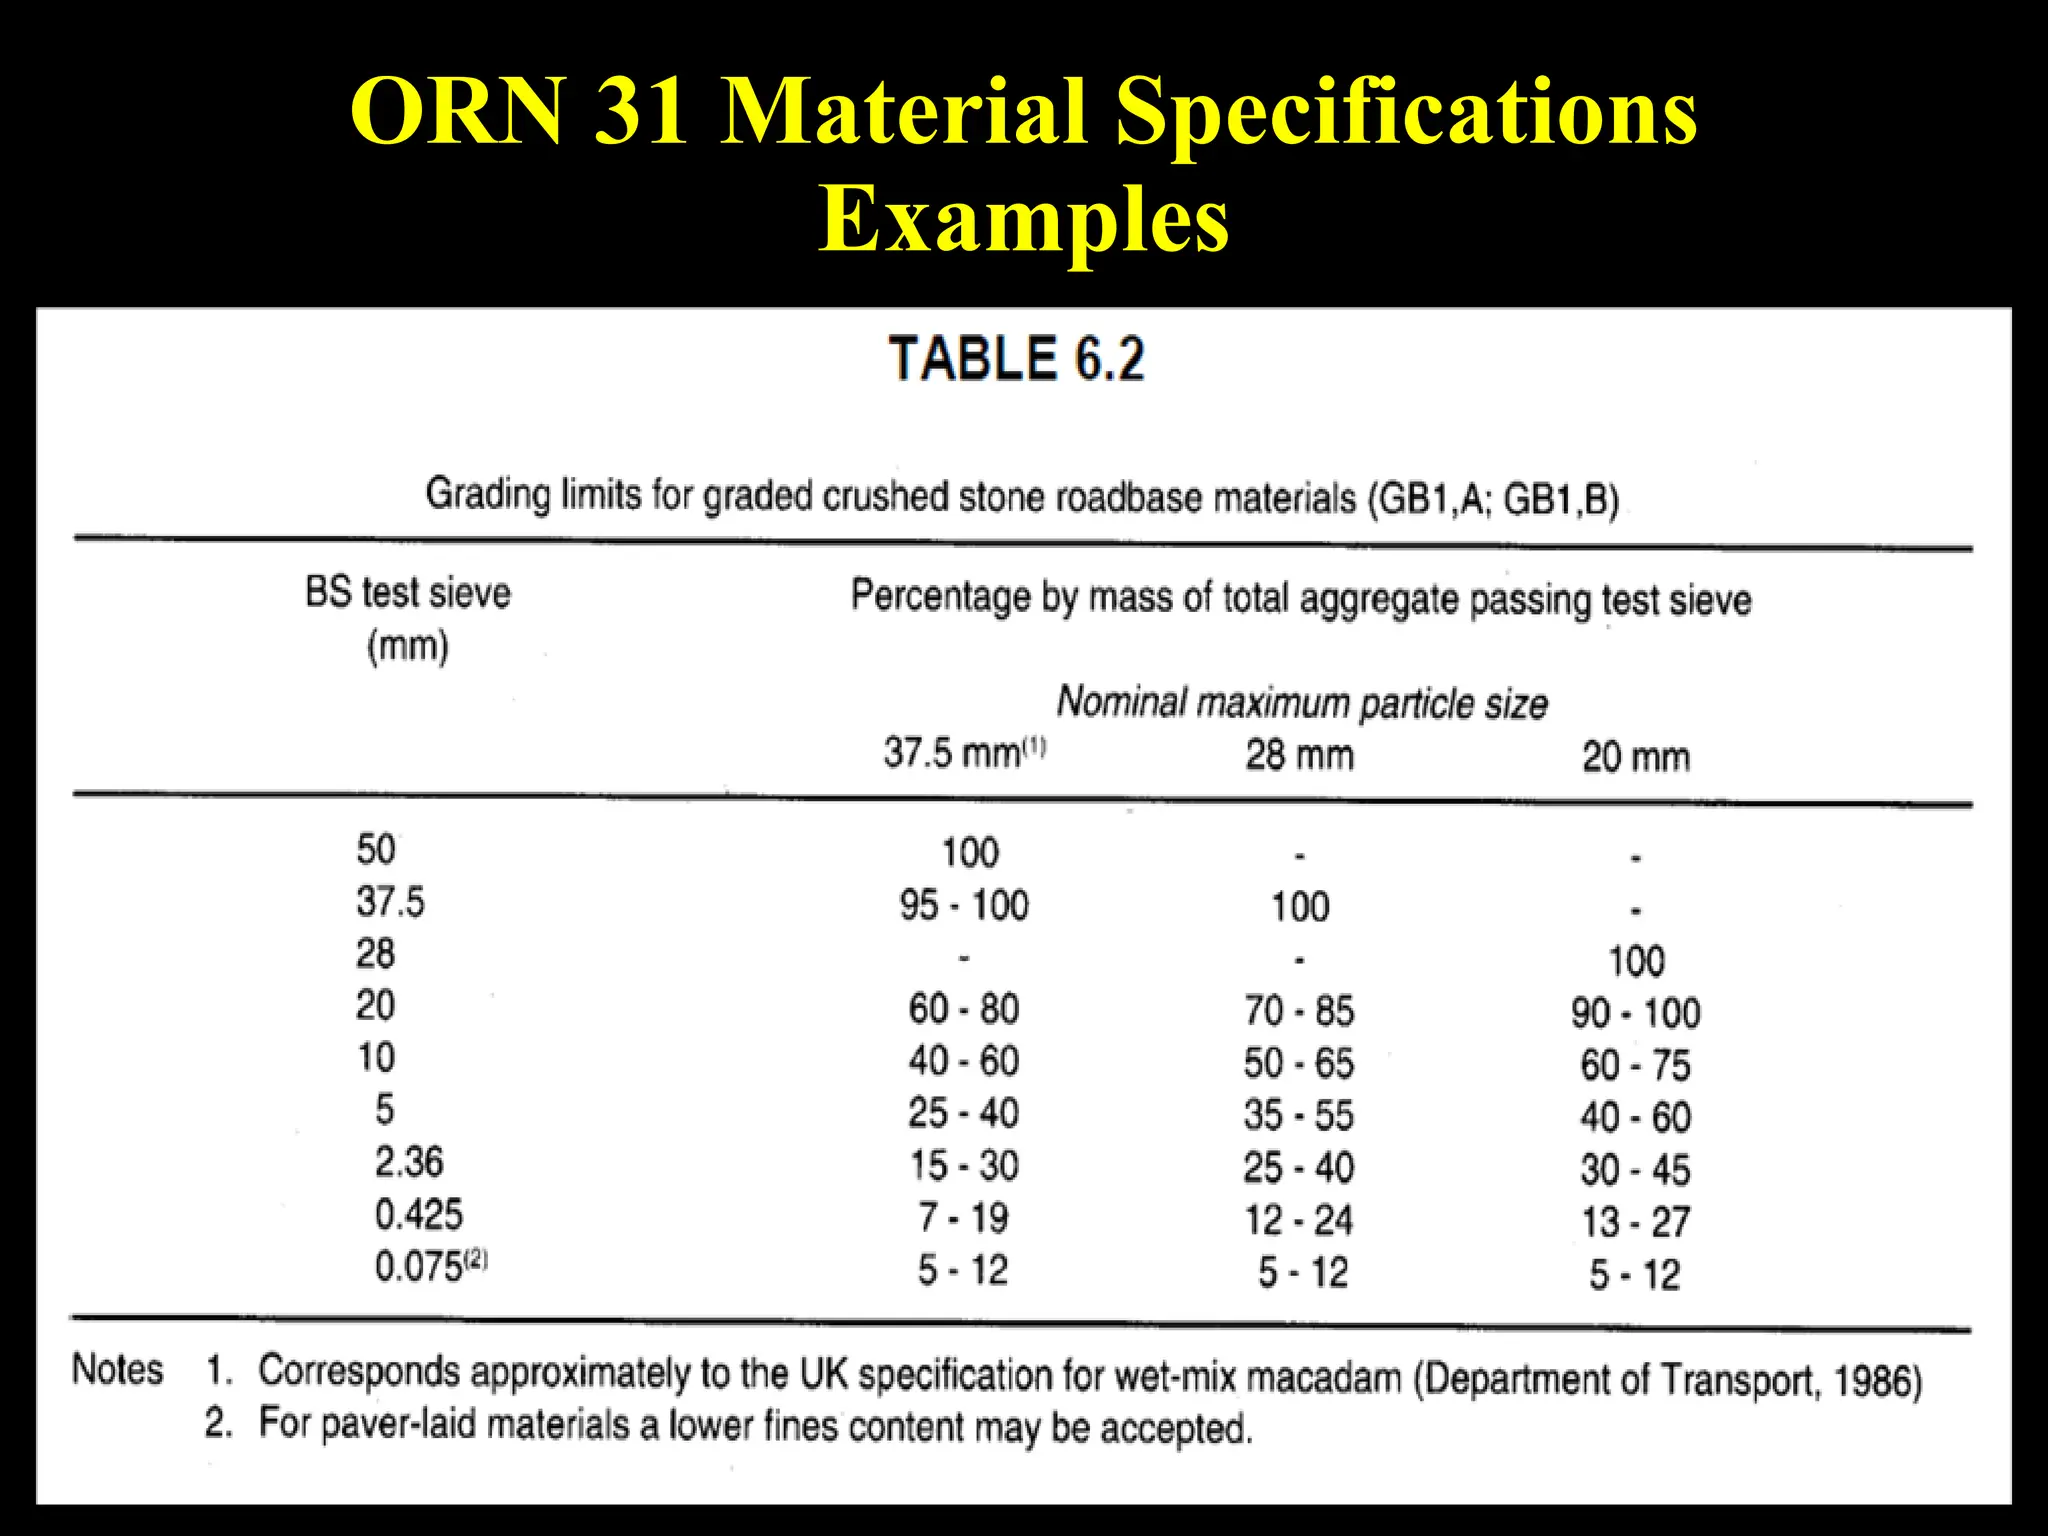
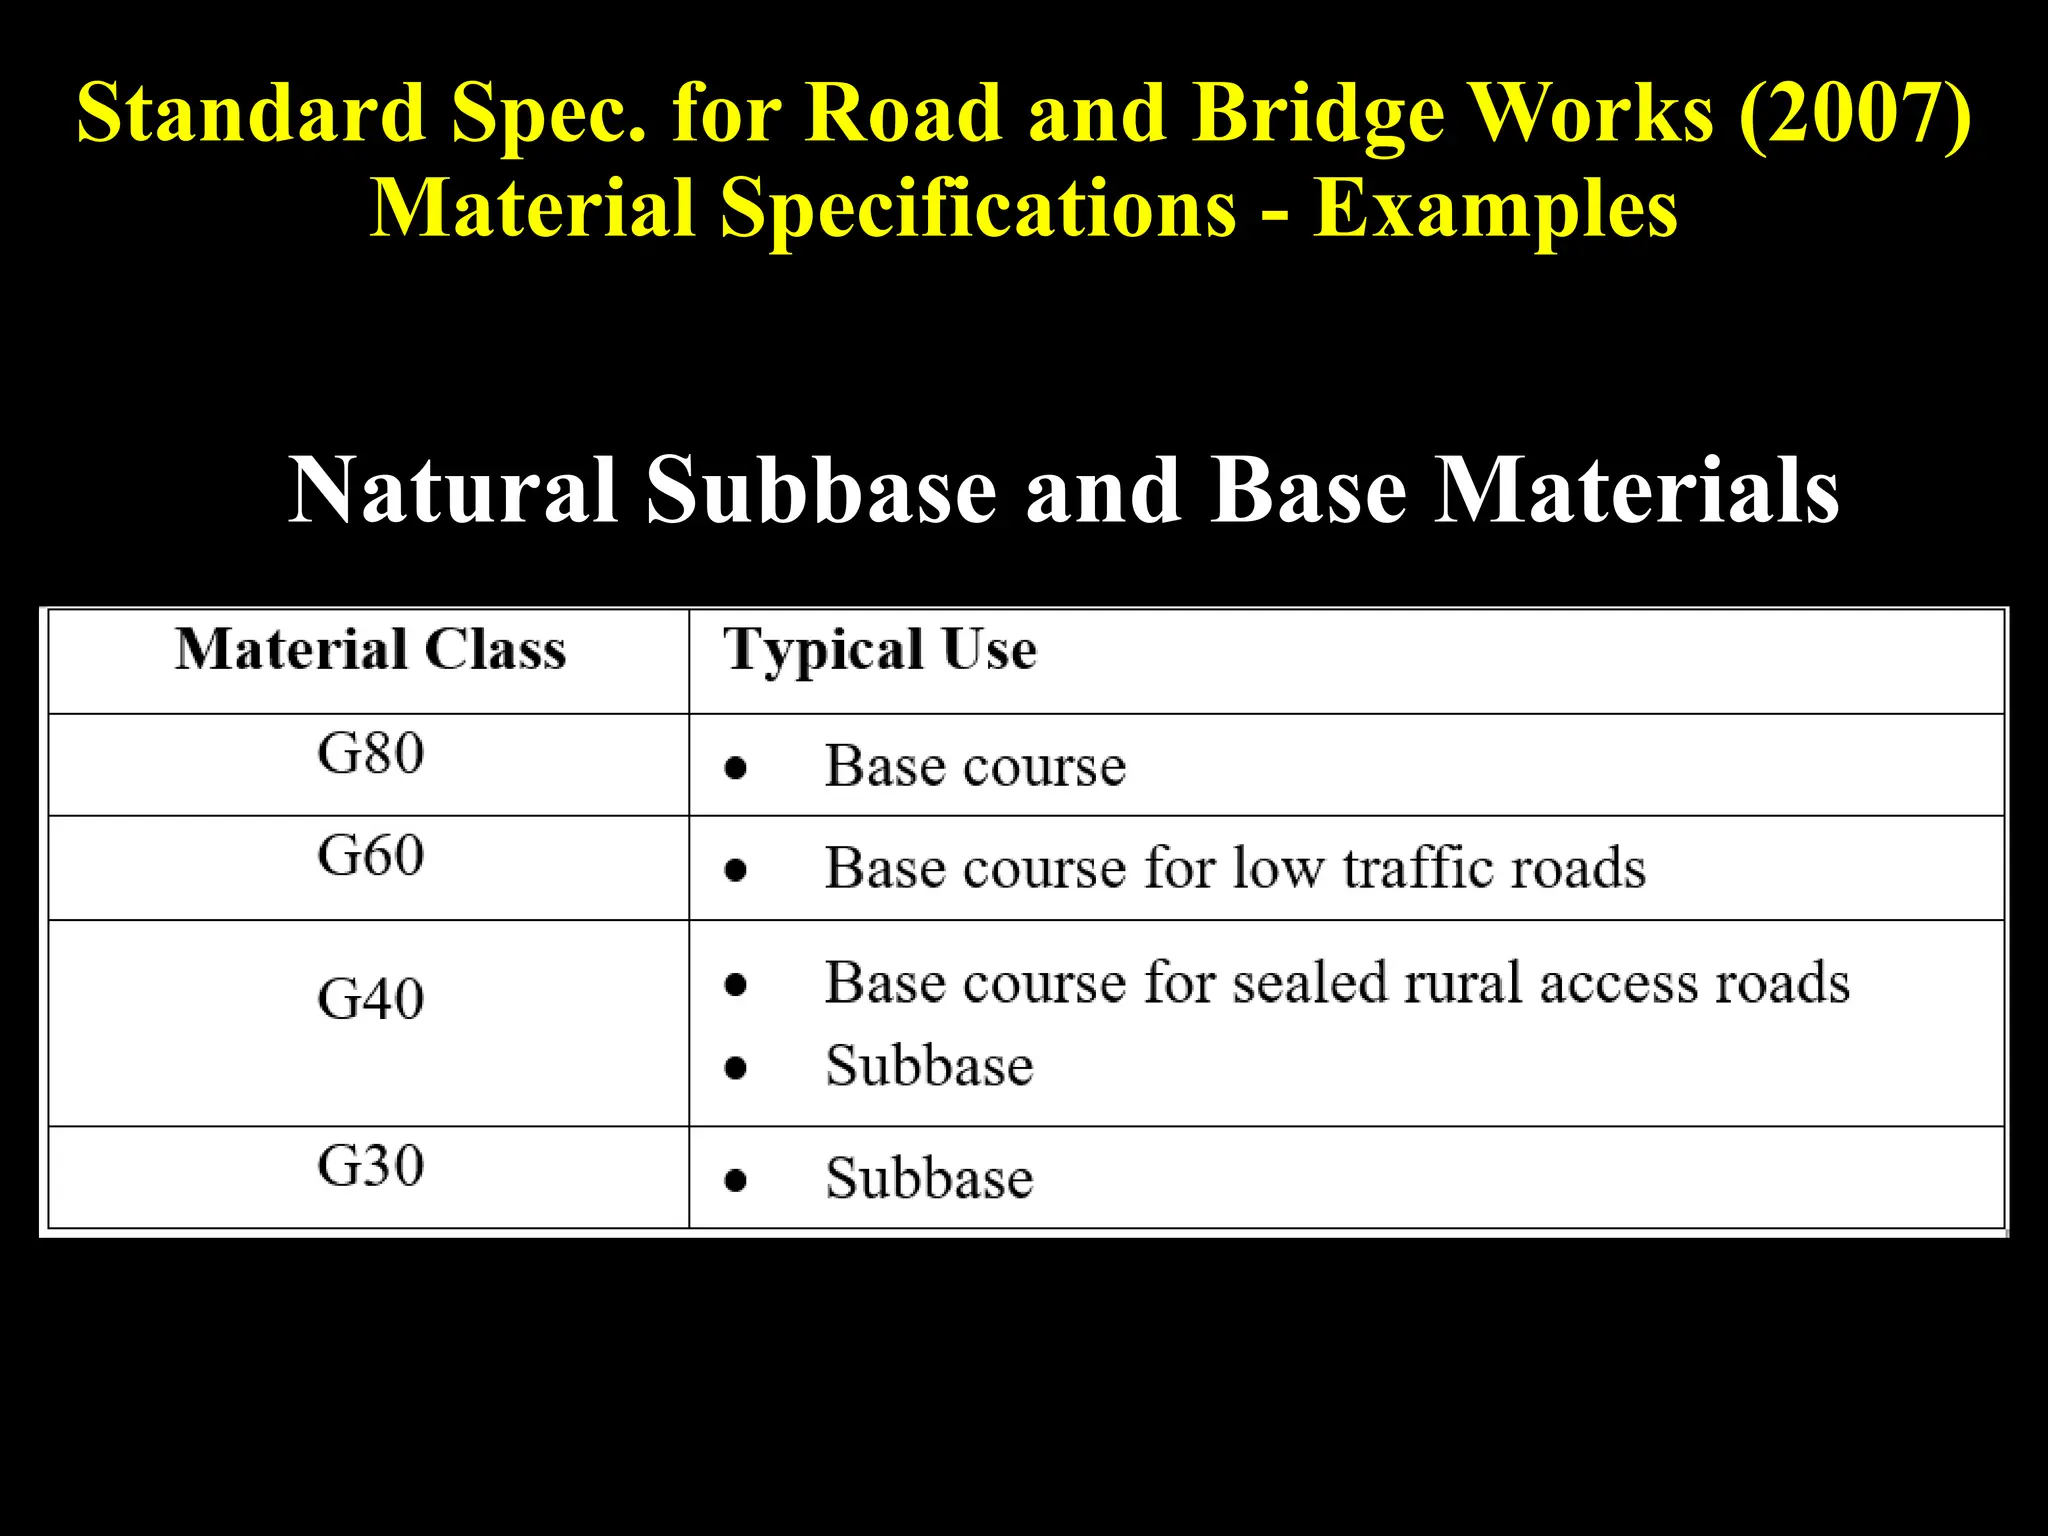
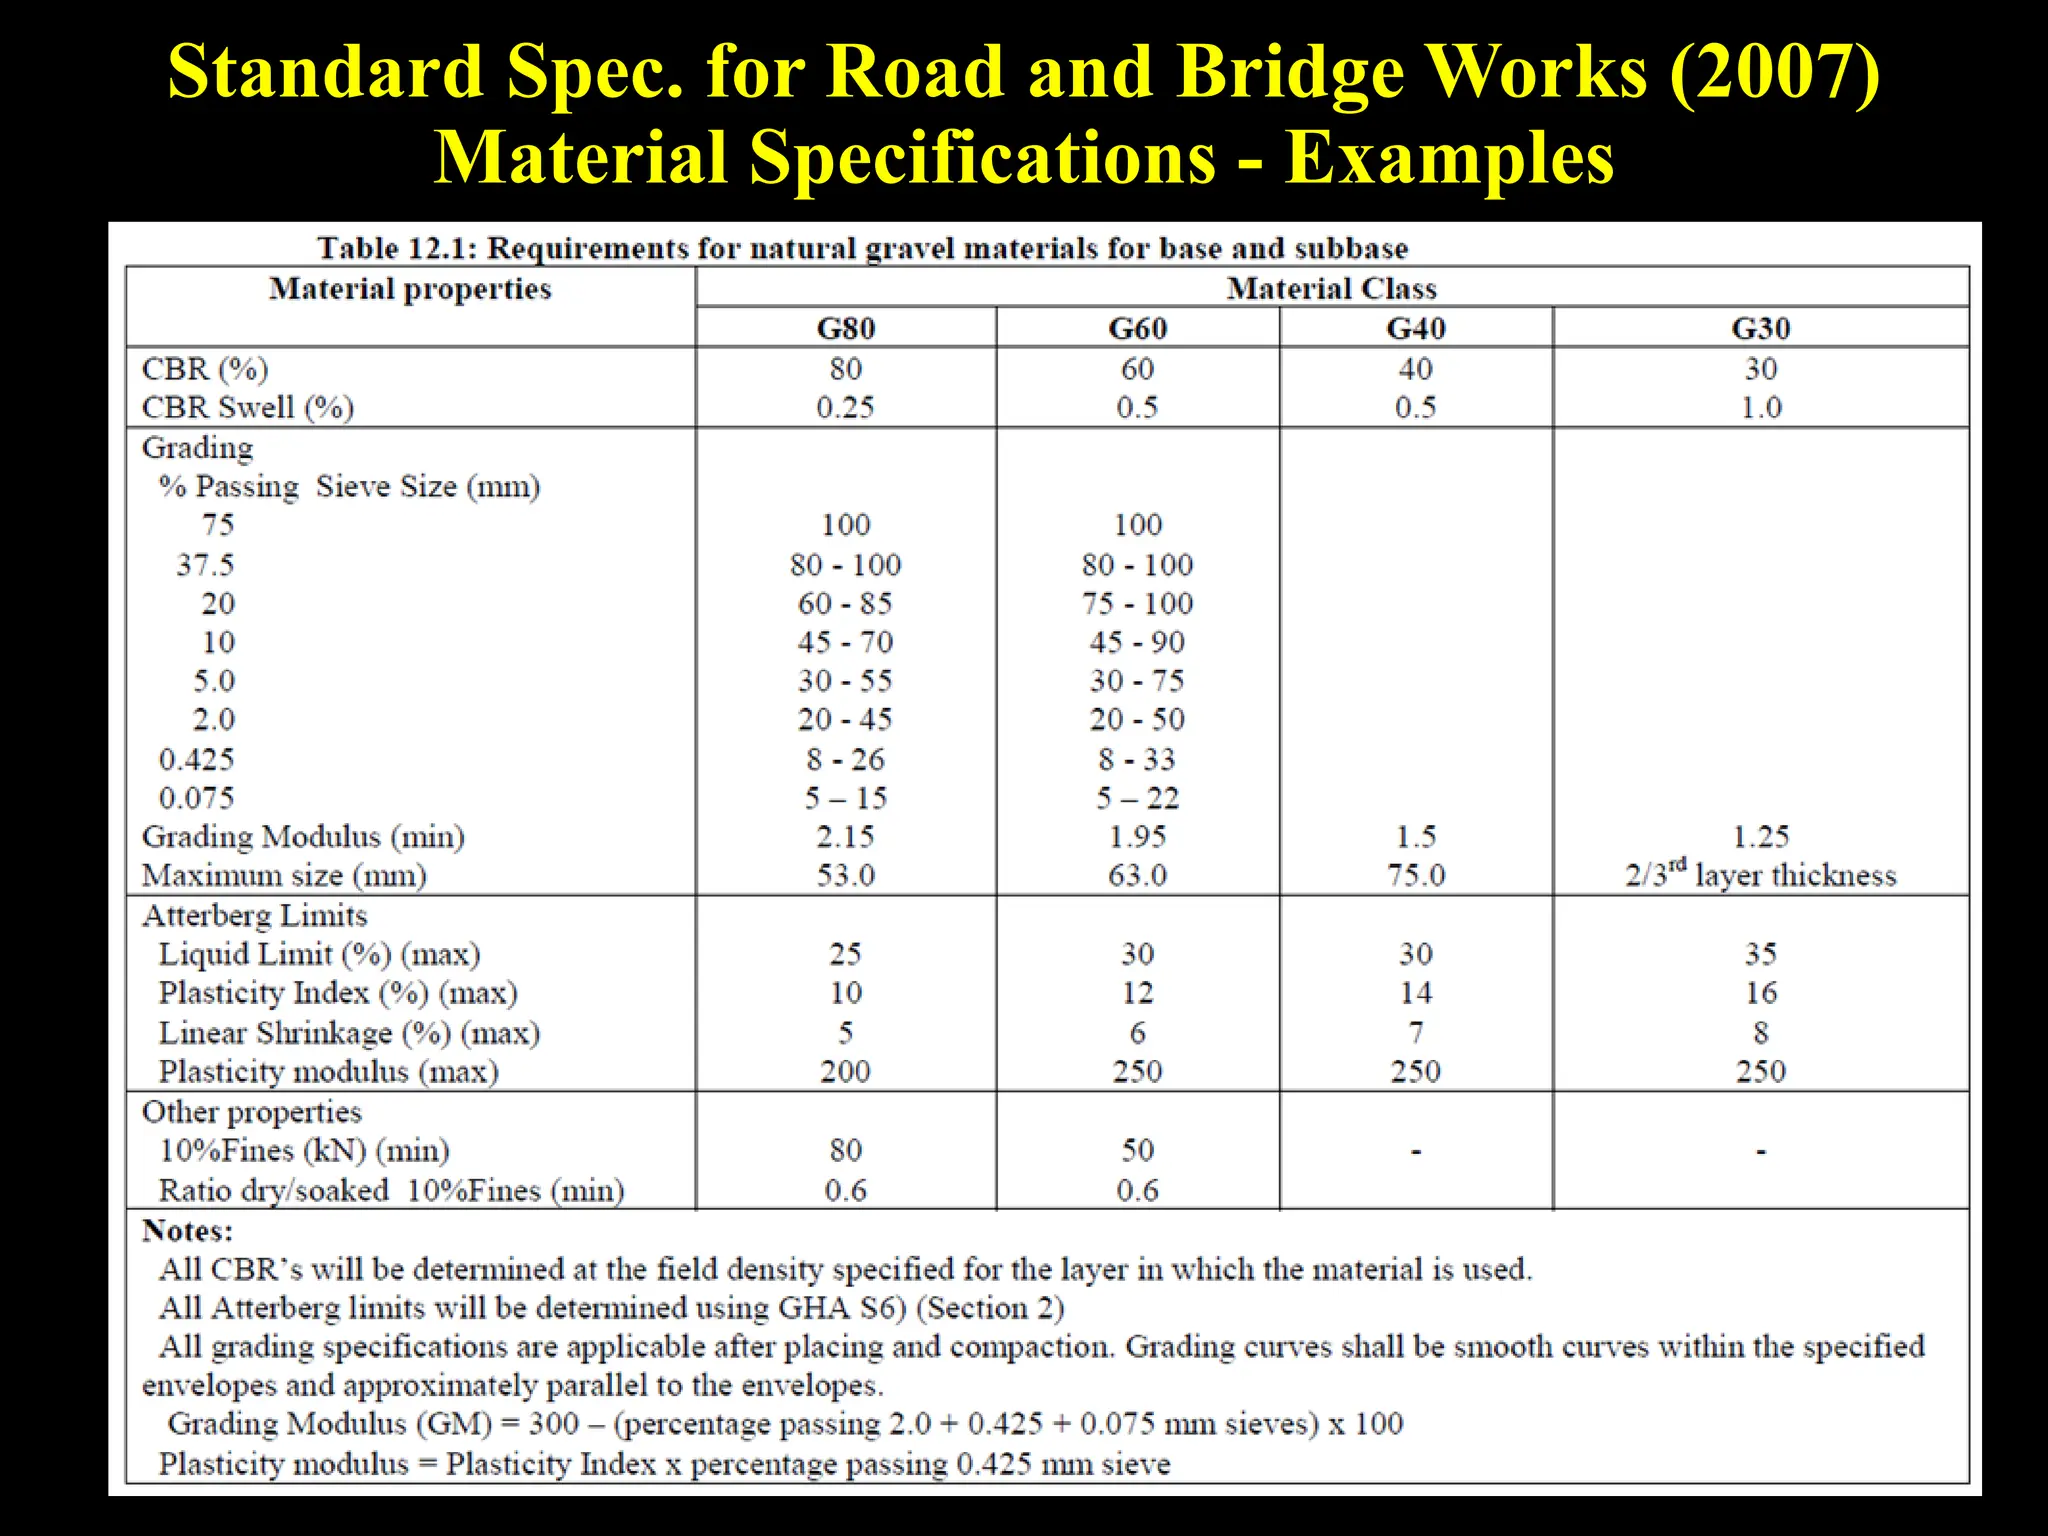
CE 368
Highway Engineering
Lectures 7 to 8:
Flexible
Pavement Design
(TRL Method)
Dr. Kenneth A. Tutu
Types of Pavement Design Methods
Empirical Design Mechanistic-Empirical Design
• Based on observed pavement performance
from road experiments or local experience
• Little or no application of mechanic theory
• Mechanistic: pavement stresses, strains,
deflections due to traffic load are calculated
• Empirical: Stress/strains are used to predict
pavement distresses
• Valid for traffic, material and
environmental conditions under which
method was developed
• Adaptable to new design conditions (traffic,
materials and environment)
• No specific distresses are predicted
• E.g., AASHTO uses terminal serviceability
index to describe overall pavement
condition at end of design period
• Specific distresses are predicted
• E.g., Fatigue cracking in 20% of wheelpath
area; 25mm maximum rut depth
• Procedure is relatively easy to use
• Design inputs are relatively easy to obtain
• Detailed data requirements
• Distress models are costly to develop
• Less design reliability • Better design reliability due to more reliable
pavement performance prediction
• Basic material characterization • Advanced material characterization
• Better utilization of available materials
• Examples:
• 1993 AASHTO Method
• TRL Overseas Road Note 31
• Examples:
• AASHTOWare Pavement ME Design (MEPDG)
• Asphalt Institute Method
Pavement Design Methods
Transport Research Laboratory (TRL)
Pavement Design Method
(Overseas Road Note 31, 4th Edition, 1993)
 Overseas Road Note 31 (ORN 31) provides structural
design of bituminous surfaced roads for the tropics
 Accounts for variability in design inputs and effects
of climate
 Based on results of road experiments and
performance of in-service roads (empirical method)
 Local experience and judgement must be applied
ORN 31 Design Process
EALF = ?
STEP 4 Provide Material Specifications
STEP 3 Select Pavement Structure
STEP 2 Determine Subgrade Strength
STEP 1 Calculate Design ESALs
Design ESALs  Eight ESALs
categories
 30 million
ESALs or less
 If ESALs > 30
million, use
another method
ORN 31 Design Process
EALF = ?
STEP 4 Provide Material Specifications
STEP 3 Select Pavement Structure
STEP 2 Determine Subgrade Strength
STEP 1 Calculate Design ESALs
Subgrade
Strength
ORN 31
Subgrade
strength is
characterized
by CBR
Design CBR Estimation
Subgrade strength is that of the soil in its wettest
condition
Collect subgrade soil samples at appropriate intervals
and depths
At sections with significant fill, top of subgrade
comprises borrow material. Evaluate borrow material
In cut sections, top of subgrade comprises native soil
Perform CBR testing, after soaking specimens for 4
days
CBR can be obtained through correlation with DCP
test results
Design CBR Estimation
CBR values often vary along project road
If avg. CBR is used, about one half of pavement
is over-designed; other half is under-designed
If min. CBR is used, most of road is over-
designed.
Over-design is costly; under-design causes
premature failure
 Develop a cumulative percentile plot of CBR
and select the tenth percentile as design CBR
This value is exceeded by 90% of the available
CBR values
Design CBR Estimation
If subgrade characteristics change significantly over
long sections, determine different design CBR for
relatively uniform sections
For design CBR of less than 2, subgrade soil
treatment is necessary
Design CBR Estimation - Example
Results of 20 tests produced the following subgrade
CBR values: 45, 43, 40, 38, 36, 32, 28, 22, 10, 48, 50,
52, 55, 58, 64, 70, 75, 17, 32 and 5.
Determine the design CBR.
Solution (Method 1) – Cumulative Percentile Plot
1. Use Excel’s percentrank function to compute
cumulative percentile of each CBR value
2. Plot cumulative percentile versus CBR
3. Read CBR at 10th percentile to obtain design CBR
Solution (Method 1) – Cumulative Percentile Plot
Solution (Method 2) – Percentile Plot
1. Arrange CBR in ascending (or descending) order
2. Find number of CBR that is equal to or greater than
a given CBR
3. Compute percent of total number of CBR that is
equal to or greater than (percentile)
4. Plot percentile on y-axis versus CBR on x-axis and
draw a best-fit curve
5. Read off CBR at the 90th percentile to as design
CBR
Solution (Method 2) – Percentile Plot
Identifying Uniform Subgrade Sections
Better characterizes subgrade for cost-effective
pavement design and rehabilitation
Direct plots of soil data (e.g., CBR vs distance)
may help to identify uniform sections, but such
assessments may be highly subjective
Cumulative sum of deviation identifies uniform
subgrade sections more clearly
Cumulative Sum of Deviation
𝐂𝐂𝐂𝐂𝐂𝐂𝐂𝐂𝐂𝐂 = �
𝐢𝐢=𝟏𝟏
𝐧𝐧
𝐱𝐱𝐢𝐢 − �
𝐱𝐱
Where:
CUSUM = cumulative sum of deviations
xi = data measured at point x
�
x = mean of measured data
 Plot cumulative sum of deviations vs chainage
 Major changes in slope indicate changes in soil
properties
Cumulative Sum of Deviation
 Length of uniform sections must be practical for
pavement design and construction.
 Determine design CBR and pavement design for
each uniform section, if it is practical to do so.
Alternatively, subgrade improvement can be
done to allow for one design solution.
 Cumulative sum of deviation applies to other
pavement data (e.g., FWD)
 Delineation of uniform sections is not exact
science, and some variations can be expected.
Illustrative Example
Subgrade soil samples were collected
at a 1.0-km interval from a project road
and tested for CBR. Based on the test
results in the table, delineate the road
into nominal uniform sections.
Solution A (Preferred) – Cumulative Sum of Deviation
(a) Find the mean CBR
(b)Subtract the mean CBR
from each CBR
(c) Cumulatively sum the
deviations from the mean
CBR
(d)Plot cumulative sum of
deviations vs. chainage
(e) Determine major changes
in slope
Solution A (Preferred) – Cum. Sum of Deviation Plot
Solution B (Comparison) – Plot of CBR Values
Results Comparison
Method
Uniform Section (km)
1 2 3
Cum. Sum of Deviation 0 – 3 3 – 15 15 – 20
Direct CBR Plot 0 – 4 4 – 11 11 – 20
ORN 31 Design Process
EALF = ?
STEP 4 Provide Material Specifications
STEP 3 Select Pavement Structure
STEP 2 Determine Subgrade Strength
STEP 1 Calculate Design ESALs
Select Pavement Structure
 Use design CBR and ESALs to select a
pavement structure from TRL design charts
 Pay attention to notes beneath the design charts
 ORN 31 pavement thickness recommendations
are minimum requirements
 Compare ORN 31 thickness recommendations
with GHA Pavement Design Manual (1998)
ORN 31 Design Chart - Example
Minimum Thickness Recommendations
(GHA Pavement Design Manual, 1998)
ORN 31 Design Process
EALF = ?
STEP 4 Provide Material Specifications
STEP 3 Select Pavement Structure
STEP 2 Determine Subgrade Strength
STEP 1 Calculate Design ESALs
Material Specifications
 ORN 31 was not specifically developed for Ghana,
and so its material specifications may not fully
conform to our local specifications
 Compare ORN 31 material specifications with those
of Ghana. Examples:
 Standard Specification for Road and Bridge Works
(2007)
 Manual for Low Volume Roads: Part B – Materials,
Pavement Design and Construction, Ministry of
Roads and Highways, 2019 – online
ORN 31 Material Specifications
Examples
ORN 31 Material Specifications
Examples
Standard Spec. for Road and Bridge Works (2007)
Material Specifications - Examples
Natural Subbase and Base Materials
Standard Spec. for Road and Bridge Works (2007)
Material Specifications - Examples

05_Lectures_07-08_FlexiPaveDesignTRL_SLIDES.pdf

  • 1.
    CE 368 Highway Engineering Lectures7 to 8: Flexible Pavement Design (TRL Method) Dr. Kenneth A. Tutu
  • 2.
    Types of PavementDesign Methods Empirical Design Mechanistic-Empirical Design • Based on observed pavement performance from road experiments or local experience • Little or no application of mechanic theory • Mechanistic: pavement stresses, strains, deflections due to traffic load are calculated • Empirical: Stress/strains are used to predict pavement distresses • Valid for traffic, material and environmental conditions under which method was developed • Adaptable to new design conditions (traffic, materials and environment) • No specific distresses are predicted • E.g., AASHTO uses terminal serviceability index to describe overall pavement condition at end of design period • Specific distresses are predicted • E.g., Fatigue cracking in 20% of wheelpath area; 25mm maximum rut depth • Procedure is relatively easy to use • Design inputs are relatively easy to obtain • Detailed data requirements • Distress models are costly to develop • Less design reliability • Better design reliability due to more reliable pavement performance prediction • Basic material characterization • Advanced material characterization • Better utilization of available materials • Examples: • 1993 AASHTO Method • TRL Overseas Road Note 31 • Examples: • AASHTOWare Pavement ME Design (MEPDG) • Asphalt Institute Method
  • 3.
  • 4.
    Transport Research Laboratory(TRL) Pavement Design Method (Overseas Road Note 31, 4th Edition, 1993)  Overseas Road Note 31 (ORN 31) provides structural design of bituminous surfaced roads for the tropics  Accounts for variability in design inputs and effects of climate  Based on results of road experiments and performance of in-service roads (empirical method)  Local experience and judgement must be applied
  • 5.
    ORN 31 DesignProcess EALF = ? STEP 4 Provide Material Specifications STEP 3 Select Pavement Structure STEP 2 Determine Subgrade Strength STEP 1 Calculate Design ESALs
  • 6.
    Design ESALs Eight ESALs categories  30 million ESALs or less  If ESALs > 30 million, use another method
  • 7.
    ORN 31 DesignProcess EALF = ? STEP 4 Provide Material Specifications STEP 3 Select Pavement Structure STEP 2 Determine Subgrade Strength STEP 1 Calculate Design ESALs
  • 8.
  • 9.
    Design CBR Estimation Subgradestrength is that of the soil in its wettest condition Collect subgrade soil samples at appropriate intervals and depths At sections with significant fill, top of subgrade comprises borrow material. Evaluate borrow material In cut sections, top of subgrade comprises native soil Perform CBR testing, after soaking specimens for 4 days CBR can be obtained through correlation with DCP test results
  • 10.
    Design CBR Estimation CBRvalues often vary along project road If avg. CBR is used, about one half of pavement is over-designed; other half is under-designed If min. CBR is used, most of road is over- designed. Over-design is costly; under-design causes premature failure  Develop a cumulative percentile plot of CBR and select the tenth percentile as design CBR This value is exceeded by 90% of the available CBR values
  • 11.
    Design CBR Estimation Ifsubgrade characteristics change significantly over long sections, determine different design CBR for relatively uniform sections For design CBR of less than 2, subgrade soil treatment is necessary
  • 12.
    Design CBR Estimation- Example Results of 20 tests produced the following subgrade CBR values: 45, 43, 40, 38, 36, 32, 28, 22, 10, 48, 50, 52, 55, 58, 64, 70, 75, 17, 32 and 5. Determine the design CBR. Solution (Method 1) – Cumulative Percentile Plot 1. Use Excel’s percentrank function to compute cumulative percentile of each CBR value 2. Plot cumulative percentile versus CBR 3. Read CBR at 10th percentile to obtain design CBR
  • 13.
    Solution (Method 1)– Cumulative Percentile Plot
  • 14.
    Solution (Method 2)– Percentile Plot 1. Arrange CBR in ascending (or descending) order 2. Find number of CBR that is equal to or greater than a given CBR 3. Compute percent of total number of CBR that is equal to or greater than (percentile) 4. Plot percentile on y-axis versus CBR on x-axis and draw a best-fit curve 5. Read off CBR at the 90th percentile to as design CBR
  • 15.
    Solution (Method 2)– Percentile Plot
  • 16.
    Solution (Method 2)– Percentile Plot
  • 17.
    Identifying Uniform SubgradeSections Better characterizes subgrade for cost-effective pavement design and rehabilitation Direct plots of soil data (e.g., CBR vs distance) may help to identify uniform sections, but such assessments may be highly subjective Cumulative sum of deviation identifies uniform subgrade sections more clearly
  • 18.
    Cumulative Sum ofDeviation 𝐂𝐂𝐂𝐂𝐂𝐂𝐂𝐂𝐂𝐂 = � 𝐢𝐢=𝟏𝟏 𝐧𝐧 𝐱𝐱𝐢𝐢 − � 𝐱𝐱 Where: CUSUM = cumulative sum of deviations xi = data measured at point x � x = mean of measured data  Plot cumulative sum of deviations vs chainage  Major changes in slope indicate changes in soil properties
  • 19.
    Cumulative Sum ofDeviation  Length of uniform sections must be practical for pavement design and construction.  Determine design CBR and pavement design for each uniform section, if it is practical to do so. Alternatively, subgrade improvement can be done to allow for one design solution.  Cumulative sum of deviation applies to other pavement data (e.g., FWD)  Delineation of uniform sections is not exact science, and some variations can be expected.
  • 20.
    Illustrative Example Subgrade soilsamples were collected at a 1.0-km interval from a project road and tested for CBR. Based on the test results in the table, delineate the road into nominal uniform sections.
  • 21.
    Solution A (Preferred)– Cumulative Sum of Deviation (a) Find the mean CBR (b)Subtract the mean CBR from each CBR (c) Cumulatively sum the deviations from the mean CBR (d)Plot cumulative sum of deviations vs. chainage (e) Determine major changes in slope
  • 22.
    Solution A (Preferred)– Cum. Sum of Deviation Plot
  • 23.
    Solution B (Comparison)– Plot of CBR Values
  • 24.
    Results Comparison Method Uniform Section(km) 1 2 3 Cum. Sum of Deviation 0 – 3 3 – 15 15 – 20 Direct CBR Plot 0 – 4 4 – 11 11 – 20
  • 25.
    ORN 31 DesignProcess EALF = ? STEP 4 Provide Material Specifications STEP 3 Select Pavement Structure STEP 2 Determine Subgrade Strength STEP 1 Calculate Design ESALs
  • 26.
    Select Pavement Structure Use design CBR and ESALs to select a pavement structure from TRL design charts  Pay attention to notes beneath the design charts  ORN 31 pavement thickness recommendations are minimum requirements  Compare ORN 31 thickness recommendations with GHA Pavement Design Manual (1998)
  • 27.
    ORN 31 DesignChart - Example
  • 28.
    Minimum Thickness Recommendations (GHAPavement Design Manual, 1998)
  • 29.
    ORN 31 DesignProcess EALF = ? STEP 4 Provide Material Specifications STEP 3 Select Pavement Structure STEP 2 Determine Subgrade Strength STEP 1 Calculate Design ESALs
  • 30.
    Material Specifications  ORN31 was not specifically developed for Ghana, and so its material specifications may not fully conform to our local specifications  Compare ORN 31 material specifications with those of Ghana. Examples:  Standard Specification for Road and Bridge Works (2007)  Manual for Low Volume Roads: Part B – Materials, Pavement Design and Construction, Ministry of Roads and Highways, 2019 – online
  • 31.
    ORN 31 MaterialSpecifications Examples
  • 32.
    ORN 31 MaterialSpecifications Examples
  • 33.
    Standard Spec. forRoad and Bridge Works (2007) Material Specifications - Examples Natural Subbase and Base Materials
  • 34.
    Standard Spec. forRoad and Bridge Works (2007) Material Specifications - Examples